Hydrate Inhibitors Market Size and Share
Market Overview
| Study Period | 2021 - 2031 |
|---|---|
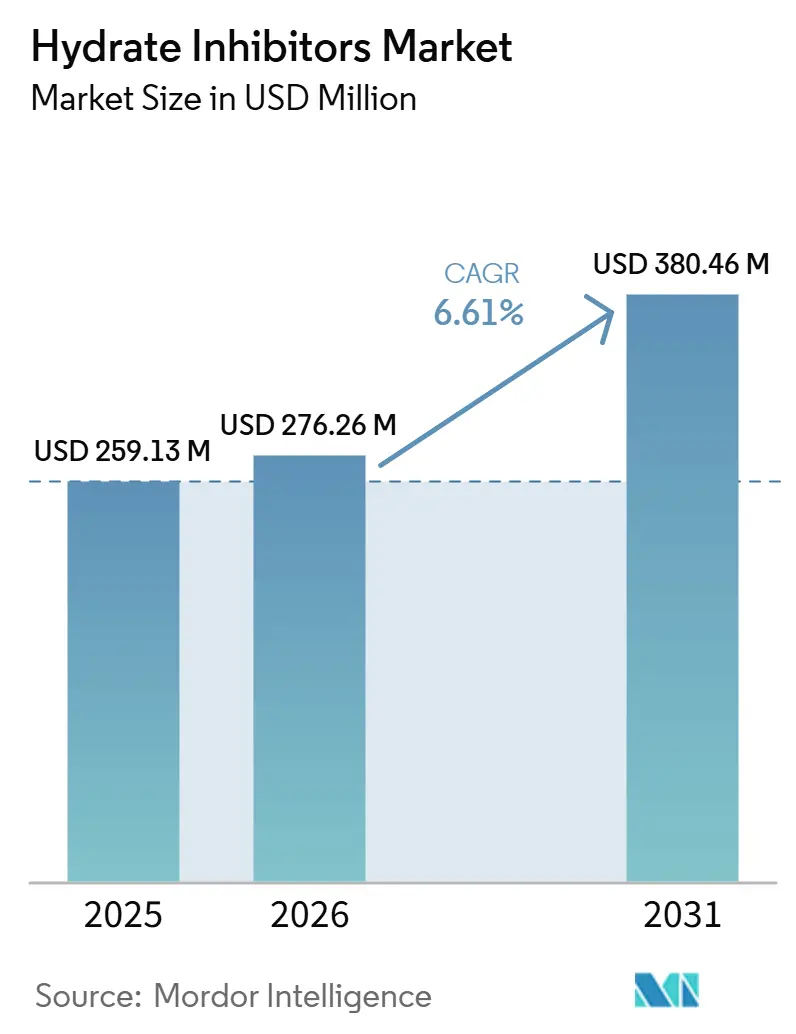
| Market Size (2026) | USD 276.26 Million |
| Market Size (2031) | USD 380.46 Million |
| Growth Rate (2026 - 2031) | 6.61% CAGR |
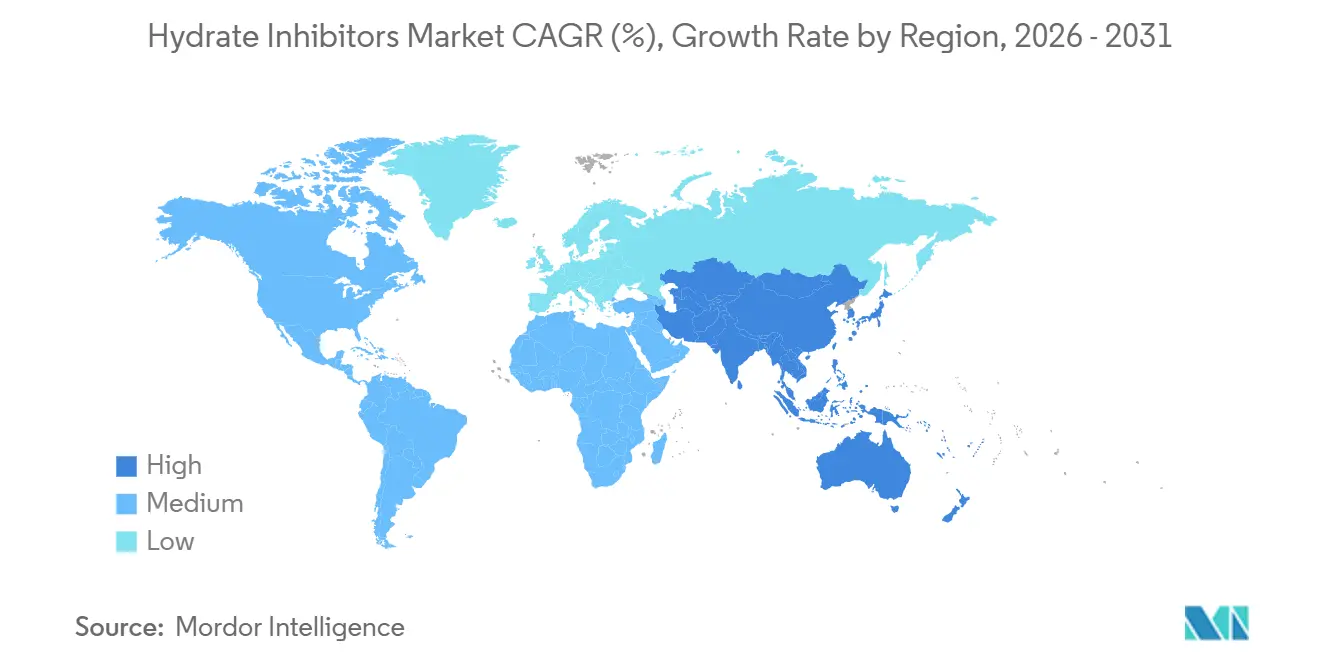
| Fastest Growing Market | Asia Pacific |
| Largest Market | North America |
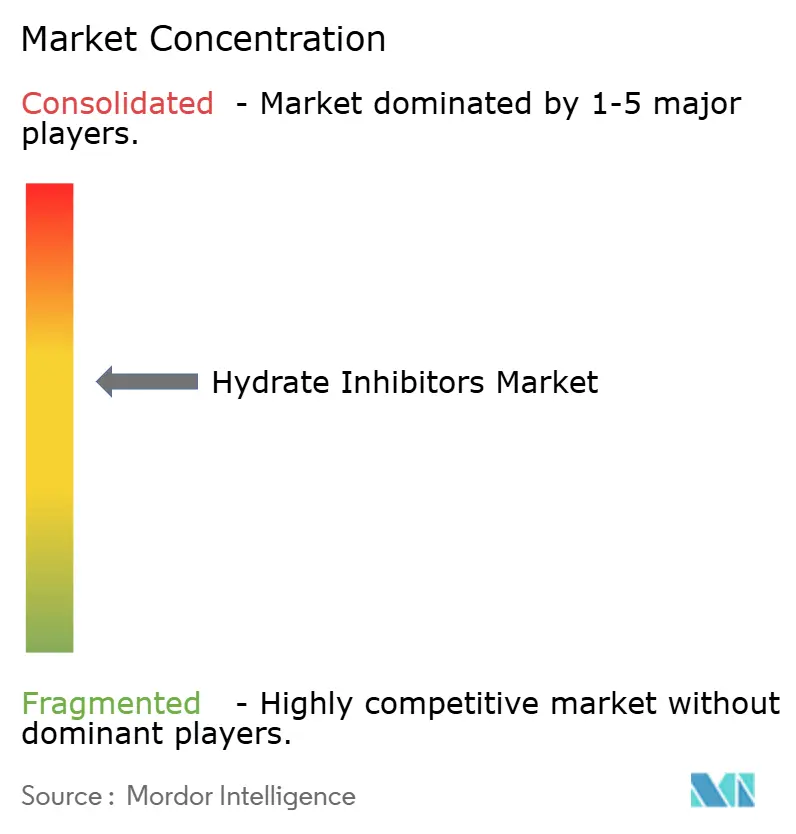
| Market Concentration | Medium |
Major Players *Disclaimer: Major Players sorted in no particular order Image © Mordor Intelligence. Reuse requires attribution under CC BY 4.0. | |
Hydrate Inhibitors Market Analysis by Mordor Intelligence
The Hydrate Inhibitors Market size is expected to increase from USD 259.13 million in 2025 to USD 276.26 million in 2026 and reach USD 380.46 million by 2031, growing at a CAGR of 6.61% over 2026-2031. Operators are replacing episodic methanol washes with purpose-built subsea chemical-injection skids positioned near the wellhead. This shift is demonstrated by Qatar’s North Field East project, where monoethylene glycol (MEG) is continuously pumped through a 500-kilometer pipeline grid. Ultra-deepwater tie-backs exceeding 100 kilometers and operating at pressures above 20,000 psi are driving demand for low-dosage kinetic and anti-agglomerant chemistries, which function effectively at 1-3% by weight compared to the 30-60% required for thermodynamic inhibitors. Liquefied-natural-gas (LNG) capacity under construction across Asia and the Middle-East is adding extensive cryogenic trunk lines, each requiring hydrate-control programs tailored to high-water-cut gas streams. Environmental regulations are accelerating product reformulation; a November 2025 U.S. EPA rule now requires producers to notify the agency 90 days in advance if quaternary-ammonium chemicals could reach 160 ppb in surface water, pushing operators toward biodegradable alternatives. Competitive intensity remains moderate, as the top five suppliers, including Baker Hughes, SLB, Halliburton, BASF, and Clariant, bundle hydrate inhibitors with corrosion, scale, and drag-reducing agents under multi-year flow-assurance contracts.
Key Report Takeaways
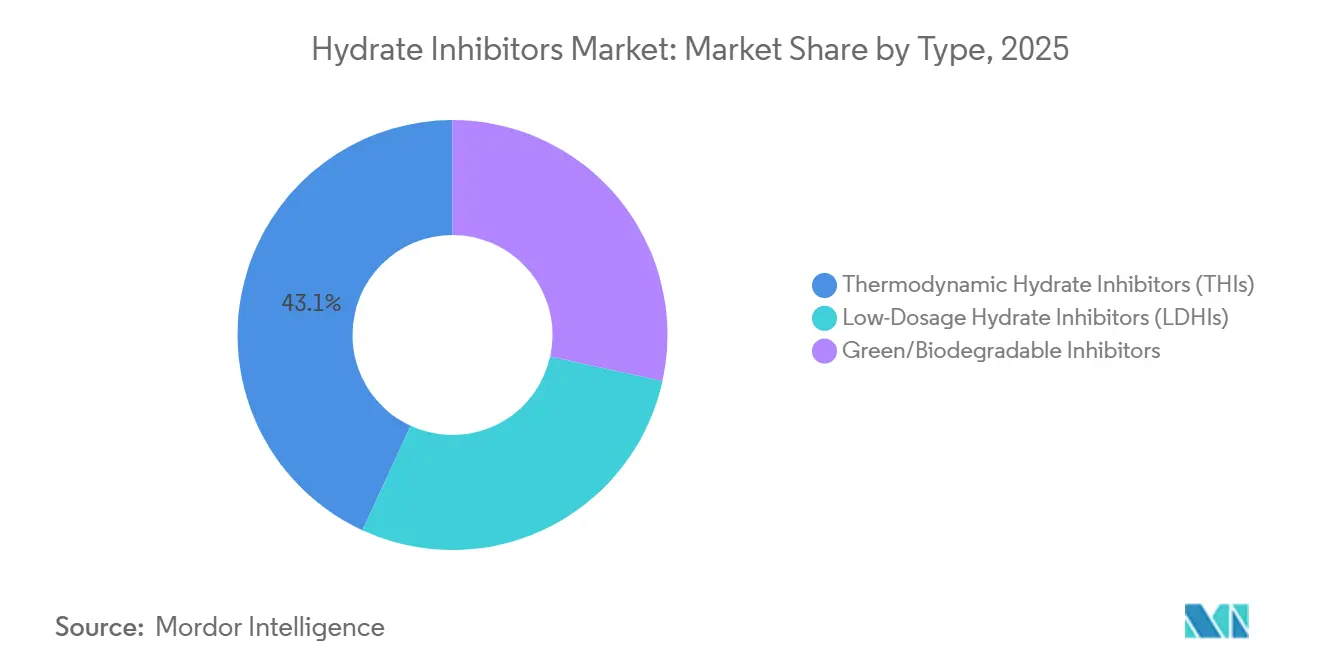
- By type, thermodynamic hydrate inhibitors led with 43.13% of the hydrate inhibitors market share in 2025; green/biodegradable inhibitors are projected to expand at a 7.44% CAGR through 2031.
- By form, liquid dominated with 77.89% of the hydrate inhibitors market share in 2025, whereas solid is forecast to grow at a 7.32% CAGR through 2031.
- By application, subsea pipelines and transportation accounted for 38.78% of the hydrate inhibitors market share in 2025 and are advancing at a 7.17% CAGR through 2031.
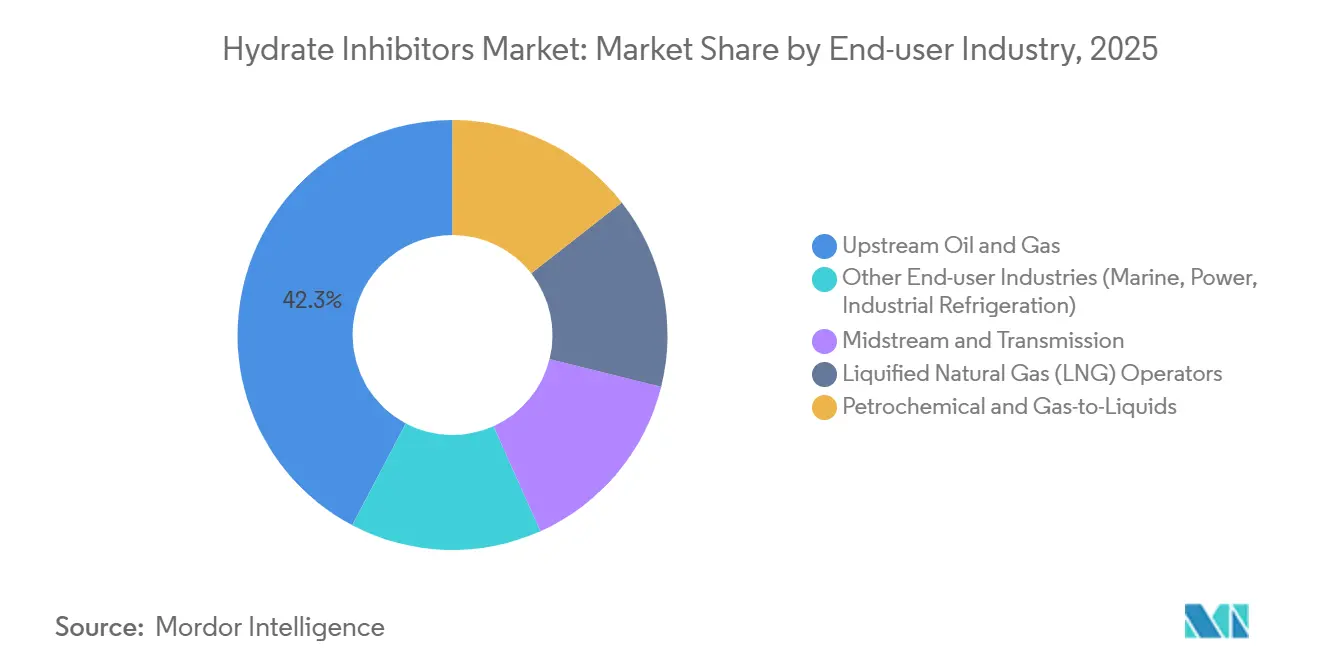
- By end-user industry, upstream oil and gas held 42.27% of the hydrate inhibitors market share in 2025 while also posting the fastest 7.26% CAGR through 2031.
- By geography, North America commanded 33.45% of the hydrate inhibitors market share in 2025; Asia-Pacific is set to record the highest 7.25% CAGR through 2031.
Note: Market size and forecast figures in this report are generated using Mordor Intelligence’s proprietary estimation framework, updated with the latest available data and insights as of January 2026.
Global Hydrate Inhibitors Market Trends and Insights
Drivers Impact Analysis*
| Driver | (~) % Impact on CAGR Forecast | Geographic Relevance | Impact Timeline |
|---|---|---|---|
| Expansion of long-distance subsea tie-backs | +1.8% | Global, concentrated in Gulf of Mexico, West Africa, North Sea | Medium term (2-4 years) |
| Growing LNG trunk-line and gas-pipeline construction | +1.5% | Asia-Pacific core, spill-over to Middle-East and North America | Short term (≤ 2 years) |
| Emergence of CO₂-rich CCS/CCUS flowlines | +0.9% | Europe (North Sea), North America (Gulf Coast), Middle-East | Long term (≥ 4 years) |
| Shift toward all-electric subsea architecture | +0.6% | Global deepwater provinces (Brazil, Angola, Norway) | Medium term (2-4 years) |
| Demand for hydrate inhibitors in hydrogen carrier pipelines | +0.4% | Europe, Japan, South Korea (ammonia import terminals) | Long term (≥ 4 years) |
| Source: Mordor Intelligence | |||
Expansion of Long-Distance Subsea Tie-Backs
Ultra-long tie-backs exceeding 50 kilometers have become standard as near-field reservoirs are depleted. Clariant’s chemistry for the 2026 Shenandoah start-up in the Gulf of Mexico highlights the evolving operational requirements, where continuous anti-agglomerant dosing ensures flow at pressures above 20,000 psi. Low-dosage inhibitors, functioning at 1-3% by weight, reduce offshore storage volumes by up to 50% compared to bulk MEG, lowering helicopter resupply costs. All-electric subsea layouts incorporate chemical tanks on the seabed, enabling real-time telemetry to adjust dosing rates. This concept has been successfully implemented at Eni’s Zohr gas field, where automated feedback loops reduced annual MEG consumption by 8-12%. For tie-backs extending beyond approximately 40 kilometers, chemicals are more cost-effective than pipe-in-pipe insulation, driving demand for advanced hydrate-control solutions.
Growing LNG Trunk-line and Gas-pipeline Construction
China, India, and Southeast Asia are commissioning new LNG import terminals, collectively adding double-digit billions of cubic meters of regasification capacity between 2024 and 2026. These terminals connect to extensive onshore pipelines traversing humid, monsoon-prone regions where seasonal cooling induces hydrate formation. Consequently, year-round inhibitor injection is a standard operational requirement, as seen in India’s 3,000-kilometer east-to-west grid completed in March 2026. Floating LNG vessels, such as Indonesia’s 1.6 bcm-per-year Genting FLNG, rely exclusively on kinetic inhibitors due to the absence of thermal mass in offshore locations. Qatar’s LNG expansion includes dedicated MEG delivery loops with onshore glycol regeneration, reducing chemical costs per ton of LNG by approximately 20% over the field’s lifespan.
Emergence of CO₂-Rich CCS/CCUS Flowlines
Commercial carbon-capture networks, such as the U.K.’s HyNet project, are expected to transport millions of tons of dense-phase CO₂ through seabed pipelines by 2027, and CO₂ hydrates form at higher temperatures than methane hydrates, necessitating customized kinetic inhibitor packages[1]Project Update, “HyNet Carbon Capture Network,” HyNet, hyntrltd.co.uk. Laboratory studies published in the Arabian Journal for Science and Engineering indicate that hydrate equilibrium curves for 95% CO₂ streams shift upward by 5–10 °C, making even minor cooling events a potential risk for line blockages. Operators pre-inject inhibitors before start-ups and during blow-downs to mitigate Joule-Thomson cooling effects. The upcoming ISO 27919 standard will formalize testing protocols referencing API 17TR5, requiring vendors to validate products under pure-CO₂ conditions.
Shift Toward All-Electric Subsea Architecture
Subsea production systems utilizing electric actuators instead of hydraulics reduce umbilical diameters, creating additional space for chemical conduits. At Zohr, an electric-powered chemical skid measures MEG concentration in real time, reducing annual chemical volumes by approximately 10% while minimizing personnel exposure during resupply operations. Sensor technologies like HydraSENS monitor slip velocity between phases and issue hydrate-risk alerts within seconds. Brazilian pre-salt operators report a 30% reduction in helicopter flights after implementing such closed-loop systems, resulting in annual savings of USD 1.5–2 million per field.
Restraints Impact Analysis*
| Restraint | (~) % Impact on CAGR Forecast | Geographic Relevance | Impact Timeline |
|---|---|---|---|
| Upstream CAPEX cyclicality tied to Brent crude prices | -1.2% | Global, acute in North America shale and West Africa offshore | Short term (≤ 2 years) |
| Regulatory phase-out of persistent quaternary surfactants | -0.7% | North America (EPA), Europe (REACH), Asia-Pacific (emerging) | Medium term (2-4 years) |
| Thermal subsea insulation competing with chemical inhibitors | -0.9% | North Sea, Gulf of Mexico (short tie-backs less than 40 km) | Medium term (2-4 years) |
| Source: Mordor Intelligence | |||
Upstream CAPEX Cyclicality Tied to Brent Crude Prices
When Brent crude prices fall below USD 60 per barrel, operators often defer new subsea tie-back projects within a single budgeting cycle, leading to immediate reductions in chemical procurement. Conversely, price recoveries typically stimulate project approvals only after an 18-24-month delay due to the time required for engineering and procurement processes to resume. For example, Chevron has indicated a 10-15% fluctuation in its 2026 deepwater budget based on price forecasts, directly impacting hydrate-inhibitor tenders. North American shale operations respond even more rapidly; declining well counts reduce gathering-line utilization, enabling producers to cut inhibitor dosages by double digits within a single quarter.
Regulatory Phase-Out of Persistent Quaternary Surfactants
The EPA’s 2025 Significant New Use Rule requires 90-day pre-clearance if quaternary ammonium levels are expected to exceed 160 ppb in surface water, effectively prohibiting open-air spray applications in regions like the Gulf of Mexico[2]News Release, “EPA Issues SNUR for PMN P-20-73,” Federal Register, federalregister.gov. Similarly, Europe’s REACH program is reviewing several C12-C14 quaternary ammonium compounds. Once an authorization list is published, suppliers will face significant reformulation and re-testing costs. While field trials of bio-based alternatives have demonstrated promising 97% corrosion inhibition, dosage rates vary with seawater salinity, increasing operational costs until further optimization is achieved.
*Our forecasts treat driver/restraint impacts as directional, not additive. The impact forecasts reflect baseline growth, mix effects, and variable interactions.
Segment Analysis
By Type: Biodegradables Challenge Methanol Dominance
Thermodynamic inhibitors retained 43.13% of the hydrate inhibitors market share in 2025 due to their established effectiveness in onshore gas-processing loops, where recovered MEG achieves up to 95% recycling efficiency. The market size for green/biodegradable inhibitors is anticipated to grow at a 7.44% CAGR through 2031, supported by a disodium oleate surfactant that demonstrated 68.9% biodegradation under OECD 301B standards while maintaining anti-agglomerant functionality. Vendors such as Innospec are offering API 17TR6-validated low-dose chemistries for ultra-high-pressure wells, reducing logistics costs by approximately USD 500 per delivered barrel.
Legacy methanol and MEG will remain cost-effective in regions with existing regeneration units; however, stricter discharge regulations in the North Sea and U.S. Gulf indicate a gradual shift toward greener alternatives. Operators involved in life-extension projects are adopting dual-inhibitor strategies, utilizing MEG during ramp-up phases and transitioning to biodegradable anti-agglomerants for steady-state operations to balance costs with compliance requirements. The coexistence of both chemistries is expected to continue, but the premium pricing of green products in environmentally sensitive regions suggests increasing margin opportunities for specialty suppliers.


By Form: Liquids Dominate, Solids Find Niche
Liquid inhibitors accounted for 77.89% of 2025 revenue, as their use simplifies topside architecture by enabling a single injection umbilical to meter hydrate, scale, and corrosion inhibitors simultaneously. Solid inhibitors are projected to grow at a 7.32% CAGR through 2031, driven by remote wellhead pilots in North America that reduced quarterly helicopter runs by 40%.
Solid pellets embedded in polymer matrices dissolve over 30-90 days, maintaining 500-1,000 ppm inhibitor in-situ. This approach is particularly appealing for unmanned satellite fields where liquid tanks are impractical. However, variability in dissolution rates and risks of formation damage limit broader adoption. Hybrid schedules, where operators begin with liquid inhibitors during commissioning and transition to pellets for steady-state operations, are gaining acceptance.
By Application: Subsea Pipelines Outpace Gas Processing
Subsea pipelines and transportation captured 38.78% of the market share in 2025, as long wet-tree tie-backs lack the thermal inertia of buried onshore lines. This segment is also the fastest-growing, with a 7.17% CAGR projected through 2031, driven by projects located more than 100 kilometers from host platforms.
Gas-processing plants and LNG trains are experiencing modest growth due to the use of heaters, insulation, and dehydration units, which reduce the need for chemical inhibitors. However, new floating LNG barges and onshore regasification jetties continue to specify dedicated low-dose inhibitor skids, as cryogenic operating conditions increase the risk of hydrate formation during unscheduled shutdowns.
By End-user Industry: Upstream Oil and Gas Drives Revenue
The upstream oil and gas industry led the market with 42.27% of global revenue in 2025, reflecting continuous down-hole and subsea dosing to mitigate hydrates, scale, and corrosion. This segment is also the fastest-growing, with a 7.26% CAGR projected through 2031.
Midstream pipelines represent a secondary but growing market as countries expand transmission grids to accommodate new LNG import terminals. For example, Baker Hughes’ bundled drag-reducer and hydrate-controller contract on U.S. Gulf Coast pipelines demonstrates how chemical solutions are increasingly spanning the entire value chain, capturing additional spending beyond the wellbore.
Geography Analysis
North America held a 33.45% market share in 2025, supported by deepwater volumes in the Gulf of Mexico and shale-gas gathering systems. The adoption of digital dosing platforms, which reduced chemical consumption by nearly 10%, moderated absolute growth despite the region's dense asset base.
Asia-Pacific is the fastest-growing region, with a 7.25% CAGR projected through 2031. Growth is driven by China’s new LNG terminals and India’s 3,000-kilometer gas pipeline, both designed with 24-hour MEG or kinetic-inhibitor loops to handle high water cuts and temperature variations. Additional demand comes from floating LNG hulls under construction in Indonesia and Malaysia, where thermal substitutes are unavailable.
Europe’s market share remains stable as North Sea operators increasingly use thermal insulation for short tie-backs. However, the region’s emerging CCS pipelines are creating new demand for CO₂-specific inhibitors. The Middle-East and Africa benefit from Qatar’s 500-kilometer dedicated MEG system and Saudi Arabia’s pipeline expansions. South America is progressing slowly, with pre-salt fields relying on chemical logistics as the most cost-effective flow-assurance solution.

Competitive Landscape
The hydrate inhibitors market is moderately concentrated, with the five largest vendors accounting for approximately 52% of 2025 revenue. This level of concentration provides scale economies while leaving opportunities for specialized players. SLB’s acquisition of ChampionX in March 2026 added approximately USD 400 million in annual chemical revenue and expanded cross-selling opportunities within its subsea controls portfolio. Conversely, Halliburton has divested portions of its Multi-Chem unit to focus on completion fluids, creating opportunities for regional competitors.
BASF expanded its Basoflux production in Spain in 2025, reflecting the USD 15-20 million fixed investment required to secure large, multiyear supply contracts with Mediterranean operators. Innospec’s API-17TR6-qualified LaZuli series targets 15,000-psi projects where traditional quaternary packages are ineffective, allowing the company to charge a 20-30% premium.
Technological advancements, rather than capacity expansion, are becoming the primary competitive differentiator. For instance, Baker Hughes’ Leucipa AI module analyzes real-time pressure and temperature data to predict hydrate risks and reduce chemical usage by up to 12%, embedding switching costs into its service contracts. Patent activity in 2025 focused on biodegradable kinetic inhibitors, reflecting the growing global restrictions on persistent surfactants.
Hydrate Inhibitors Industry Leaders
SLB
Baker Hughes Company
Halliburton
BASF
Clariant
- *Disclaimer: Major Players sorted in no particular order

Recent Industry Developments
- July 2025: SLB completed its acquisition of ChampionX Corporation. The acquisition aimed to strengthen SLB's production and recovery portfolio by incorporating advanced production chemicals, such as hydrate inhibitors, alongside artificial lift and subsea technology.
- February 2025: A new class of kinetic hydrate inhibitors (KHIs) based on N-isopropylacrylamide (NIPAM) and glycol ether copolymers was developed for efficient, low-dosage gas hydrate inhibition. It was particularly effective in sour (H2S-containing) environments.


Global Hydrate Inhibitors Market Report Scope
Hydrate inhibitors are chemicals utilized in oil and gas production to prevent the formation of ice-like hydrate crystals, which can block pipelines, valves, and wellheads. The selection of hydrate inhibitors depends on factors such as temperature, pressure, and water cut.
The Hydrate Inhibitors Market is segmented into type, form, application, end-user industry, and geography. By type, the market is segmented into thermodynamic hydrate inhibitors (THIs), low-dosage hydrate inhibitors (LDHIs), and green/biodegradable inhibitors. By form, the market is segmented into liquid and solid. By application, the market is segmented into subsea pipelines and transportation, oil and gas production wells, gas processing and separation plants, liquefied natural gas (LNG) and floating liquefied natural gas (FLNG) facilities, and carbon capture storage (CCS)/carbon capture, storage, and utilization (CCUS) and carbon dioxide pipelines. By end-user industry, the market is segmented into upstream oil and gas, midstream and transmission, liquefied natural gas (LNG) operators, petrochemical and gas-to-liquids, and other end-user industries (marine, power, industrial refrigeration). The report also covers the market size and forecasts for hydrate inhibitors in 17 countries across major regions. For each segment, the market sizing and forecasts have been done on the basis of value (USD).
| Thermodynamic Hydrate Inhibitors (THIs) |
| Low-Dosage Hydrate Inhibitors (LDHIs) |
| Green/Biodegradable Inhibitors |
| Liquid |
| Solid |
| Subsea Pipelines and Transportation |
| Oil and Gas Production Wells |
| Gas Processing and Separation Plants |
| Liquified Natural Gas (LNG) and Floating Liquefied Natural Gas (FLNG) Facilities |
| Carbon Capture Storage (CCS)/Carbon Capture, Storage, and Utilization (CCUS) and Carbon Dioxide Pipelines |
| Upstream Oil and Gas |
| Midstream and Transmission |
| Liquified Natural Gas (LNG) Operators |
| Petrochemical and Gas-to-Liquids |
| Other End-user Industries (Marine, Power, Industrial Refrigeration) |
| Asia-Pacific | China |
| India | |
| Japan | |
| South Korea | |
| ASEAN Countries | |
| Rest of Asia-Pacific | |
| North America | United States |
| Canada | |
| Mexico | |
| Europe | Germany |
| United Kingdom | |
| France | |
| Italy | |
| Spain | |
| Russia | |
| NORDIC Countries | |
| Rest of Europe | |
| South America | Brazil |
| Argentina | |
| Rest of South America | |
| Middle-East and Africa | Saudi Arabia |
| South Africa | |
| Rest of Middle-East and Africa |
| By Type | Thermodynamic Hydrate Inhibitors (THIs) | |
| Low-Dosage Hydrate Inhibitors (LDHIs) | ||
| Green/Biodegradable Inhibitors | ||
| By Form | Liquid | |
| Solid | ||
| By Application | Subsea Pipelines and Transportation | |
| Oil and Gas Production Wells | ||
| Gas Processing and Separation Plants | ||
| Liquified Natural Gas (LNG) and Floating Liquefied Natural Gas (FLNG) Facilities | ||
| Carbon Capture Storage (CCS)/Carbon Capture, Storage, and Utilization (CCUS) and Carbon Dioxide Pipelines | ||
| By End-user Industry | Upstream Oil and Gas | |
| Midstream and Transmission | ||
| Liquified Natural Gas (LNG) Operators | ||
| Petrochemical and Gas-to-Liquids | ||
| Other End-user Industries (Marine, Power, Industrial Refrigeration) | ||
| By Geography | Asia-Pacific | China |
| India | ||
| Japan | ||
| South Korea | ||
| ASEAN Countries | ||
| Rest of Asia-Pacific | ||
| North America | United States | |
| Canada | ||
| Mexico | ||
| Europe | Germany | |
| United Kingdom | ||
| France | ||
| Italy | ||
| Spain | ||
| Russia | ||
| NORDIC Countries | ||
| Rest of Europe | ||
| South America | Brazil | |
| Argentina | ||
| Rest of South America | ||
| Middle-East and Africa | Saudi Arabia | |
| South Africa | ||
| Rest of Middle-East and Africa | ||


Key Questions Answered in the Report
What is the size of the hydrate inhibitors market?
The hydrate inhibitors market size stands at USD 276.26 million in 2026 and is projected to reach USD 380.46 million by 2031.
Which type is expanding fastest through 2031?
Green and biodegradable inhibitors are projected to post a 7.44% CAGR through 2031 thanks to tighter discharge regulations.
Why are subsea pipelines the key application for hydrate inhibitors?
Long offshore tie-backs lack insulation options, making continuous chemical dosing essential to keep hydrates from plugging flowlines.
Which region offers the strongest growth through 2031?
Asia-Pacific leads with a 7.25% CAGR through 2031, driven by new LNG import terminals and associated pipelines requiring year-round inhibition.
Page last updated on:


