
Lipid Regulators Market Size and Share
Market Overview
| Study Period | 2022 - 2031 |
|---|---|
| Market Size (2026) | USD 34.94 Billion |
| Market Size (2031) | USD 42.43 Billion |
| Growth Rate (2026 - 2031) | 3.96 % |
| Fastest Growing Market | Asia Pacific |
| Largest Market | North America |
| Market Concentration | Medium |
Major Players *Disclaimer: Major Players sorted in no particular order Image © Mordor Intelligence. Reuse requires attribution under CC BY 4.0. | |
Lipid Regulators Market Analysis by Mordor Intelligence
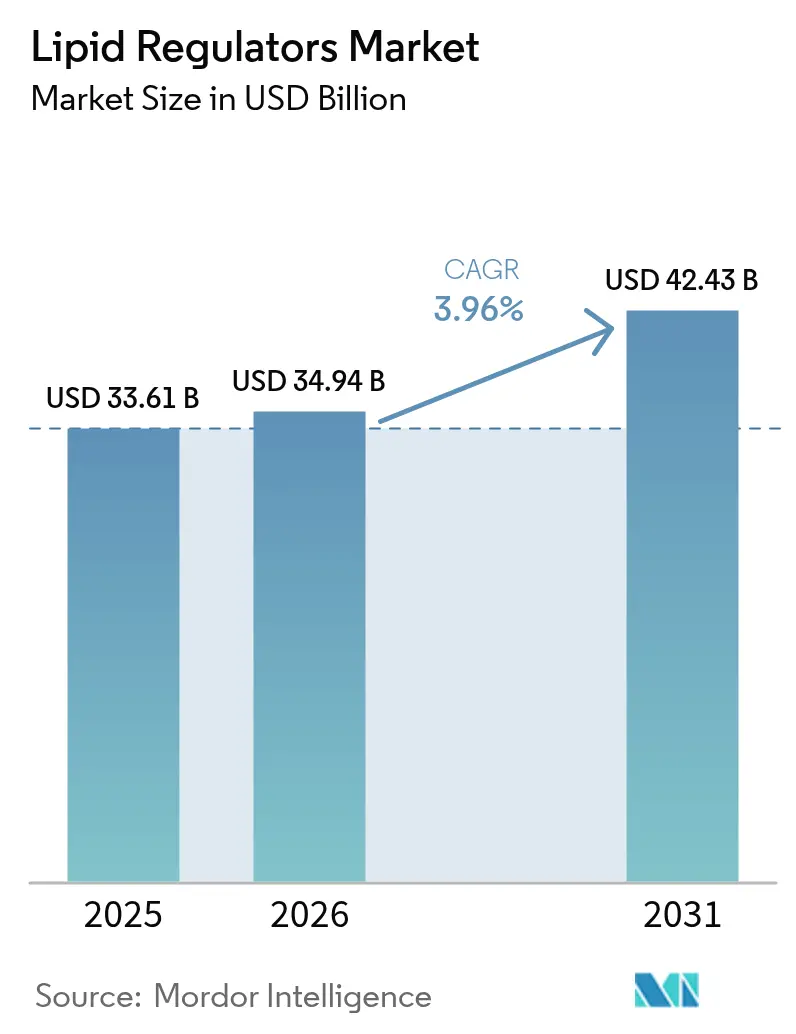
The lipid regulators market size was valued at USD 33.61 billion in 2025 and estimated to grow from USD 34.94 billion in 2026 to reach USD 42.43 billion by 2031, at a CAGR of 3.96% during the forecast period (2026-2031). This controlled expansion follows the post-statin patent-cliff stabilization and reflects the shift toward precision therapeutics such as RNA-interference and oral PCSK9 inhibitors. Demand is underpinned by the escalating global cardiovascular disease burden, where high LDL-cholesterol contributed to 3.81 million deaths in 2021. Growing acceptance of combination therapies, expanding screening initiatives in emerging economies, and payer willingness to reimburse high-risk patients for advanced agents further reinforce momentum. Simultaneously, digital adherence platforms and remote monitoring programs enhance persistence, improving real-world outcomes and supporting steady revenue growth for manufacturers.
Key Report Takeaways
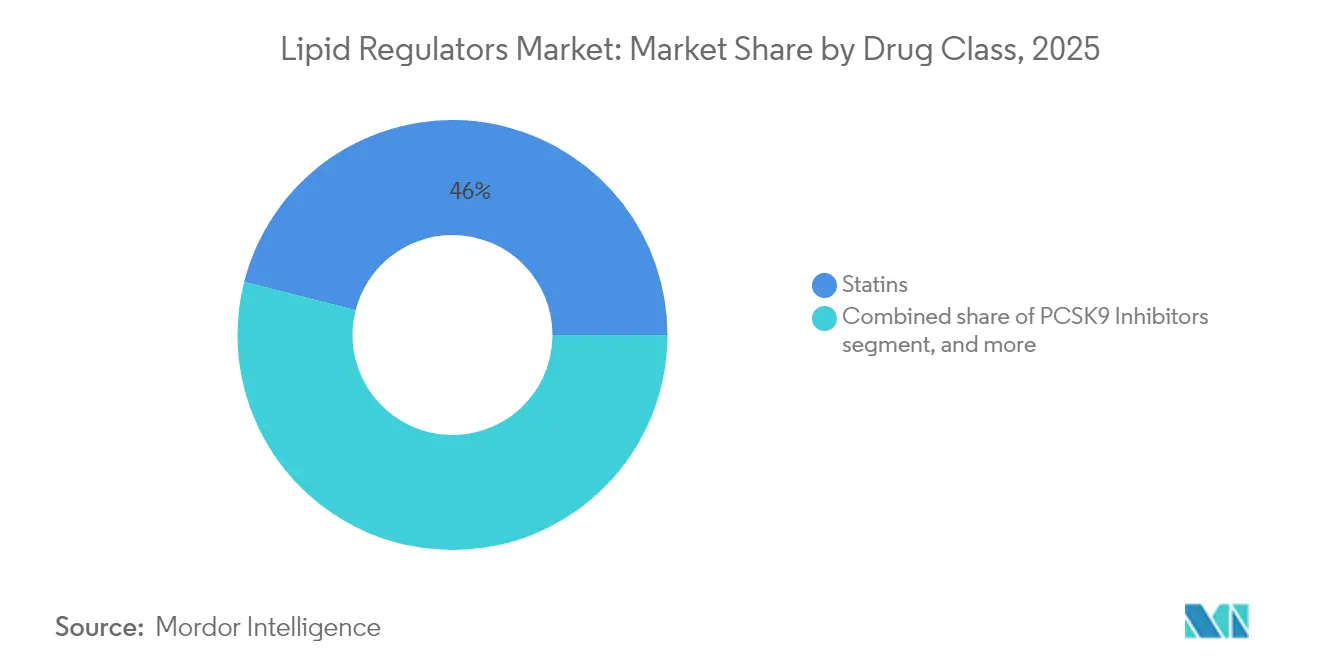
- By drug class, statins retained 46.02% of the lipid regulators market share in 2025, whereas PCSK9 inhibitors posted the fastest 6.35% CAGR to 2031.
- By patient type, primary hypercholesterolemia accounted for 38.12% of the lipid regulators market size in 2025, while hypertriglyceridemia registered the sharpest 6.28% CAGR.
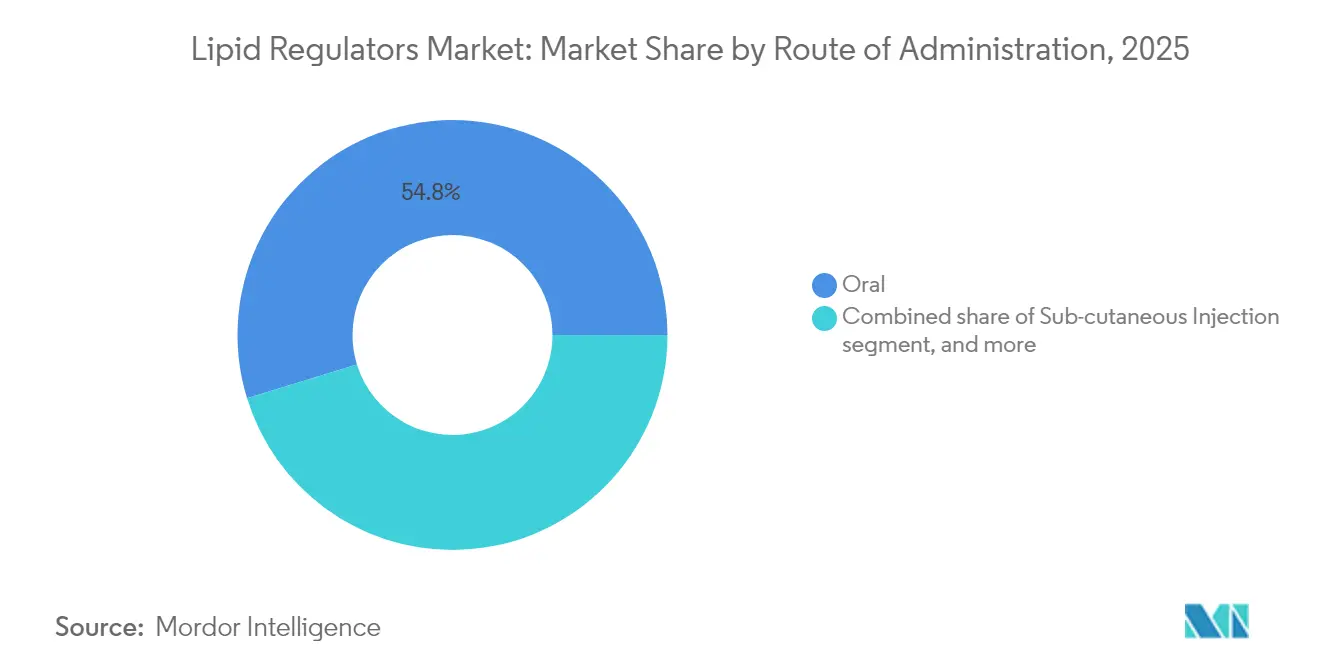
- By route of administration, oral dosage forms captured 54.76% share of the lipid regulators market size in 2025; in-vivo gene therapy is projected to accelerate at a 7.1% CAGR through 2031.
- By distribution channel, hospital pharmacies held 57.21% revenue share in 2025 as online pharmacies expanded fastest at a 7.4% CAGR.
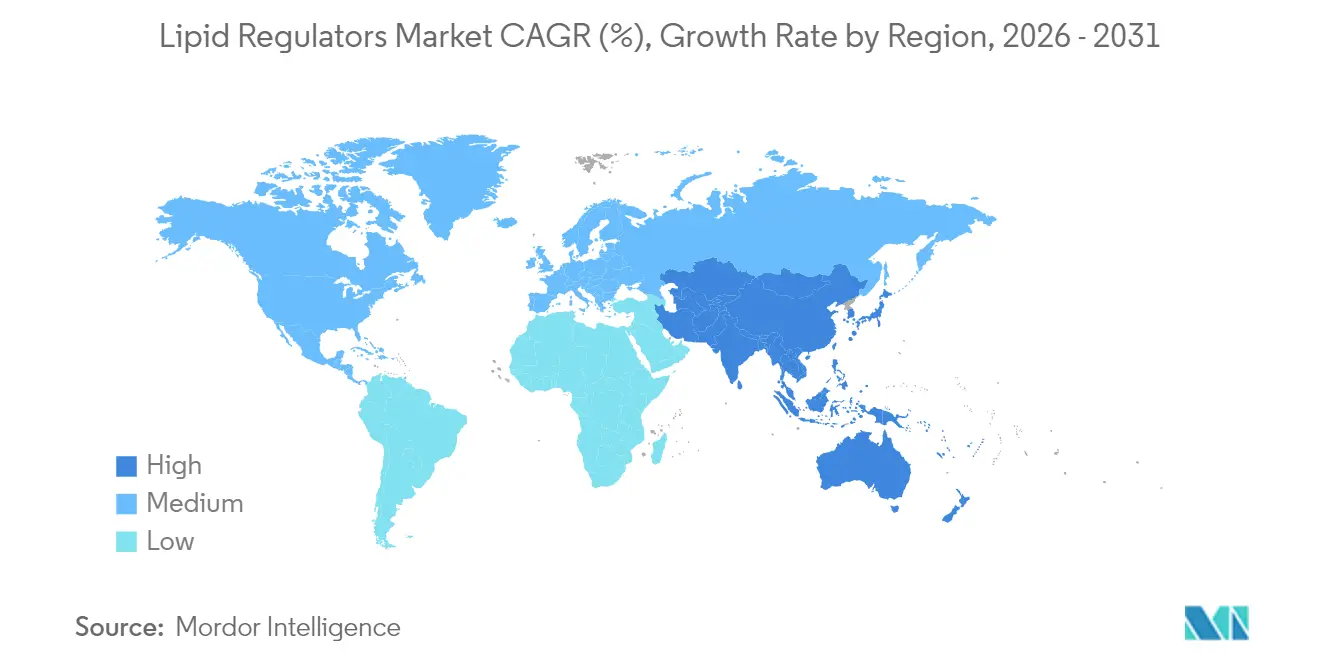
- By geography, North America held 42.75% revenue share in 2025, whereas, Asia-Pacific is projected to grow at a CAGR of 5.21% over the forecast period.
Note: Market size and forecast figures in this report are generated using Mordor Intelligence’s proprietary estimation framework, updated with the latest available data and insights as of 2026.
Market Trends and Insights
Drivers Impact Analysis of Lipid Regulators Market*
| Driver | % Impact on CAGR Forecast | Geographic Relevance | Impact Timeline |
|---|---|---|---|
| Escalating cardiovascular disease burden | +1.2% | North America & Europe lead | Long term (≥ 4 years) |
| Rising adoption of combination lipid-lowering therapies | +0.8% | North America & EU, extending to APAC | Medium term (2–4 years) |
| Innovation in long-acting RNAi and oral PCSK9 inhibitors | +1.1% | Global, led by North America | Medium term (2–4 years) |
| Increasing reimbursement coverage for high-risk populations | +0.7% | Core markets in North America & EU | Short term (≤ 2 years) |
| Expansion of preventive screening programs | +0.5% | APAC core, spill-over to MEA | Long term (≥ 4 years) |
| Growing integration of digital adherence tools | +0.4% | Global, early uptake in North America | Medium term (2–4 years) |
| Source: Mordor Intelligence | |||
Escalating Cardiovascular Disease Burden
Cardiovascular disease affects 127.9 million Americans in 2025, with atherosclerotic events driving USD 422.3 billion in annual economic costs[1]American Heart Association, “Heart Disease and Stroke Statistics 2025 Update,” heart.org. High LDL-cholesterol remains the most modifiable risk factor, producing an addressable global population of more than 1.5 billion adults. Aging demographics in high-income nations and rapid urbanization in Asia combine to push incidence upward. Consequently, healthcare systems intensify focus on preventive lipid control, ensuring the lipid regulators market gains durable volume growth. Multisector partnerships that subsidize screening in community clinics further expand the treated pool and support long-term prescription demand.
Rising Adoption of Combination Lipid-Lowering Therapies
Clinical trials such as TANDEM demonstrated that obicetrapib plus ezetimibe trimmed LDL-cholesterol by 48.6% over placebo. Fixed-dose combinations reduce pill burden and raise adherence, encouraging physicians to initiate dual therapy earlier, especially for familial hypercholesterolemia. Guideline revisions in 2024 introduced LDL-cholesterol targets below 55 mg/dL for very-high-risk patients, accelerating uptake. In response, companies launched products like Nexlizet, winning expanded FDA approval for risk reduction. This shift from stepwise escalation to precision combinations magnifies revenue per treated patient and consolidates brand loyalty in the lipid regulators market.
Innovation in Long-Acting RNAi and Oral PCSK9 Inhibitors
Inclisiran achieves roughly 50% LDL-cholesterol reductions with two injections per year[2]U.S. Food and Drug Administration, “Inclisiran Prescribing Information,” fda.gov. Emerging siRNA agents such as zerlasiran cut lipoprotein(a) by more than 80% in mid-stage trials[3]American College of Cardiology, “Zerlasiran First-in-Human Results,” acc.org. Meanwhile, AstraZeneca’s oral PCSK9 inhibitor AZD0780 delivered a 50.7% LDL-cholesterol fall in Phase IIb results. These modalities overcome injection fatigue and broaden specialist as well as primary-care prescribing. As safety data accumulate, long-acting RNAi and convenient oral agents are expected to migrate from niche high-risk cohorts to mainstream dyslipidemia management, augmenting the lipid regulators market.
Increasing Reimbursement Coverage for High-Risk Populations
Medicare’s 2024 decision to reimburse Wegovy for cardiovascular risk reduction opened the door for broader payer acceptance of preventive lipid therapy. The CLEAR Outcomes trial confirmed bempedoic acid’s 13% drop in major events, prompting an FDA label expansion that enlarges the U.S. eligible population to about 70 million adults. Health technology bodies in Europe also endorsed inclisiran based on cost-effectiveness. Improved coverage compresses patient out-of-pocket costs, stimulates prescribing, and offsets the high list prices of advanced therapies, directly lifting the lipid regulators market size.
Restraints Impact Analysis of Lipid Regulators Market*
| Restraints Impact Analysis | (~) % Impact on CAGR Forecast | Geographic Relevance | Impact Timeline |
|---|---|---|---|
| Intensifying generic competition in statin segment | −0.9% | Global, most acute in emerging markets | Short term (≤ 2 years) |
| High treatment costs of novel biologics | −0.6% | Global, particularly affecting LMIC access | Long term (≥ 4 years) |
| Limited access in low- and middle-income countries | −0.7% | LMICs across MEA, South America & parts of APAC | Long term (≥ 4 years) |
| Manufacturing complexity of nucleic acid therapies | −0.5% | Global, with heightened impact on decentralized production regions | Medium term (2–4 years) |
| Source: Mordor Intelligence | |||
Intensifying Generic Competition in Statin Segment
Expired patents hand sizeable share to low-cost producers, compressing prices and eroding branded revenue. Many national formularies enforce step-therapy protocols mandating generic statin trials before approving advanced drugs. In emerging markets, aggressive tendering further narrows margins. Manufacturers counter by bundling statins with ezetimibe or bempedoic acid, yet competitive intensity still moderates overall lipid regulators market growth during the forecast window.
High Treatment Costs of Novel Biologics
Annual therapy with PCSK9 monoclonal antibodies remains near USD 14,000, dwarfing sub-USD 100 generic statin regimens. RNA-based products require specialized manufacturing and cold-chain logistics, limiting cost-reduction levers. Although payer coverage improves in high-income regions, affordability in low- and middle-income countries lags, leaving sizeable populations undertreated and restraining universal lipid regulators market penetration.
*Our forecasts treat driver/restraint impacts as directional, not additive. The impact forecasts reflect baseline growth, mix effects, and variable interactions.
Lipid Regulators Market Segment Analysis
By Drug Class:
Therapeutic Innovation Commands Premium UptakeStatins contributed nearly half of 2025 revenue, yet their growth plateaus under generic commoditization. Fixed-dose combinations such as bempedoic acid plus ezetimibe differentiate through additive efficacy and convenience, cushioning erosion. PCSK9 inhibitors are projected to outpace others with a 6.35% CAGR, driven by mounting cardiovascular outcome evidence and the arrival of self-administered and oral formats. Cholesterol absorption inhibitors maintain relevance as backbone add-on agents. Meanwhile, ATP-citrate-lyase inhibitors gain traction among statin-intolerant populations after the 2024 FDA label expansion. Pipeline entrants targeting lipoprotein(a) could reshape the lipid regulators market size for high-risk genetic subsets once late-stage trials conclude.
Continued R&D investment focuses on oral small molecules and longer-acting injectables that address adherence bottlenecks. Developers emphasize robust endpoint trials, given payer insistence on outcome validation to justify premium costs. As competitor portfolios diversify, cross-class combination strategies proliferate, further boosting average selling prices without compromising tolerability.



By Patient Type:
Risk Stratification Drives Therapeutic AllocationPrimary hypercholesterolemia remained the anchor cohort, yet hypertriglyceridemia recorded the steepest 6.28% CAGR as clinicians recognize triglycerides’ role in residual cardiovascular risk. Familial hypercholesterolemia populations, especially heterozygous variants, gravitate toward RNAi and PCSK9 agents when statins underperform. Secondary prevention after ASCVD events solidifies consistent biologic demand due to stringent guideline targets. Diabetes and obesity prevention segments expand following GLP-1 cardiovascular data, opening cross-selling avenues for lipid-lowering brands.
Precision medicine tools, including polygenic risk scoring, segment patients more finely, informing therapy escalation earlier in the disease continuum. As payers reimburse pharmacogenetic testing, manufacturers tailor educational outreach to physicians, reinforcing guideline-aligned prescribing and elevating lipid regulators market share within high-risk clusters.
By Route of Administration:
Convenience Shapes Preference HierarchyTraditional oral tablets dominated with 54.76% share, reflecting patient familiarity and broad primary-care integration. Injectable biologics sustain strong uptake in cardiology and endocrinology clinics because of potent LDL-cholesterol reductions, but frequent administration limits adherence in some cohorts. Long-acting RNAi regimens that require twice-yearly dosing partially resolve this friction, while emerging oral PCSK9 molecules promise to recast the competitive landscape by uniting potency with convenience.
Gene-editing therapeutics, delivered intravenously or via lipid nanoparticles, advance through early trials targeting lifelong LDL-lowering in a single treatment. If safety hurdles clear, such one-time modalities could cannibalize chronic dosing models, expanding the total lipid regulators market size by offering curative appeal to payers.
By Distribution Channel:
Digital Platforms Strengthen Patient ReachHospital pharmacies continued to secure most sales, particularly for cold-chain-dependent biologics. Retail chains broaden over-the-counter statin service offerings, incorporating pharmacist-led lipid panels and algorithmic prescribing. Online pharmacies surged at a 7.4% CAGR, propelled by direct-to-consumer teleconsultations and automatic refills. Specialty clinics emerged as coordination hubs for familial hypercholesterolemia and complex dyslipidemia, integrating genetic counseling with therapy initiation.
COVID-era shifts toward home delivery normalized mail-order dispersion of chronic medications. Coupled with real-time adherence analytics, e-commerce platforms enhance persistence and hold potential to shift a greater portion of lipid regulators market share away from traditional bricks-and-mortar channels.
Geography Analysis
North America Lipid Regulators Market
North America accounted for 42.75% of 2025 revenue, benefitting from broad insurance coverage, mature clinical trial ecosystems, and rapid adoption of digital adherence tools. Strong payer emphasis on outcome-based reimbursement accelerates biologic uptake as long-term cost-offset models gain credibility. Prior authorization complexity still moderates immediate growth, yet streamlined electronic benefit verification systems reduce delays and support stable demand.
Europe Lipid Regulators Market
Europe follows a value-driven trajectory underpinned by unified EMA approvals and rigorous health technology assessments that reward demonstrable cardiovascular event reduction. Strong generic penetration lowers baseline treatment costs, enabling reinvestment in premium agents for high-risk cohorts. Ongoing post-Brexit regulatory realignment produces temporary launch stagger, but cross-border reference pricing maintains relative affordability and cushions patients from list-price volatility.
APAC Lipid Regulators Market
Asia-Pacific registers the swiftest 5.21% CAGR, stimulated by rising urban cardiovascular risk, policy-backed screening programs, and expanding middle-class insurance coverage. Local generic statin production ensures baseline access, but affordability gaps for newer agents persist. Evolving regulatory harmonization expedites novel product review, while multinational alliances with domestic firms facilitate market entry. China’s Healthy China 2030 agenda and India’s Ayushman Bharat scheme are expected to enlarge public funding envelopes for preventive cardiometabolic care, widening the addressable base for premium lipid-lowering therapies.
MEA and South America Lipid Regulators Market
South America, the Middle East, and Africa witness gradual improvement through donor-supported essential-medicine initiatives. Nevertheless, biologic uptake remains limited by constrained budgets and distribution logistics. Progressive tiered-pricing models and regional manufacturing partnerships are likely prerequisites to meaningful penetration in these territories.

Regulatory Landscape
Global lipid regulators regulation is shaped by stringent benefit-risk and outcomes evidence requirements from the US FDA and the European Medicines Agency (EMA), alongside payer-linked access controls for premium therapies. In 2026, the FDA expanded the treated addressable base across genetic dyslipidemia and triglyceride-driven risk management, including a pediatric label expansion for lomitapide (JUXTAPID) in homozygous familial hypercholesterolemia and approval of Ionis olezarsen (TRYNGOLZA) for severe hypertriglyceridemia (TG >= 500 mg/dL) to reduce triglycerides and acute pancreatitis risk. These actions clarify pathways for rare and high-risk segments and raise expectations for post-marketing safety monitoring for long-acting and nucleic-acid-based modalities.
In Europe, EMA activity in 2026 included CHMP support for extending Lojuxta into pediatric use and EU-level authorization of Redemplo (plozasiran), an siRNA therapy, for triglyceride reduction in familial chylomicronaemia syndrome, which supports continued regulatory openness to RNA-targeted lipid agents under centralized review. Pricing and policy measures also affect commercial strategy: Germany approved a reform package in 2026 that increases the mandatory manufacturer rebate on patented branded drugs (effective January 1, 2027), and the United States opened a Section 301 investigation in 2026 into German pharmaceutical pricing policies. This adds uncertainty around cross-border pricing, reference markets, and potential trade actions that can influence launch sequencing and supply planning for branded lipid therapies.
Competitive Landscape
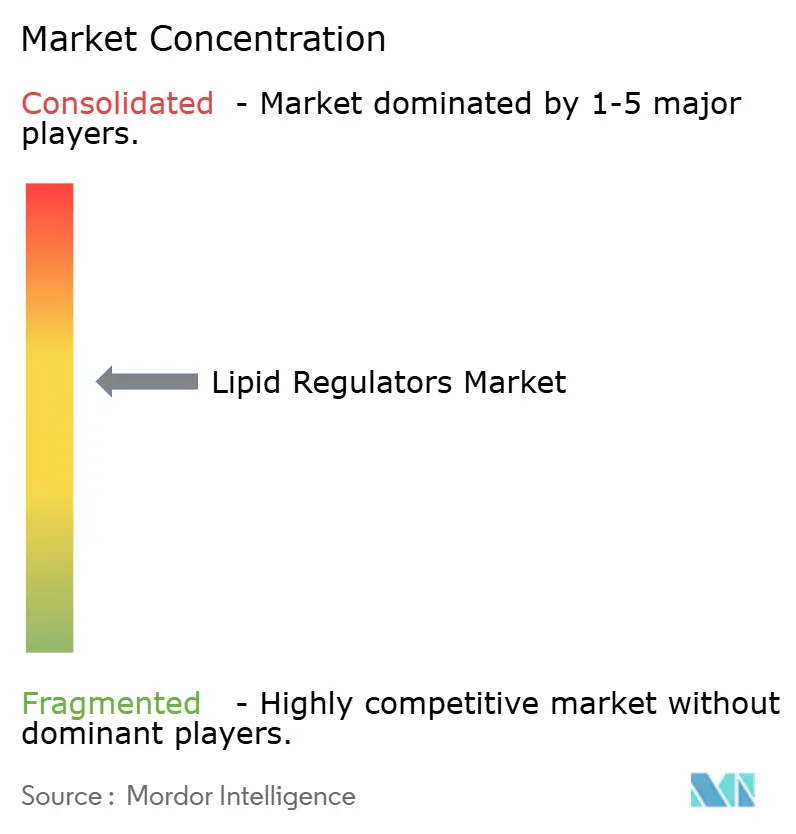
The lipid regulators market hosts a moderate concentration profile. Novartis leverages inclisiran’s twice-yearly dosing to protect its leading position, while Amgen rides evolocumab’s robust outcome data and expanding pediatric indication. AstraZeneca differentiates through the oral PCSK9 candidate AZD0780, aiming to capture injection-averse patients. Combined, these three companies controlled just under 35% of 2024 global revenue.
Strategic collaborations accelerate pipeline diversification. Novartis invested USD 60 million in Ionis to co-develop second-generation lipoprotein(a) siRNA therapies, complementing its RNA portfolio. AstraZeneca’s USD 100 million deal with CSPC Pharmaceutical for a novel Lp(a) disruptor reinforces its dyslipidemia franchise. Meanwhile, Eli Lilly’s acquisition of Verve Therapeutics positions the firm at the forefront of in-vivo base-editing for once-and-done LDL-lowering.
Challenger biotech firms, including NewAmsterdam Pharma and Esperion Therapeutics, exploit oral small-molecule platforms to undercut injectable competition on convenience. Incremental entrants cultivate niche indications such as homozygous familial hypercholesterolemia, using accelerated regulatory pathways to reach market quickly. As portfolios widen, cross-class combination regimens become a central competitive lever, raising the total addressable revenue per treated patient.
Lipid Regulators Industry Leaders
AstraZeneca
AbbVie Inc
Teva Pharmaceuticals
Pfizer, Inc.
AbbVie, Inc.
- *Disclaimer: Major Players sorted in no particular order
Lipid Regulators Market Companies Covered in this Report
- Abbvie
- Amgen
- AstraZeneca
- Bristol-Myers Squibb
- Merck
- Novartis
- Pfizer
- Sanofi
- Regeneron
- Teva Pharmaceutical Industries
- Daiichi Sankyo
- Esperion Therapeutics
- LIB Therapeutics
- Ionis Pharmaceuticals
- Alnylam Pharmaceuticals
- Novo Nordisk
- CSL Behring
- Viatris
- Dr. Reddy’s Laboratories
- Sun Pharmaceuticals Industries

Market Opportunities and Future Outlook
White space is most apparent among patients who do not reach contemporary lipid targets on statins alone, in severe hypertriglyceridemia where pancreatitis risk drives intervention, and in rare genetic dyslipidemias where earlier, protocolized treatment is gaining traction. The March 2026 ACC/AHA dyslipidemia guideline update, including the PREVENT-ASCVD risk calculator and explicit integration of non-statin therapies (ezetimibe, bempedoic acid, and PCSK9 inhibitors) for high-risk patients, creates a direct clinical trigger for broader step-up use of branded non-statin agents. It also supports structured combination pathways across cardiology and primary care.
Opportunity also centers on long-acting and novel-mechanism therapies that address adherence and residual risk. In 2026, FDA approval of Ionis TRYNGOLZA (olezarsen) for severe hypertriglyceridemia extends commercial focus beyond LDL-C into triglyceride reduction tied to acute pancreatitis risk, which expands adjacent treatment algorithms for hypertriglyceridemia (>= 500 mg/dL). China adds a concrete access route for advanced biologics: Everest Medicines reported China NMPA acceptance of the BLA for LEROCHOL (lerodalcibep) in June 2026, and China moved PCSK9 antibodies into reimbursement channels as recaticimab was included in the National Reimbursement Drug List after its 2025 approval, reinforcing the commercial viability of premium lipid-lowering therapies in a large-volume market. On the innovation front, Merck disclosed CORALreef AddOn results in March 2026 for investigational oral PCSK9 inhibitor enlicitide decanoate with superior LDL-C reductions versus existing oral non-statin therapies on top of statins, reflecting ongoing competition to combine biologic-like efficacy with oral convenience.
Recent Industry Developments in Lipid Regulators Market
- June 2026: Ionis Pharmaceuticals announced FDA approval of TRYNGOLZA (olezarsen) as an adjunct to diet for adults with severe hypertriglyceridemia (TG >= 500 mg/dL), targeting triglyceride reduction and lowering acute pancreatitis risk. The approval broadens the competitive set beyond LDL-C into triglyceride-focused care and validates RNA-targeted approaches in commercially meaningful dyslipidemia subpopulations.
- March 2025: AstraZeneca reported PURSUIT Phase IIb data showing its oral small-molecule PCSK9 inhibitor AZD0780 achieved statistically significant LDL-cholesterol reduction. The readout strengthens the case for oral PCSK9 inhibition as a convenience-led alternative to injectables and increases competitive pressure on established biologics and next-generation RNAi programs.
- October 2024: AstraZeneca entered an exclusive license agreement with CSPC Pharmaceutical Group to develop YS2302018, an oral lipoprotein(a) disruptor. The deal signals continued investment in mechanisms addressing residual cardiovascular risk beyond LDL-C and supports pipeline differentiation as outcomes-focused lipid management expands into genetically driven risk markers.


Lipid Regulators Market Report Scope and Research Methodology
Market Definition and Coverage
This market covers the value of prescription therapies used to manage abnormal blood lipid levels, including products used to lower LDL-C, triglycerides, and related lipid measures, across major geographies.
Scope exclusions: This sizing excludes OTC supplements and foods, lipid testing and diagnostics, and non-therapeutic wellness programs.
Segments Covered in This Report
- By Drug Class
- Statins
- Branded Statins
- Generic Statins
- Fixed-Dose Combinations
- PCSK9 Inhibitors
- mAbs (Alirocumab, Evolocumab)
- siRNA (Inclisiran)
- Oral Small-Molecule PCSK9i
- Cholesterol Absorption Inhibitors (Ezetimibe)
- Bempedoic-acid / ACLY Inhibitors
- Fibric-acid Derivatives
- Bile-acid Sequestrants
- Omega-3 Fatty Acid Derivatives
- Nicotinic-acid Derivatives
- Lipoprotein(a) Targeted Agents
- Statins
- By Patient Type
- Primary Hypercholesterolemia
- Heterozygous FH
- Homozygous FH
- Mixed Dyslipidemia
- Hypertriglyceridemia (≥500 mg/dL)
- ASCVD Secondary Prevention
- Diabetes / Obesity Preventive Care
- Primary Hypercholesterolemia
- By Route of Administration
- Oral
- Sub-cutaneous Injection
- Intravenous
- In-vivo Gene Therapy
- By Distribution Channel
- Hospital Pharmacies
- Retail Pharmacies
- Online Pharmacies
- Specialty Clinics
- Geography
- North America
- United States
- Canada
- Mexico
- Europe
- Germany
- United Kingdom
- France
- Italy
- Spain
- Rest of Europe
- Asia-Pacific
- China
- Japan
- India
- Australia
- South Korea
- Rest of Asia-Pacific
- Middle East & Africa
- GCC
- South Africa
- Rest of Middle East & Africa
- South America
- Brazil
- Argentina
- Rest of South America
- North America
Data Sources, Market Sizing, and Validation
Desk Research
Desk work started by building a clean view of the treated dyslipidemia population and therapy usage, before any forecasting work. We relied on public sources such as the World Health Organization, the US CDC, the OECD health statistics, national health agencies, and peer reviewed cardiology and endocrinology journals to understand prevalence, screening, and treatment rates.
After that, pricing and access assumptions were checked using sources such as US FDA and EMA labeling, national reimbursement and formulary documents, government health spending releases, and audited company filings and investor presentations. We also used paid database subscriptions for company financials and intelligence, and for patents, mainly to support launch timing checks and loss of exclusivity timelines when it affected average price paths. This list is illustrative only, and many other public sources were also used for data collection, validation, and clarification.
Primary Interviews and Surveys
Primary interviews focused on validating items that desk research could not explain well, especially real world class mix, therapy switching, and the way payer rules influence uptake. We spoke with a mix of clinical specialists, pharmacy and payer stakeholders, and commercial roles across APAC, EMEA, and the Americas so that regional pricing and access patterns could be compared and the model assumptions could be tightened.
We used these discussions to sanity check the demand pool build up, meaning eligible patients versus treated patients, and to confirm the likely speed of newer mechanisms reaching routine use compared with staying in niche lines of therapy.
Distribution of primary research fieldwork respondents
| Company type | Respondent position | Region |
|---|---|---|
| Top tier: 30% | CXOs: 15% | APAC: 46% |
| Mid tier: 54% | Functional/Unit leaders: 41% | EMEA: 31% |
| Smaller Players: 16% | Managers: 44% | Americas: 23% |
Market-Sizing & Forecasting
Sizing was built using a top-down approach, where epidemiology and treatment pathways were used to reconstruct the demand pool by major region, then converted into therapy volumes and value through class mix and pricing. Once that view was stable, we cross checked totals with selective bottom-up approximations, such as sampled country level volume proxies and supplier revenue splits, and then adjusted where the two views did not align.
Key inputs that shaped the model included dyslipidemia and familial hypercholesterolemia prevalence, screening and diagnosis rates, share of patients treated to guideline targets, class mix across statins and non-statins, typical therapy duration and adherence, and average selling price progression after loss of exclusivity. Forecasting was done using scenario analysis supported by a simple multivariate view, where the main drivers were access expansion, new therapy adoption speed, and expected price erosion patterns. Where the bottom-up checks had gaps, we filled them using conservative range assumptions, then revisited those ranges during expert follow ups.
Data Validation & Update Cycle
Model outputs were triangulated against independent signals such as prescription volume direction, public company revenue disclosures, and country level treatment uptake commentary from clinicians and payers. If an output moved too far from these external checks, the underlying assumptions were re-opened, and the drivers were tested one by one until the variance had a clear explanation.
Before sign-off, the work goes through a multi step analyst review that includes logic checks, unit consistency checks, and year over year anomaly scans by region and by class. The report is refreshed annually, and interim updates are made when material events occur, such as major approvals, safety label changes, or reimbursement shifts. Right before delivery, we do a final pass to confirm nothing important has changed in the most recent months.
Mordor Intelligence's Lipid Regulators Market Size Compared Against Other Published Estimates
Published market values for lipid regulators can look far apart because the counting rules are not the same, even when the topic name appears identical. The biggest drivers tend to be what is included under lipid regulators, how combination therapies are counted, and whether the number represents only prescription drug sales or also adjacent product categories.
The main gap comes from scope expansion into non-therapy lipid related product groupings, where Mordor Intelligence counts only prescription lipid regulating drug revenues and keeps non-drug lipid products and diagnostics out of the value total.
Benchmark comparison
| Source | Market Size | Gaps in Research Methodology |
|---|---|---|
| Mordor Intelligence | USD 34.94 B (2026) | |
| Global Consultancy A | USD 12.10 B (2024) | Uses a different market meaning by mixing therapy framing with lipid product categories and development phase splits, which compresses the drug sales pool and shifts the base year earlier. |
| Industry Publisher B | USD 26.10 B (2025) | Applies an aggressive growth path and a different class mix and price erosion assumption set, which can move totals depending on how patent cliff impact and premium therapy uptake are handled. |
Overall, the spread in the table is mostly explained by what gets counted as part of the market and by how price and class mix are projected forward. By keeping the demand pool tied to treated patients and then checking it against revenue and uptake signals, the estimate stays transparent and repeatable for planning.


Key Questions Answered in the Report
What is the forecast growth rate for the lipid regulators market between 2026 and 2031?
The lipid regulators market is expected to expand at a 3.96% CAGR, rising from USD 34.94 billion in 2026 to USD 42.43 billion by 2031.
Which drug class is growing fastest?
PCSK9 inhibitors represent the fastest-growing class with a projected 6.35% CAGR through 2031, reflecting stronger clinical evidence and emerging oral formulations.
Why are combination lipid-lowering therapies gaining traction?
Trials like TANDEM show larger LDL-cholesterol reductions and better adherence, prompting updated guidelines that favor early combination use in high-risk patients.
What role do digital tools play in lipid management?
Mobile adherence apps and remote monitoring programs have cut LDL-cholesterol by an average 24 mg/dL, supporting persistence and improving real-world outcomes.
Which region is expected to record the highest growth rate?
Asia-Pacific is projected to post a 5.21% CAGR as screening programs expand and insurance coverage widens, especially in China and India.
How concentrated is the competitive landscape?
The top five companies account for roughly 50% of global revenue, pointing to moderate concentration with opportunities for innovative biotech entrants.
Page last updated on:


 Your data is secure and never sold or shared.


