Insurance Brokerage Market Size and Share
Market Overview
| Study Period | 2020 - 2031 |
|---|---|
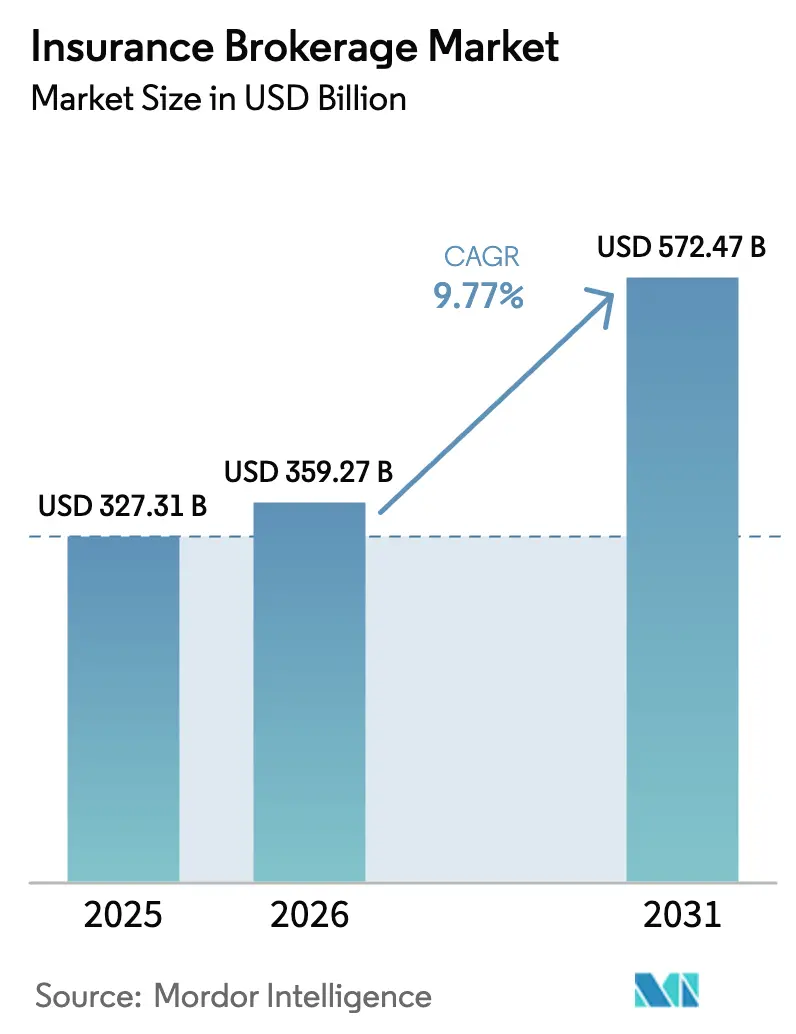
| Market Size (2026) | USD 359.27 Billion |
| Market Size (2031) | USD 572.47 Billion |
| Growth Rate (2026 - 2031) | 9.77% CAGR |
| Fastest Growing Market | Asia-Pacific |
| Largest Market | North America |
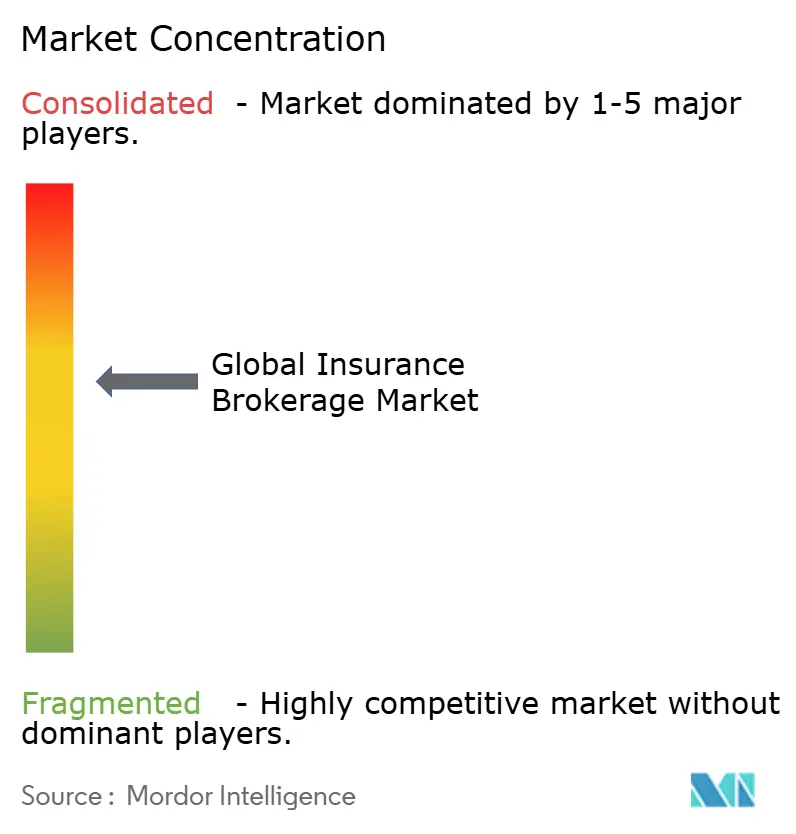
| Market Concentration | Medium |
Major Players *Disclaimer: Major Players sorted in no particular order Image © Mordor Intelligence. Reuse requires attribution under CC BY 4.0. | |
Insurance Brokerage Market Analysis by Mordor Intelligence
The Insurance Brokerage Market size was valued at USD 327.31 billion in 2025 and is estimated to grow from USD 359.27 billion in 2026 to reach USD 572.47 billion by 2031, at a CAGR of 9.77% during the forecast period (2026-2031).
Momentum in the insurance brokerage market reflects a clear tilt toward specialty risk expertise, digital workflow adoption, and program-based underwriting partnerships that widen fee pools for well-equipped intermediaries. Property and casualty remains the largest revenue pillar, while specialty lines led by cyber set the pace for growth as clients confront digital and climate risks with more complex transfer structures. Retail channels continue to hold the bulk of revenue, but wholesale and E&S placements gain relevance as carriers steer hard-to-place risks outside admitted markets. North America maintains scale leadership, while Asia Pacific shows the fastest growth profile, and regulatory scrutiny on compensation is prompting a shift toward fees and transparency in health and commercial placements. This combination points to an insurance brokerage market where specialization, data standards, and capital-light distribution models shape competitive outcomes through 2031.
Key Report Takeaways
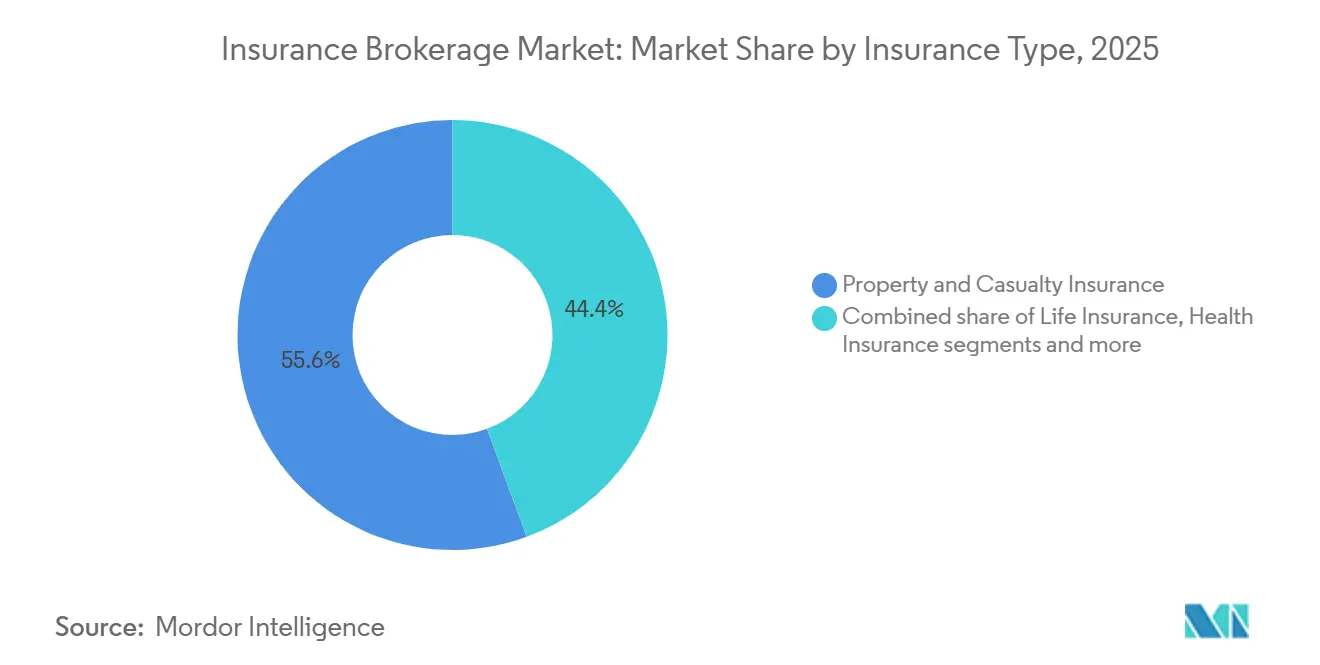
- By insurance type, property and casualty led with a 55.62% of the insurance brokerage market share in 2025, while specialty lines are forecast to expand at a 14.61% CAGR through 2031.
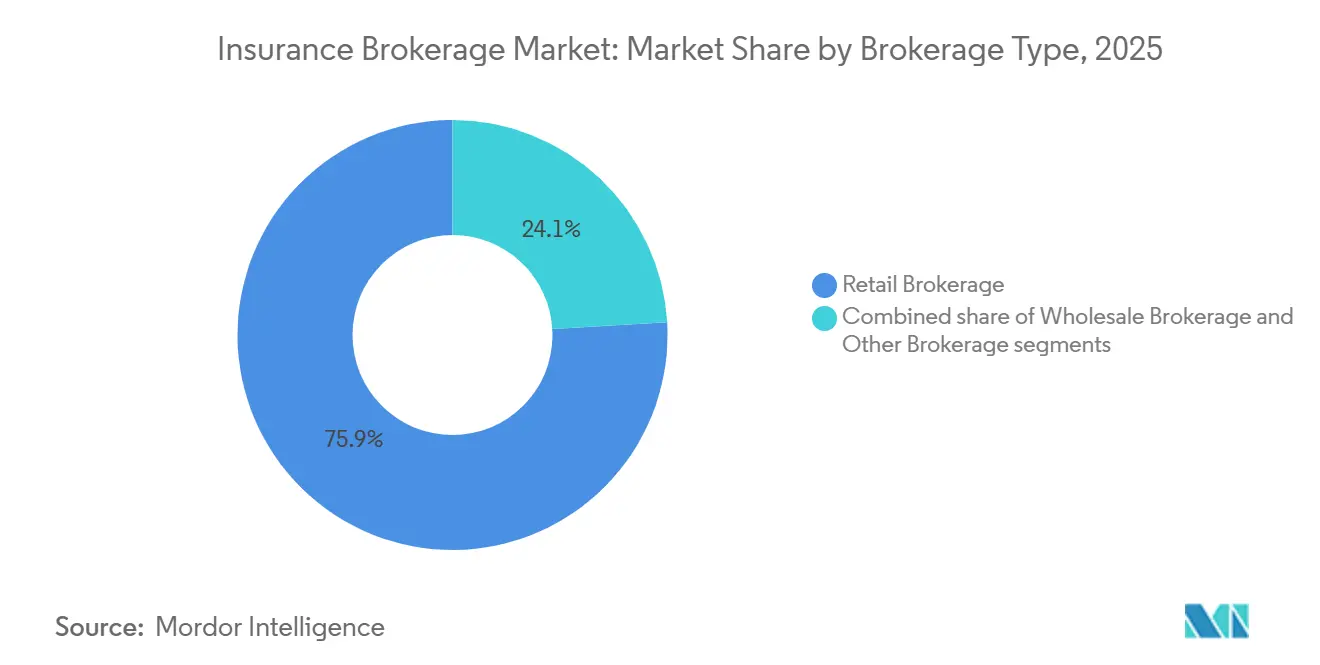
- By brokerage type, retail brokerage held 75.94% of the insurance brokerage market share in 2025, while wholesale brokerage is projected to grow at an 8.67% CAGR through 2031.
- By insurers, public-sector placements accounted for 54.18% of the insurance brokerage market share in 2025, while private-sector placements are expected to rise at a 9.31% CAGR through 2031.
- By geography, North America held 37.42% of the insurance brokerage market share in 2025, while the Asia Pacific is forecast to grow at a 16.12% CAGR over 2026–2031.
Note: Market size and forecast figures in this report are generated using Mordor Intelligence’s proprietary estimation framework, updated with the latest available data and insights as of 2026.
Global Insurance Brokerage Market Trends and Insights
Drivers Impact Analysis*
| Driver | (~) % Impact on CAGR Forecast | Geographic Relevance | Impact Timeline |
|---|---|---|---|
| E&S/wholesale channel expansion | +2.1% | North America, with spillover to the United Kingdom and Bermuda specialty markets | Medium term (2-4 years) |
| Cyber insurance penetration and exposure growth | +1.9% | Global, concentrated in North America and Europe, and emerging in the Asia-Pacific | Medium term (2-4 years) |
| Embedded insurance and platform partnerships | +1.3% | North America, advanced Asia-Pacific markets, Western Europe | Long term (≥ 4 years) |
| Broker consolidation and M&A scale advantages | +1.7% | Global, led by the United States and Canada, expanding in EMEA and Asia-Pacific | Medium term (2-4 years) |
| Broker-owned MGA and program facilities | +1.4% | United States E&S, United Kingdom Lloyd’s syndicates, global specialty lines | Medium term (2-4 years) |
| Data standards adoption for straight-through placement | +1.3% | London Market and the Ruschlikon community, gradual in North America and the Asia-Pacific | Long term (≥ 4 years) |
| Source: Mordor Intelligence | |||
E&S/Wholesale Channel Expansion Sustaining Brokered Premium Volumes
The E&S sector’s share of United States commercial P&C premiums now exceeds 12%, and wholesalers continue to process rising submissions even as certain rates temper, signaling a structural shift toward non-admitted capacity for complex or distressed risks.[1]IAT Insurance Group Editorial, “The Expanding Role of the E&S Market,” IAT Insurance Group, iatinsurancegroup.com. United States surplus lines premiums reached USD 46.2 billion in the first half of 2025, up 13.2% year over year. [2]R&I Editorial Team, “Surplus Lines Premiums Surge to $46.2 Billion in First Half of 2025,” Risk & Insurance, riskandinsurance.com. Retail brokers increasingly rely on wholesale partners to access E&S markets, build multi-layer programs, and place manuscript policies that admitted carriers are reluctant to underwrite. In this environment, wholesalers that combine underwriting authority, catastrophe analytics, and broad market access deliver differentiated outcomes for retail partners and end clients. Compliance and financial-strength due diligence have become core to broker value, given the speed of program launches and the need for transparent surplus lines tax and carrier evaluation at placement.
Cyber Insurance Penetration and Exposure Growth Expanding Advisory and Placement Fees
Cyber premiums continued to expand as carriers added capacity backed by reinsurance and capital markets, with gross written premiums rising from approximately USD 15.6 billion in 2025 to a projected USD 16.4 billion in 2026. Pre-breach assessments, incident-response planning, and detailed policy wording negotiation now drive meaningful advisory fee income for brokers serving mid-market and SME clients. Underwriting remains selective, with carriers tightening privacy-related exclusions and scrutinizing vendor management and contingent business interruption triggers as supply chain incidents proliferate. Pricing in 2026 is largely stable overall, while healthcare continues to see single-digit increases given recent claims trends. Regulatory expectations heighten the stakes, as SEC cybersecurity disclosure rules require timely reporting of material incidents, and European regimes such as DORA and the EU AI framework push for operational and model governance that shape underwriting requirements.
Broker Consolidation and M&A Creating Scaled Multi-Specialty Platforms and Cross-Sell Efficiencies
Industry dealmaking remained active in late 2025 and early 2026, and large transactions have reset competitive scale in retail, wholesale, and specialty distribution. Arthur J. Gallagher completed a USD 13.45 billion acquisition of AssuredPartners, expanding middle-market and specialty capabilities across the United States and enhancing United Kingdom and Ireland operations [3]. Brown & Brown agreed to acquire Accession Risk Management Group for USD 9.83 billion, significantly increasing wholesale and program breadth. Technology and data are front and center in scaled models, with AI-enabled tools for claims, placement analytics, and advisory workstreams supporting faster cycle times and better outcomes. A rebrand announced by Marsh McLennan consolidated capabilities under “Marsh” to simplify engagement across risk, reinsurance, people, and consulting, signaling a shift to integrated advisory at scale. Private-equity-backed buyers remain a major force in roll-ups and tuck-ins, sustaining a steady pipeline of acquisitions as independent agencies seek succession solutions and investment for technology and talent.
Data Standards Adoption (ACORD GRLC 2.0, Lloyd’s CDR) Enabling Straight-Through Placement and Analytics-Driven Broking
ACORD launched GRLC Generation 2.0 in April 2025 to create a unified, digital-first placement and claims processing standard across large commercial and reinsurance workflows. Early implementations have demonstrated material improvements, including sharp reductions in unallocated cash and manual effort, along with higher data quality in peer-to-peer markets. Lloyd’s CDR initiative extends standardized data into claims and settlement, aiming to tighten the linkage between underwriting data and downstream events. The London market has encouraged broad alignment to ACORD standards as part of its digital modernization, signaling the strategic importance of structured, interoperable data. Adoption beyond London remains uneven, with many MGAs still early in API enablement and digital operations, due in part to legacy platforms and integration costs. As DORA and other regulatory frameworks mature, data standardization is likely to move from efficiency enabler to compliance necessity for cross-border brokers and carriers.
Restraints Impact Analysis*
| Restraint | (~) % Impact on CAGR Forecast | Geographic Relevance | Impact Timeline |
|---|---|---|---|
| Commission transparency and remuneration scrutiny | -1.2% | United States, United Kingdom, EU | Medium term (2-4 years) |
| Direct and embedded channels in personal and small commercial | -0.9% | Global, acute in the United States, Western Europe, Japan, Australia | Long term (≥ 4 years) |
| API and data interoperability gaps | -0.7% | Global, fragmented in Asia-Pacific and Latin America | Medium term (2-4 years) |
| Softening in selecting P&C lines and facility rationalization | -0.8% | United States property, global reinsurance capacity hubs | Short term (≤ 2 years) |
| Source: Mordor Intelligence | |||
Commission Transparency and Remuneration Scrutiny is Compressing Margins
The Consolidated Appropriations Act of 2026 expands ERISA disclosure requirements for PBMs and TPAs, mandating detailed reporting of direct and indirect compensation, a move that is shaping expectations for broader transparency across intermediary roles. The United Kingdom’s FCA Consumer Duty has raised the bar on clarity and fairness, with explicit guidance on crafting understandable charging explanations and example-based communications. In practical terms, brokers face higher compliance costs, increased client scrutiny of contingent or volume-based arrangements, and rising preference for fee-based compensation in larger placements. Legal risk is also climbing as courts challenge undisclosed intermediary compensation, highlighting conflicts of interest in cases that can inform insurance distribution practices. Proposed DOL rules would disallow ERISA plans from contracting with non-compliant service providers, elevating documentation and audit needs ahead of the 2026 plan year applicability dates.
API and Data Interoperability Gaps Across Markets Slowing Straight-Through Placement
Legacy platforms and fragmented data flows still create material drag on quoting, binding, and servicing across many intermediaries and carriers. A large share of technology budgets is tied to maintenance of non-interoperable systems, with front-line agents spending significant time rekeying submissions due to carrier-specific formats and portals. ACORD GRLC 2.0 standards can reduce friction by enabling standardized, machine-readable placement and claims messages, but adoption remains uneven outside London and peer-to-peer communities. Regulatory mandates such as DORA are pushing firms to document processes and data flows with more rigor, which increases the incentive to invest in core upgrades and API fabrics. In the United States, open-data rules set deadlines for consumer-authorized data sharing, which will require enterprise-grade authentication and logging to meet compliance while enabling new distribution and service use cases.
*Our updated forecasts treat driver/restraint impacts as directional, not additive. The revised impact forecasts reflect baseline growth, mix effects, and variable interactions.
Segment Analysis
By Insurance Type: Specialty Lines Command Premium Growth as P&C Holds Volume
Property and casualty held 55.62% of 2025 brokered revenue, and specialty lines are projected to expand at a 14.61% CAGR through 2031, reflecting rising demand for focused expertise and limited-capacity markets that prize technical intermediation. The insurance brokerage market’s largest fee base still sits in P&C, where scale and placement volume matter, yet margins face pressure in property as rates moderated late in 2025 and early 2026. Coastal property and other catastrophe-exposed accounts continue to command advisory fees where brokers model scenarios, adjust retentions, and structure parametric triggers to stabilize outcomes for clients. Casualty pricing remains firm in early 2026, and litigation trends keep upward pressure on umbrella and auto liability, which sustains revenue stability for brokers with strong casualty portfolios.
Specialty lines led by cyber are a central growth engine as buyers formalize incident response and governance, and as reinsurers expand appetite with structured risk transfer. Brokers gain incremental fee opportunities from pre-breach assessments, tabletop exercises, and policy-wording negotiations that address evolving exclusions and vendor coverage. Cyber GWP increased from approximately USD 15.6 billion in 2025 to a projected USD 16.4 billion in 2026, a scale effect that supports broker-managed programs and panel-driven solutions. Reinsurance brokerage also benefits from market sophistication and the continued role of ILS in capacity provision, which helps intermediaries align capital sources with client needs. In health and employee benefits, medical trends and pharmacy dynamics increase the value of stop-loss advisory and plan design expertise, which supports fee income less correlated to premium cycles.
Note: Segment shares of all individual segments available upon report purchase
By Brokerage Type: Retail Dominates Volume, Wholesale Captures Specialty Growth
Retail held 75.94% of revenue in 2025, while wholesale is projected to grow at 8.67% CAGR through 2031, reflecting E&S-driven complexity and the shift of distressed or specialized risks out of admitted markets. The insurance brokerage market continues to rely on retail distribution for client origination and service, but retail brokers face pressure in simpler products from digital alternatives, which pushes many to specialize and add fee-based consulting. Middle-market accounts reward brokers that combine placement with safety programs, claims advocacy, and benchmarking, which strengthens retention and reduces price-only competition. Wholesale partners deliver access to dozens of E&S carriers and programs, plus knowledge of appetite and layering strategies that accelerate placement in tight timelines.
Wholesale momentum is quantifiable in the surplus lines market, where premiums reached USD 46.2 billion in H1 2025, a 13.2% year-over-year increase, led by commercial liability and property. This backdrop favors wholesalers that can structure multi-carrier towers, manage manuscript wordings, and achieve better economics through program authority. Other models, including program administration, captive management, and specialized TPAs, expand the insurance brokerage industry’s service footprint, adding fee income tied to loss performance and operational outcomes rather than premium swings. The outlook favors integrated retail and wholesale capabilities within the same platform or aligned through strategic partnerships to deliver both breadth and depth in specialty placements.
Note: Segment shares of all individual segments available upon report purchase
By Insurers: Public Sector Dominates Share, Private Sector Accelerates Growth
Public-sector placements held 54.18% of 2025 brokered revenue, while private-sector placements are on track to grow at 9.31% CAGR through 2031 as corporate buyers deploy captives, parametric solutions, and structured reinsurance to manage volatility. The insurance brokerage market share tilt toward public entities brings heightened transparency requirements and competitive bidding that pressure margins and favor itemized, fee-based proposals. The United Kingdom’s Consumer Duty and the United States' transparency initiatives are accelerating the shift to clearer remuneration reporting and value documentation across benefits and casualty programs. Private-sector demand concentrates in advisory around risk financing, including captive design, reinsurance placements, and aggregate protection to stabilize the total cost of risk.
Large corporates lead in sophistication by pairing retention with treaty reinsurance and catastrophe models, and brokers win mandates through analytics and execution across both admitted and alternative capital channels. Middle-market firms rely on brokers for bundled services that include coverage placement, loss control, and claims support, which creates durable relationships that withstand pricing cycles. Public-entity clients continue to emphasize cost certainty and documentation of services, which keeps competition high and rewards intermediaries that can balance transparency with risk-transfer innovation. Through 2031, brokers that segment service models for public and private buyers and link placement with advisory and analytics are positioned to expand share even as compliance demands rise.
Geography Analysis
North America accounted for 37.42% of 2025 revenue, while Asia Pacific is projected to grow at a 16.12% CAGR through 2031, setting the pace for regional expansion in the insurance brokerage market. The United States surplus lines market underscores the structural demand for specialty capacity, with H1 2025 premiums reaching USD 46.2 billion and growth concentrated in commercial liability and property. The United States' competitive field remains active in M&A with large transactions that expand retail, wholesale, and program capabilities, although property rate softening in late 2025 slowed organic revenue for some retail platforms. Canada follows similar trends in consolidation and digital transformation, with brokers leaning into commercial lines and specialty solutions to offset pressure in simpler personal lines.
Asia Pacific’s growth stems from rising insurance participation, digital distribution advances, and regulatory programs that formalize capital and solvency frameworks. Hong Kong’s adoption of a risk-based capital regime and cross-border demand strengthen savings and protection flows relevant to large intermediaries. Commercial pricing in several Asia-Pacific markets trended downward into early 2026, which increased the role for brokers to demonstrate value through coverage optimization, panel selection, and claims advocacy. India and parts of Southeast Asia show multi-line momentum, with health, motor, and micro solutions moving quickly into digital and affinity channels where brokers can partner on embedded and white-label offerings. In mature Asia-Pacific markets, brokers benefit from complex placements tied to construction, energy, and catastrophe exposures that favor specialized expertise.
Europe combines deep specialty expertise centered in London with national markets that face margin pressure from consolidation and digital competition. Lloyd’s continues to act as a global hub for marine, aviation, political risk, and cyber placements, supported by ongoing data standardization through CDR and alignment to ACORD. Intermediaries operating across the region are adapting to regulatory expectations on transparency and consumer outcomes, while leveraging structured data to improve placement and claims speed. In the Middle East and Africa, the GCC health segment shows double-digit growth off a sizable base and is expected to continue rising in 2026, which sustains a robust pipeline for intermediaries focused on employee benefits and cross-border coverage. Brokers that combine regional regulatory fluency with global reinsurance access are best placed to grow across MEA in the forecast period.

Competitive Landscape
The insurance brokerage market features global leaders with strong negotiating leverage and data investments alongside a long tail of specialized regional and vertical players. Large brokers continue to integrate risk and reinsurance advisory with data and AI tooling to differentiate on placement speed, analytics, and claims outcomes. Notable transactions in 2025 and 2026 reshaped capacity access and client service models, including Arthur J. Gallagher’s USD 13.45 billion acquisition of AssuredPartners and Brown & Brown’s USD 9.83 billion agreement to acquire Accession Risk Management Group. Technology-enabled wholesalers and program administrators are also growing their roles by pairing market access with delegated underwriting and product development.
Top platforms emphasize integrated operating models that create new cross-sell paths and simplify client engagement across risk, reinsurance, human capital, and investment services. Marsh’s rebrand to a unified name underscores that strategy and establishes a common identity for technology and analytics investments. Scaled players are formalizing AI use in claims appraisal and placement analytics to compress cycle times and elevate underwriting accuracy. At the same time, specialists carve out defensible positions by mastering niche exposures and providing advisory depth that generalists or direct channels struggle to match.
Regulatory pressure on remuneration disclosure and consumer outcomes pushes all competitors to codify value narratives around benchmarking, loss control, and total cost of risk. Embedded and direct distribution introduce price transparency and convenience in simpler lines, which increases the premium on advisory-led models in complex or commercial risks. Through 2031, leaders in the insurance brokerage market are expected to be those who invest in interoperable data standards, program capacity, and specialized talent while maintaining compliance discipline in evolving regulatory environments.
Insurance Brokerage Industry Leaders
Alliant Insurance Services
Aon plc
Arthur J. Gallagher & Co.
WTW
Marsh McLennan
- *Disclaimer: Major Players sorted in no particular order
Recent Industry Developments
- March 2026: Sompo International completed its acquisition of Aspen Insurance Holdings Limited, acquiring 100% of shares following an initial USD 3.5 billion agreement announced in August 2025. This deal strengthens Sompo's global specialty P&C platform and expands its reinsurance brokerage capabilities, enabling brokers working with Sompo to access enhanced capacity for catastrophe-exposed property risks and casualty programs requiring Lloyd's market participation.
- February 2026: Willis Towers Watson (WTW) released next-generation United States Library models within its RiskAgility Financial Modeler platform, fully incorporating Valuation Manual 22 (VM-22) requirements for non-variable annuity products. This development equips insurers and reinsurers with a production-ready platform to meet the new VM-22 reserving framework, enabling more accurate statutory valuations for fixed annuities, fixed indexed annuities, structured settlements, and pension risk transfer (PRT) liabilities using a market-aligned, principles-based approach.
- December 2025: Arthur J. Gallagher & Co. acquired First Actuarial, a United Kingdom-based firm providing pension administration, employee benefits, consultancy, and investment services to employers and pension plan trustees throughout the United Kingdom. This acquisition expands Gallagher's pension service capabilities in the United Kingdom and complements its existing employee benefits consulting operations. The First Actuarial team, led by David Joy, will continue operating from their current locations under David Piltz, head of Gallagher's United Kingdom Benefits and HR Consulting Division.
- November 2025: Alliant Insurance Services acquired Highpoint Insurance Group, a Friendswood, Texas-based multi-line insurance broker with 44 employees serving the Greater Houston middle market, with particular strength in oil and gas, construction, and surety. This acquisition expands Alliant's Texas presence and aligns with its organic growth strategy to serve commercial clients in high-value sectors. Highpoint's team will continue operations under the Alliant brand, integrating with Alliant's national resources and specialty capabilities.
Global Insurance Brokerage Market Report Scope
An insurance brokerage is a professional service acting as an independent intermediary, representing clients to research, compare, and negotiate insurance policies from multiple insurers. It provides expert advice, risk management services, and facilitates policy placement, earning compensation through commissions or fees.
The insurance brokerage market report is segmented by insurance type (life insurance, property & casualty insurance, health insurance, specialty lines including marine, aviation, and cyber, and reinsurance brokerage), brokerage type (retail brokerage, wholesale brokerage, other brokerage), insurers (private sector, public sector/non-profits), and geography (North America, South America, Europe, Asia Pacific, Middle East & Africa). The market forecasts are provided in terms of value (USD).
| Life Insurance |
| Property & Casualty Insurance |
| Health Insurance |
| Specialty Lines (Marine, Aviation, Cyber) |
| Reinsurance Brokerage |
| Retail Brokerage |
| Wholesale Brokerage |
| Other Brokerage |
| Private Sector |
| Public Sector / Non-Profits |
| North America | United States |
| Canada | |
| Mexico | |
| South America | Brazil |
| Peru | |
| Chile | |
| Argentina | |
| Rest of South America | |
| Europe | Germany |
| United Kingdom | |
| France | |
| Italy | |
| Spain | |
| BENELUX (Belgium, Netherlands, and Luxembourg) | |
| Nordics (Sweden, Norway, Denmark, Finland) | |
| Rest of Europe | |
| Asia Pacific | China |
| India | |
| Japan | |
| South Korea | |
| Australia | |
| South East Asia | |
| Indonesia | |
| Rest of Asia | |
| Middle East & Africa | United Arab Emirates |
| Saudi Arabia | |
| South Africa | |
| Nigeria | |
| Rest of Middle East |
| By Insurance Type | Life Insurance | |
| Property & Casualty Insurance | ||
| Health Insurance | ||
| Specialty Lines (Marine, Aviation, Cyber) | ||
| Reinsurance Brokerage | ||
| By Brokerage Type | Retail Brokerage | |
| Wholesale Brokerage | ||
| Other Brokerage | ||
| By Insurers | Private Sector | |
| Public Sector / Non-Profits | ||
| By Geography | North America | United States |
| Canada | ||
| Mexico | ||
| South America | Brazil | |
| Peru | ||
| Chile | ||
| Argentina | ||
| Rest of South America | ||
| Europe | Germany | |
| United Kingdom | ||
| France | ||
| Italy | ||
| Spain | ||
| BENELUX (Belgium, Netherlands, and Luxembourg) | ||
| Nordics (Sweden, Norway, Denmark, Finland) | ||
| Rest of Europe | ||
| Asia Pacific | China | |
| India | ||
| Japan | ||
| South Korea | ||
| Australia | ||
| South East Asia | ||
| Indonesia | ||
| Rest of Asia | ||
| Middle East & Africa | United Arab Emirates | |
| Saudi Arabia | ||
| South Africa | ||
| Nigeria | ||
| Rest of Middle East | ||
Key Questions Answered in the Report
What is the insurance brokerage market growth outlook for 2031?
The insurance brokerage market size is projected to reach USD 572.47 billion by 2031 at a 9.77% CAGR from 2026 to 2031.
Which insurance types will drive the most growth for brokers through 2031?
Specialty lines led by cyber are expected to grow at a 14.61% CAGR, outpacing property and casualty while adding advisory fee opportunities.
Which channels are expanding most within distribution?
Wholesale and E&S placements are accelerating, supported by H1 2025 United States surplus lines premiums of USD 46.2 billion and rising submission volumes.
What regions show the highest growth potential?
Asia Pacific has the fastest outlook with a 16.12% forecast CAGR, while North America remains the largest region by share.
How will transparency rules affect broker margins?
Expanded disclosure requirements in the United States and FCA Consumer Duty in the United Kingdom increase compliance costs and encourage fee-based models, which may compress margins without clear value documentation.
What technology standards matter most for placement efficiency?
ACORD GRLC 2.0 and Lloyd's CDR enable straight-through placement and claims, cutting unallocated cash and manual work for adopters.


