Specialty Insurance Market Size and Share
Market Overview
| Study Period | 2020 - 2031 |
|---|---|
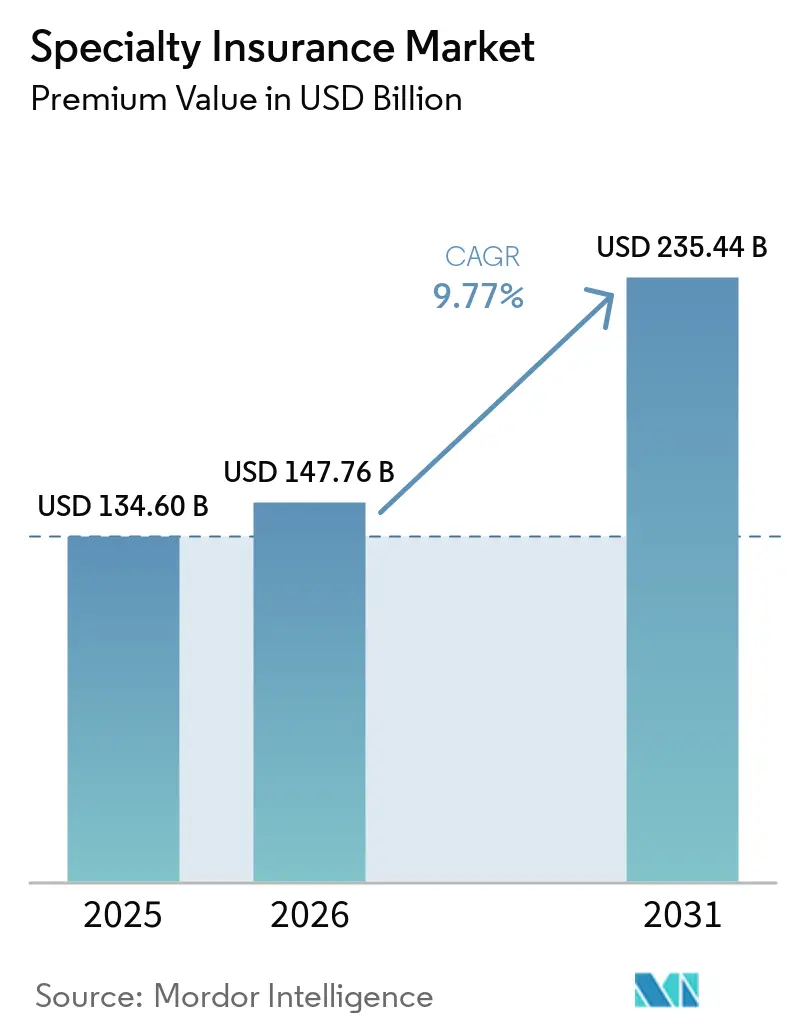
| Market Size (2026) | USD 147.76 Billion |
| Market Size (2031) | USD 235.44 Billion |
| Growth Rate (2026 - 2031) | 9.77% CAGR |
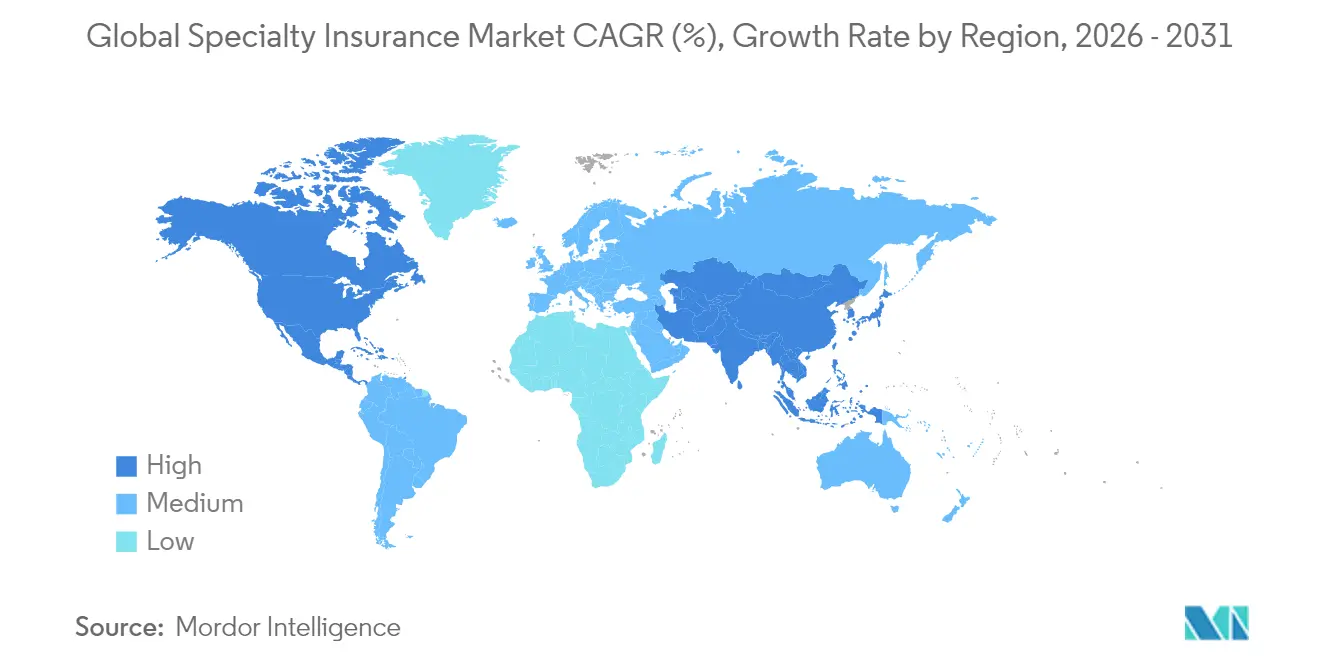
| Fastest Growing Market | Asia Pacific |
| Largest Market | Europe |
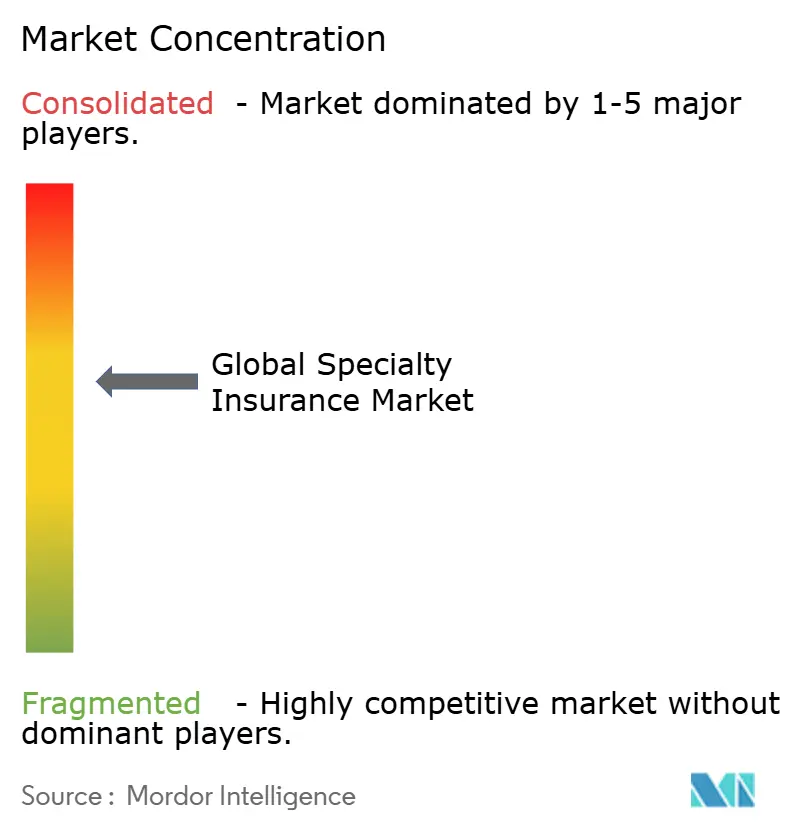
| Market Concentration | Medium |
Major Players *Disclaimer: Major Players sorted in no particular order Image © Mordor Intelligence. Reuse requires attribution under CC BY 4.0. | |
Specialty Insurance Market Analysis by Mordor Intelligence
The Specialty Insurance Market size in terms of premium value was valued at USD 134.60 billion in 2025 and is estimated to grow from USD 147.76 billion in 2026 to reach USD 235.44 billion by 2031, at a CAGR of 9.77% during the forecast period (2026-2031).
Deepening global trade links, intensifying natural catastrophe losses, and the arrival of unconventional risks such as low-Earth-orbit satellites and ESG-linked liabilities are refocusing corporate risk transfer on tailored covers that standard property-and-casualty policies cannot serve. Capital inflows from catastrophe bonds and other insurance-linked securities are supplementing traditional reinsurance, yet technical expertise in modeling complex exposures remains the true constraint on growth for the specialty insurance market. Embedded distribution is compressing purchase frictions by binding coverage at the moment a risk arises, while parametric structures are unlocking protection for secondary perils that defy conventional loss adjustment. The specialty insurance market, therefore, pivots on data analytics, real-time underwriting, and the capacity to bridge gaps that would otherwise hamper high-risk economic activity.
Key Report Takeaways
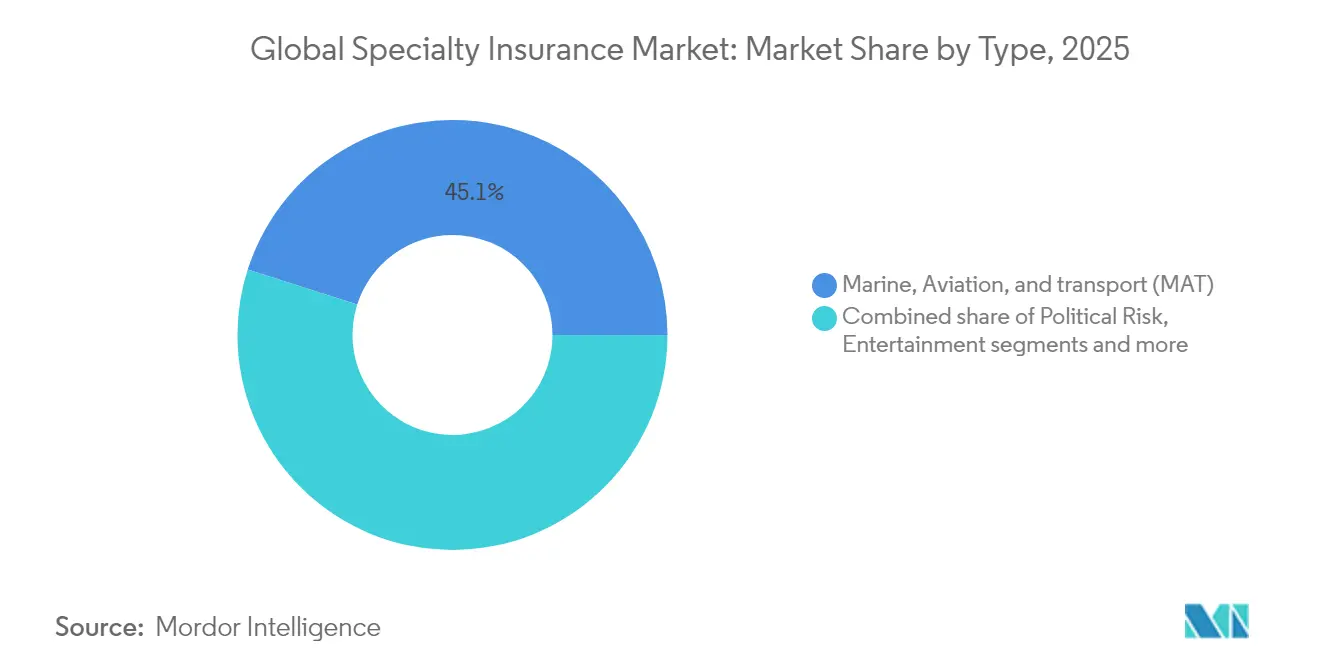
- By type, marine, aviation & transport captured 45.08% of the global specialty insurance market share in 2025, whereas entertainment & media are forecast to grow at a 10.25% CAGR through 2031.
- By end-user, large enterprises held 49.62% of 2025 premiums; small & medium enterprises are projected to post an 8.58% CAGR to 2031.
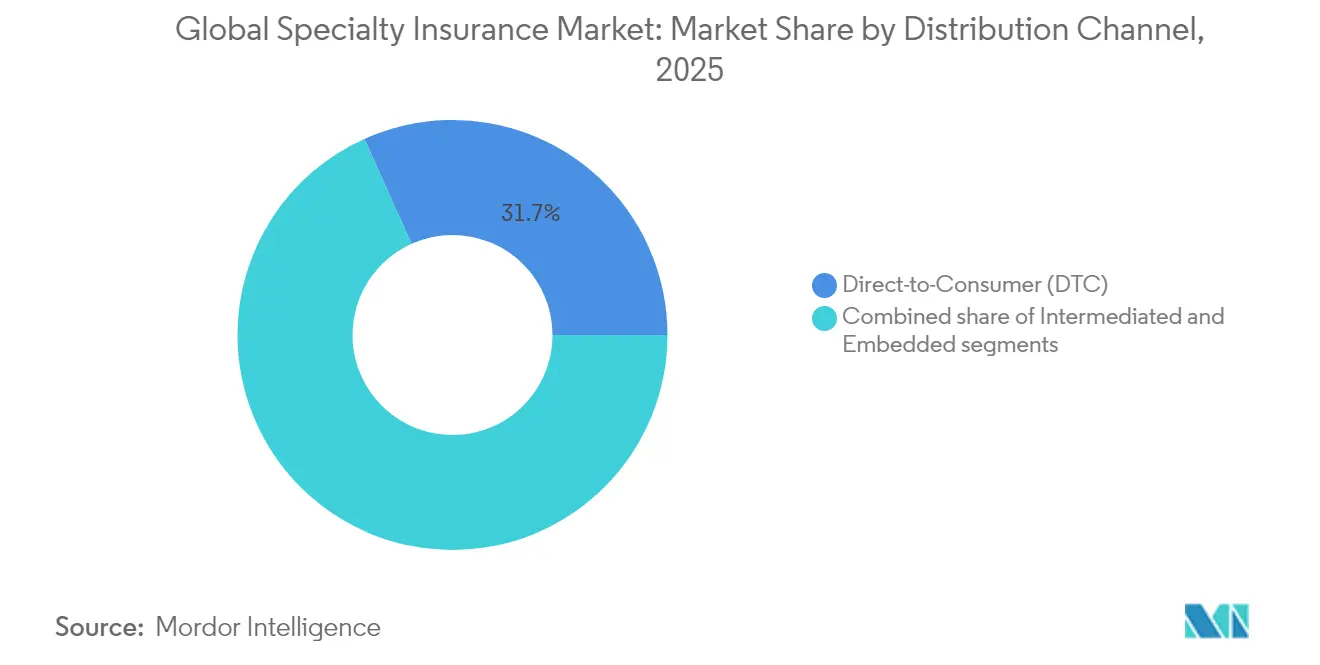
- By distribution, direct-to-consumer channels represented 31.72% of 2025 revenue, while embedded platforms are set to advance 7.9% annually out to 2031.
- By geography, the specialty insurance market in North America led with a 39.02% revenue share during 2025; Asia-Pacific is expanding at an 8.37% CAGR on infrastructure and manufacturing demand.
Note: Market size and forecast figures in this report are generated using Mordor Intelligence’s proprietary estimation framework, updated with the latest available data and insights as of 2026.
Global Specialty Insurance Market Trends and Insights
Drivers Impact Analysis*
| Driver | (~ ) % Impact on CAGR Forecast | Geographic Relevance | Impact Timeline |
|---|---|---|---|
| Rising global trade volumes | +2.1% | Global with Asia-Pacific corridors | Medium term (2–4 years) |
| Heightened natural-catastrophe exposure | +1.8% | North America & Europe primary | Long term (≥ 4 years) |
| High-net-worth demand for collectible covers | +1.3% | North America & Europe core | Medium term (2–4 years) |
| Embedded insurance platforms | +1.6% | Global, led by North America & Europe | Short term (≤ 2 years) |
| Low-Earth-orbit space-asset deployment | +0.9% | United States, Europe, China | Long term (≥ 4 years) |
| ESG-linked credit & political-risk clauses | +1.2% | Europe primary | Medium term (2–4 years) |
| Source: Mordor Intelligence | |||
Rising Global Trade Volumes
Container throughput climbed 6.6% year-on-year through August 2024, masking shifts toward larger vessels that concentrate insured values and complicate accumulation modeling[1]Swiss Re Institute, “Global Container Throughput Trends,” swissre.com. Tariffs on US imports raised declared cargo values by 20-30%, inflating premium bases for the specialty insurance market. Geopolitical route diversification lengthens transit times, increasing exposure windows and spurring demand for voyage extensions and contingent-business-interruption endorsements. Specialty underwriters leveraging vessel-tracking analytics now price accumulation scenarios more accurately than standard marine policies, enabling higher retentions without eroding capacity. Shippers using just-in-time inventory discover that even brief delays trigger material balance-sheet hits, further lifting the uptake of bespoke marine covers.
Heightened Natural-Catastrophe Exposure
In 2024, insured catastrophe losses approached USD 130 billion, with a mere 14% reinsured, amplifying volatility for primary insurers[2]Guy Carpenter, “Reinsurer Capital Review 2025,” guycarp.com. This low reinsurance penetration highlights a growing risk burden on primary carriers, making them more susceptible to financial instability during extreme weather events. Over 60% of these losses stemmed from secondary perils, a consequence of urban expansion encroaching on previously safe zones. The shift of asset bases into areas historically considered low-risk has significantly increased exposure to natural disasters. In 2024, parametric submissions skyrocketed by 500%, underscoring the appeal of swift, index-based settlements for businesses grappling with climate-induced recovery expenses. These solutions offer faster payouts and greater predictability, making them an attractive option for companies seeking to mitigate financial disruptions. Investments in climate adaptation are giving rise to performance-based liabilities tied to green infrastructure. This trend is steering the specialty insurance market towards hybrid policies that merge property and environmental considerations, addressing the evolving risk landscape. Insurers honing in on micro-climate models are now at the forefront, enjoying both pricing power and robust margins. By leveraging advanced modeling techniques, these carriers can better assess localized risks, enabling more accurate underwriting and competitive differentiation.
High-Net-Worth Demand for Collectible Covers
As the US witnesses a monumental USD 90 trillion wealth transfer, the landscape of art and jewelry insurance is evolving. Younger heirs are now prioritizing protection for digital art, NFTs, and alternative assets, reflecting a shift in asset preferences and risk management strategies. Projections indicate that by 2030, high-net-worth portfolios in the Asia-Pacific region could amass USD 4.4 trillion, creating burgeoning demand for fine-art floaters, private aviation hull covers, and other niche insurance products tailored to the needs of affluent individuals. While heightened anti-money-laundering scrutiny is driving up underwriting costs, the adoption of blockchain for provenance verification is not only expediting approval times but also bolstering compliance by ensuring transparency and authenticity in asset transactions. The rise of fractional ownership platforms introduces complexities in loss settlements, as multiple stakeholders are involved. However, specialty carriers that craft policies around proportionate ownership are winning the trust of collectors who value agility, transparency, and innovative solutions to address emerging challenges in the specialty insurance market.
Embedded Insurance Platforms
In 2024, 31.6% of industry executives identified embedded distribution as the primary growth driver, highlighting its transformative potential in reshaping insurance delivery models[3]Insurance Business, “Munich Re to Acquire Next Insurance,” insurancebusinessmag.com. By 2030, embedded premiums are projected to hit USD 70 billion in the US and a staggering USD 700 billion globally, driven by the integration of insurance products into non-insurance platforms. Complex covers, like equipment breakdowns and project-specific liabilities, are set to lead this growth as they cater to niche demands and evolving customer needs. Data collected at the point of sale enhances underwriting precision and reduces acquisition costs, further bolstering the digital shift in the specialty insurance market. To counter adverse selection, top carriers enforce rule-based safeguards on their automatic-issue platforms, striking a balance between real-time ease and meticulous risk assessment, ensuring sustainable growth in this evolving landscape.
Restraints Impact Analysis*
| Restraint | (~) % Impact on CAGR Forecast | Geographic Relevance | Impact Timeline |
|---|---|---|---|
| Sparse loss-history data | –1.4% | Global, acute in emerging risks | Long term (≥ 4 years) |
| Reinsurance capacity tightening | –1.1% | North America & Europe | Medium term (2–4 years) |
| Parametric/ILS premium displacement | –0.8% | North America primary | Short term (≤ 2 years) |
| AML/KYC compliance in art & jewelry lines | –0.6% | Europe & North America | Medium term (2–4 years) |
| Source: Mordor Intelligence | |||
Sparse Loss-History Data
Under a decade's watch, cyber and space classes have grappled with notable losses, challenging traditional actuarial methods, and creating uncertainty in risk assessment. The 2023 space sector faced a loss of USD 438 million, a figure that proves to be of limited predictive utility due to the lack of historical data. Over five years, cyber ransomware incidents skyrocketed by 1,281%, throwing frequency-severity models into disarray and complicating efforts to establish reliable pricing frameworks. In emerging markets, a dearth of claims reporting compromises data integrity, leading to heightened capital charges and a subdued appetite for underwriting. This lack of robust data further exacerbates challenges in accurately assessing risks and pricing policies. As a result, the specialty insurance market is increasingly turning to scenario modeling and external benchmarks to fill these gaps, a shift that's amplifying pricing volatility for those insured and adding complexity to market dynamics.
Reinsurance Capacity Tightening
In 2025, global reinsurer capital reached USD 607 billion. However, property-cat and financial-risk lines experienced significant contractions of 50-60%, reflecting the challenges faced by the reinsurance industry. Since 2018, political violence rates have surged by 80%, driven by substantial losses of USD 10 billion in SRCC (strikes, riots, and civil commotion). This increase highlights the growing risks in the global insurance landscape, particularly in regions prone to political instability. As fewer counterparties are willing to take on peak perils, primary carriers are either increasing retentions or reducing limits to manage their risk exposure. This shift is placing constraints on the specialty insurance market's capacity to absorb and manage the expanding exposures effectively, potentially leading to gaps in coverage for high-risk areas.
*Our forecasts treat driver/restraint impacts as directional, not additive. The impact forecasts reflect baseline growth, mix effects, and variable interactions.
Segment Analysis
By Type: MAT Lines Drive Complexity Premium
Marine, Aviation, & Transport policies generated 45.08% of 2025 premiums, underlining their anchor role in the specialty insurance market. Vessel upsizing and supply-chain rerouting expand insured values and transit durations, sustaining rate firmness into 2025. Entertainment & Media is projected to grow 10.25% annually to 2031 as streaming giants bankroll global shoots and cyber extortion targets post-production houses. Political-Risk & Credit cover sees bidirectional pressures: elevated default potential raises demand, yet reinsurance scarcity restrains capacity. Art & Collectibles growth slows under AML compliance, though digital-art tokenization opens new frontiers for valuation and claims verification. Livestock & Aquaculture leverages index-based drought triggers that improve claim transparency for farmers. Emergent classes such as space, carbon offset, and parametric ranks sit within “Others,” currently modest but strategically critical for the future expansion of the specialty insurance market.
Underwriting advances tailored to specific lines highlight the delicate balance between complexity and profitability. Insurers in the marine and transportation (MAT) sector are now incorporating satellite AIS and port-congestion data into their accumulation dashboards, allowing them to safeguard their profit margins even when facing larger exposures. Meanwhile, underwriters in entertainment and media (E&M) are harnessing AI technology to meticulously analyze scripts and shooting schedules, pinpointing potential liability markers. In the realm of collectibles, insurers are leveraging blockchain registries to authenticate provenance. Livestock insurers, on the other hand, are combining remote sensing data with commodity-price indices to fine-tune their payout calibrations. This escalating competition in data analytics strengthens barriers to market entry and solidifies the leadership position for carriers adept in data science.


By End-User: SME Segment Accelerates Digital Adoption
Large enterprises controlled 49.62% of global premiums in 2025, seeking tower structures blending property, liability, and parametric triggers that align with captive retentions. They increasingly request ESG-aligned warranties and coverage for uninsurable transition costs, prompting multi-line manuscript wording that only deep-bench specialty teams can craft. The specialty insurance market size for SMEs, however, is expected to climb at an 8.58% CAGR as bind-online portals demolish legacy onboarding obstacles. Embedded offers within accounting software or e-commerce checkouts empower merchants to roll premiums into operational budgets without disrupting cash flow.
High-net-worth individuals are increasingly seeking high-limit personal article floaters, private aircraft hull covers, and umbrella liability insurance exceeding USD 50 million. This trend is closely linked to rising asset values, the accumulation of luxury assets, and the global lifestyles of these individuals, which demand comprehensive and tailored insurance solutions. Additionally, outcome-based insurance is making inroads into the SME and HNW sectors. This type of insurance ties payouts to specific metrics, such as revenue or operational uptime, offering a more customized approach to risk management. Carriers that can securely monitor and interpret client performance data for precise underwriting are reaping the benefits, creating new revenue streams, and enhancing their competitive positioning in the market.
By Distribution Channel: Embedded Platforms Reshape Access
Direct-to-consumer (D2C) channels secured 31.72% of global insurance premiums in 2025 by leveraging aggregator websites, targeted digital campaigns, and affinity group partnerships. These routes appeal to digitally native customers who prioritize transparency, speed, and convenience in the quote-to-bind process. However, while D2C growth remains healthy, it faces increasing competition from embedded insurance models, which are tightly integrated into digital ecosystems. Partnerships with equipment lessors, SaaS platforms, and logistics networks enable insurance offerings to be seamlessly included at the point of sale, delivering frictionless coverage aligned with actual usage patterns.
These embedded platforms are expected to outpace D2C growth, advancing at a 7.9% CAGR through 2031, largely due to their ability to transmit granular first-party data such as operational metrics, usage intensity, and geolocation directly to insurers. This flow of real-time information allows underwriters to close long-standing data gaps, particularly in specialty lines where loss experience is sparse or difficult to model. Meanwhile, traditional brokers remain crucial in structuring complex placements that require layered limits, bespoke policy wording, or intensive post-bind servicing. As commission margins compress, brokers are increasingly shifting toward fee-based advisory roles. To support omnichannel distribution, insurers are adopting API-enabled quote-bind systems that unify pricing logic across D2C, embedded, and broker-driven paths, helping to maintain consistency and compliance throughout the market.
Geography Analysis
North America retained leadership with 39.02% of 2025 premiums. Rate adequacy persists in cyber, political-violence, and catastrophe layers, while US excess-and-surplus lines grew to 34% of commercial business, generating over USD 115 billion in 2023 premiums. Regulatory stability, developed loss-data pools, and abundant ILS capacity anchor this growth. Canada and Mexico supply incremental demand through resource projects and near-shore manufacturing, calling for environmental impairment and trade-credit covers.
Asia-Pacific is the fastest-expanding region in the specialty insurance market, with an 8.37% CAGR forecast through 2031. Supply-chain diversification, Belt-and-Road infrastructure, and buoyant e-commerce volumes escalate the demand for marine cargo, logistics liability, and political-risk solutions. Regulators in China, India, and Southeast Asia progressively relax foreign reinsurer participation, widening product menus and competitive choices in the specialty insurance market. Advanced analytics on regional flood and typhoon patterns allow early movers to scale profitably without over-pricing.
Europe grows at a steadier cadence but dominates ESG-linked innovation. The EU’s stringent sustainability framework fuels demand for coverage that guarantees green-bond proceeds and shields directors from transition-risk lawsuits. Brexit has elevated back-office costs by forcing dual licensing arrangements, yet London remains the global specialty hub due to historical broking infrastructure and syndicated capacity at Lloyd’s. Southern Europe sees uptake in parametric drought bonds for agriculture, while Scandinavia pilots carbon credit invalidation covers.
South America and the Middle East & Africa trail in premium volume but offer long-term upside in the specialty insurance market. Commodity extraction, renewable-energy rollouts, and infrastructural megaprojects intensify the demand for construction all-risk, political-risk, and environmental liability lines. Sparse loss data, volatile currencies, and patchy legal frameworks temper near-term growth, but fronting partnerships enable global players to establish brand presence and refine local models ahead of larger deployments.

Competitive Landscape
In the global specialty insurance market, a moderate concentration is evident. Major players like AIG, Chubb, AXA SA, Berkshire Hathaway Specialty, and Allianz leverage their diversified risk pools, extensive broker networks, and multi-currency capital bases to maintain their foothold. These global multi-line insurers capitalize on their scale and resources to defend their market positions effectively. Meanwhile, niche-focused syndicates such as Beazley and Hiscox target specialized areas like cyber, healthcare, and fine art. By employing their technical expertise, these syndicates achieve sub-90% combined ratios, ensuring profitability in their chosen segments. Munich Re's acquisition of Next Insurance for USD 2.6 billion not only secures a digital foothold in the SME sector but also integrates an AI-driven underwriting engine into its operations. Additionally, Samsung Fire & Marine's increased stake in Canopus highlights the growing interest from Asian players in scaling Lloyd's capacity and expanding their global presence. These developments underscore the dynamic nature of the specialty insurance market, where both established players and emerging entrants are vying for strategic advantages.
Technology integration has become a critical factor in gaining a competitive edge within the specialty insurance market. Industry leaders are increasingly utilizing data from IoT devices, satellites, and ESG sources to refine their rating metrics. This advanced data integration enables insurers to underwrite thin-data classes without compromising their capital solvency. At the same time, alternative capital continues to exert pricing pressure, with cat-bond investors stepping into parametric layers that traditional reinsurers often avoid. Despite this, specialist carriers remain in demand, particularly for managing active claims in areas such as cyber incidents and political violence. These players' ability to address complex risks ensures their relevance in a competitive landscape. Furthermore, the adoption of AI and machine learning tools is enhancing underwriting precision and claims management, allowing insurers to better navigate the challenges posed by evolving risks and regulatory requirements.
White-space opportunities persist in emerging areas such as space liability, carbon credit insurance, and climate transition guarantees. These segments require a combination of financial strength and scientific expertise, presenting challenges and opportunities for insurers willing to innovate. As the market evolves, insurers that can balance technical proficiency with financial stability are well-positioned to capture growth in these untapped areas. The ongoing integration of technology and data-driven insights will likely play a pivotal role in addressing these specialized needs, further shaping the future of the specialty insurance market. Additionally, the increasing focus on sustainability and climate-related risks is expected to drive demand for innovative insurance solutions, creating new avenues for growth. Insurers that proactively invest in research and partnerships to address these emerging risks will likely gain a competitive advantage in the forecast period.
Specialty Insurance Industry Leaders
American International Group (AIG)
AXA SA
Allianz SE
Chubb Ltd
Berkshire Hathaway Specialty
- *Disclaimer: Major Players sorted in no particular order

Recent Industry Developments
- June 2025: Munich Re Specialty launched life-science liability policies for pharma and med-tech firms, expanding at a 10% CAGR.
- April 2025: Zurich invested USD 194 million for a significant minority stake in Icen Risk, targeting M&A insurance growth in North America and Europe.
- March 2025: Munich Re completed the USD 2.6 billion purchase of Next Insurance to accelerate digital SME penetration in the specialty insurance market.
- May 2024: Travelers bought Corvus Insurance for USD 435 million, gaining cyber-risk analytics and AI underwriting algorithms


Global Specialty Insurance Market Report Scope
The specialty insurance market, a dynamic segment of the broader insurance industry, addresses unique and atypical risks often overlooked by standard policies. As risks grow increasingly complex, both businesses and individuals are turning to this market for customized coverage solutions. The Specialty Insurance Market is segmented into Type, End-User, Distribution channel, and Geography. By Type, the market is segmented into Marine, Aviation, and transport (MAT), Political Risk and Credit Insurance, Entertainment Insurance, Art Insurance, Livestock and aquaculture Insurance, and Others. By End-User, the market is segmented into Businesses and Individuals. By Distribution channel, the market is segmented into Brokers and Non-Brokers, and by Geography, the market is segmented into North America, Europe, Asia-Pacific, South America, and Middle East & Africa). The Report Offers the Market Size in Value Terms in USD for all the Above-Mentioned Segments.
| Marine, Aviation, and transport (MAT) |
| Political Risk and Credit Insurance |
| Entertainment & Media Insurance |
| Art & Collectibles Insurance |
| Livestock & Aquaculture Insurance |
| Others |
| Large Enterprises |
| Small & Medium Enterprises (SMEs) |
| High-Net-Worth Individuals |
| Direct-to-Consumer (DTC) |
| Intermediated |
| Embedded |
| North America | United States |
| Canada | |
| Mexico | |
| South America | Brazil |
| Peru | |
| Chile | |
| Argentina | |
| Rest of South America | |
| Europe | Germany |
| United Kingdom | |
| France | |
| Italy | |
| Spain | |
| BENELUX (Belgium, Netherlands, and Luxembourg) | |
| Nordics (Sweden, Norway, Denmark, Finland) | |
| Rest of Europe | |
| Asia-Pacific | China |
| India | |
| Japan | |
| South Korea | |
| Australia | |
| South East Asia | |
| Indonesia | |
| Rest of Asia |
| By Type | Marine, Aviation, and transport (MAT) | |
| Political Risk and Credit Insurance | ||
| Entertainment & Media Insurance | ||
| Art & Collectibles Insurance | ||
| Livestock & Aquaculture Insurance | ||
| Others | ||
| By End-User | Large Enterprises | |
| Small & Medium Enterprises (SMEs) | ||
| High-Net-Worth Individuals | ||
| By Distribution Channel | Direct-to-Consumer (DTC) | |
| Intermediated | ||
| Embedded | ||
| By Geography | North America | United States |
| Canada | ||
| Mexico | ||
| South America | Brazil | |
| Peru | ||
| Chile | ||
| Argentina | ||
| Rest of South America | ||
| Europe | Germany | |
| United Kingdom | ||
| France | ||
| Italy | ||
| Spain | ||
| BENELUX (Belgium, Netherlands, and Luxembourg) | ||
| Nordics (Sweden, Norway, Denmark, Finland) | ||
| Rest of Europe | ||
| Asia-Pacific | China | |
| India | ||
| Japan | ||
| South Korea | ||
| Australia | ||
| South East Asia | ||
| Indonesia | ||
| Rest of Asia | ||


Key Questions Answered in the Report
What is the forecast size of the specialty insurance market?
The specialty insurance market size is projected to reach USD 235.44 billion by 2031, rising from USD 147.76 billion in 2026 at a 9.77% CAGR.
Which product line currently dominates?
Marine, Aviation & Transport holds the largest share at 45.08% of 2025 premiums within the specialty insurance market.
Why are embedded platforms important?
Embedded distribution integrates coverage at the point of sale, enabling real-time underwriting, and is expected to grow 7.9% per year, the fastest among channels.
Which region will grow fastest through 2031?
Asia-Pacific leads with an 8.37% CAGR due to infrastructure investment and manufacturing expansion that elevate demand for special-risk covers.
How does reinsurance capacity affect pricing?
Although global reinsurer capital rose to USD 607 billion in 2025, capacity remains tight in peak property-cat and financial-risk lines, supporting firm primary rates and selective underwriting.
Page last updated on:


