United States Insurance Brokerage Market Size and Share
Market Overview
| Study Period | 2020 - 2031 |
|---|---|
| Forecast Data Period | 2026 - 2031 |
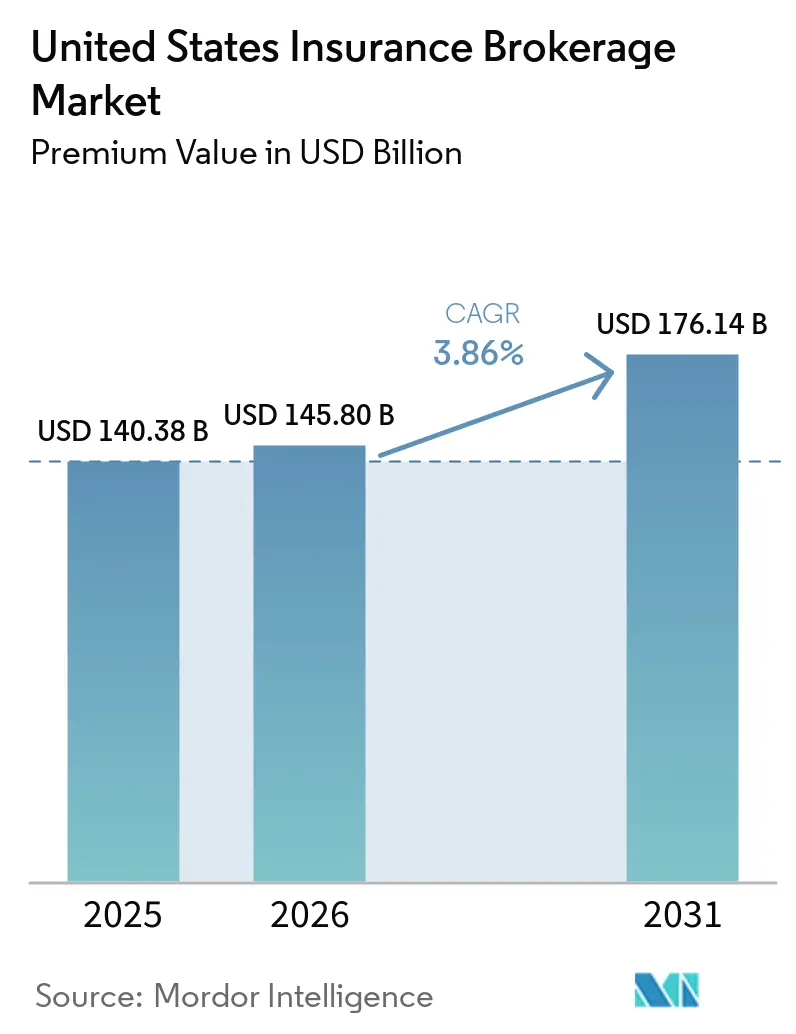
| Base Year Market Size (2025) | USD 140.38 Billion |
| Market Size (2026) | USD 145.80 Billion |
| Market Size (2031) | USD 176.14 Billion |
| Growth Rate (2026 - 2031) | 3.86% CAGR |
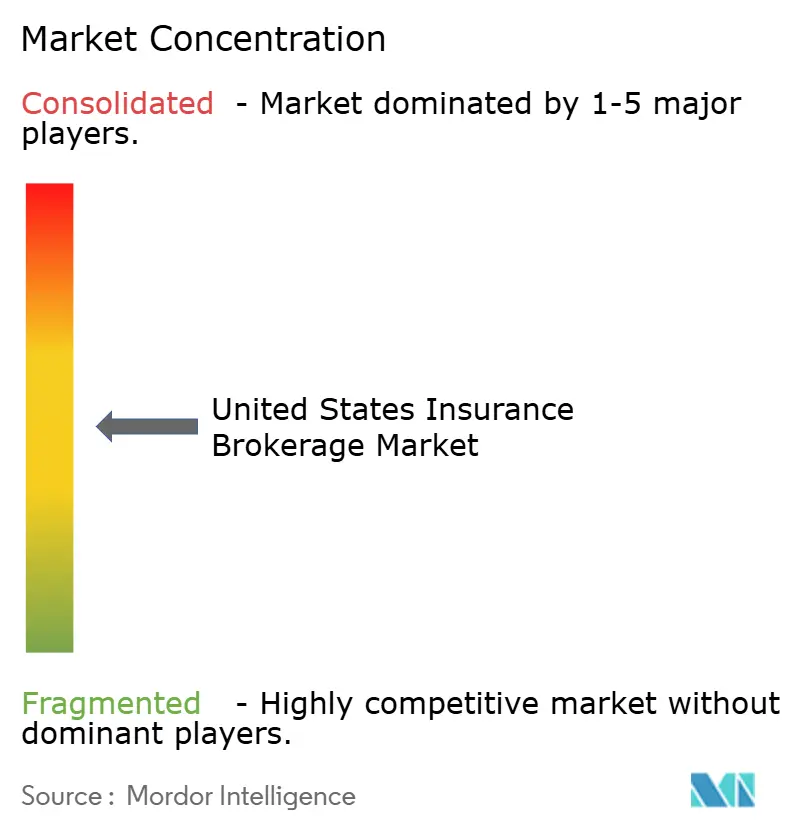
| Market Concentration | Medium |
Major Players *Disclaimer: Major Players sorted in no particular order Image © Mordor Intelligence. Reuse requires attribution under CC BY 4.0. | |
United States Insurance Brokerage Market Analysis by Mordor Intelligence
The United States Insurance Brokerage Market size in terms of premium value is projected to expand from USD 140.38 billion in 2025 and USD 145.80 billion in 2026 to USD 176.14 billion by 2031, registering a CAGR of 3.86% between 2026 to 2031.
Healthy expansion reflects persistent demand for risk-transfer advice even as technology, regulation, and customer preferences evolve. Data-driven pricing tools, cyber-risk exposures, and property-catastrophe rate hardening each lift commission revenue for brokers able to marshal specialized talent and analytics capacity. Simultaneously, fiduciary disclosure rules and embedded-insurance models force margin re-engineering that rewards scale and diversified product portfolios. Competition intensifies as the top five players already control 52% of revenue, yet the industry remains sufficiently fragmented to support further roll-ups. Embedded platforms, climate-risk covers, and advisory-led fee income create long-run opportunities that offset short-term pressure from direct-to-consumer carriers and rising producer costs.
Key Report Takeaways
- By brokerage type, retail brokerage led with 60.55% of the United States insurance brokerage market share in 2025, whereas reinsurance brokerage is projected to record the fastest 5.02% CAGR to 2031.
- By client type, small and medium-sized enterprises accounted for 42.35% of the United States insurance brokerage market size in 2025, while individual clients are poised to expand at a 6.7% CAGR through 2031.
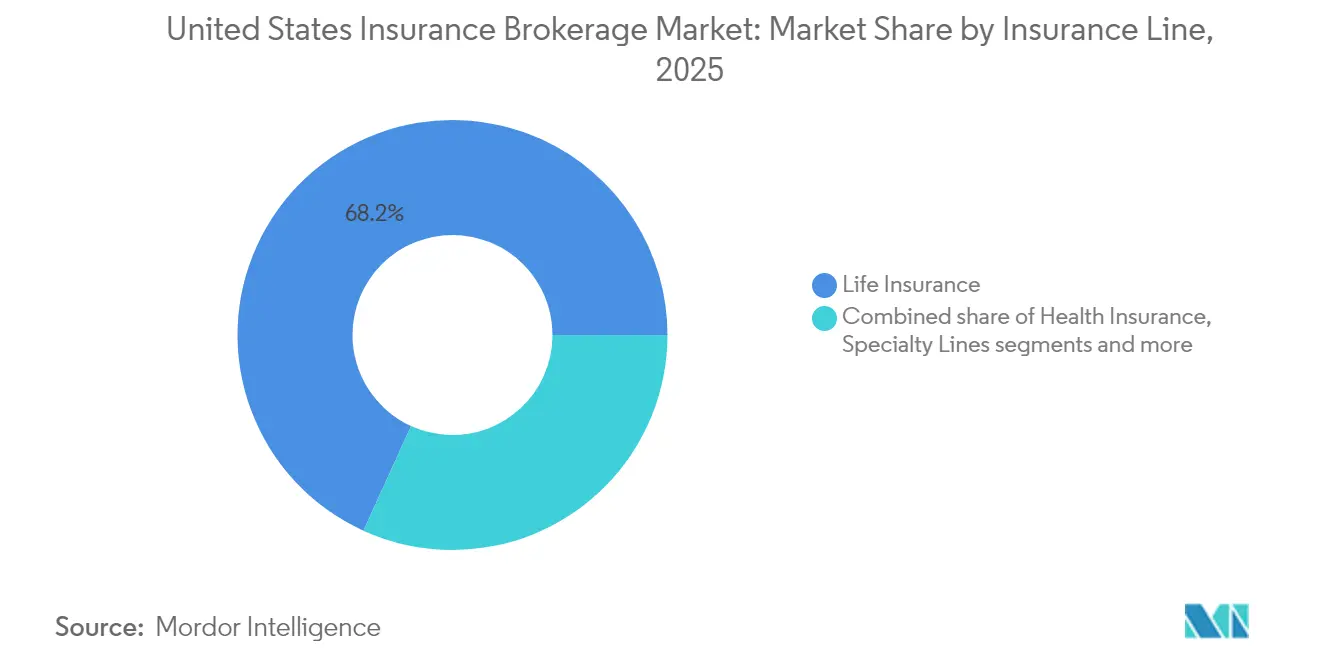
- By insurance line, life insurance captured 68.20% share of the United States insurance brokerage market size in 2025, and specialty lines are advancing at a 5.75% CAGR to 2031.
- By distribution channel, traditional face-to-face sales commanded 56.05% share of the United States insurance brokerage market size in 2025; digital and online platforms hold the highest expected 6.95% CAGR through 2031.
- By geography, the South represented a 33.10% share of the United States insurance brokerage market size in 2025, while the West is set to grow quickest at a 6.25% CAGR to 2031.
Note: Market size and forecast figures in this report are generated using Mordor Intelligence’s proprietary estimation framework, updated with the latest available data and insights as of 2026.
United states contributes to a system defined not by any single country or region but by the interaction of many. The global insurance brokerage market data by Mordor Intelligence represents that combined structure.
United States Insurance Brokerage Market Trends and Insights
Drivers Impact Analysis*
| Driver | (~) % Impact on CAGR Forecast | Geographic Relevance | Impact Timeline |
|---|---|---|---|
| Data-driven pricing & risk-selection models | 0.8% | Global, with early adoption in Northeast financial centers | Medium term (2-4 years) |
| Increasing cyber-attack frequency boosting specialty demand | 1.2% | National, concentrated in tech hubs (West, Northeast) | Short term (≤ 2 years) |
| Hardening P&C rates sustaining brokerage commissions | 0.9% | National, strongest in catastrophe-prone South and West | Medium term (2-4 years) |
| Regulatory tailwinds for fiduciary transparency | 0.6% | National, with state-level variations | Long term (≥ 4 years) |
| Embedded-insurance partnerships with fintech & e-commerce | 1.1% | National, led by West Coast innovation centers | Short term (≤ 2 years) |
| Growing demand for parametric & climate-risk covers | 0.7% | Regional focus on South (hurricanes) and West (wildfires) | Long term (≥ 4 years) |
| Source: Mordor Intelligence | |||
Data-Driven Pricing & Risk-Selection Models Transform Underwriting
Predictive analytics and artificial intelligence tools now allow brokerages to slice historical loss data, external data sets, and carrier appetite information into precise pricing recommendations that lower loss ratios by 15-20% for leading firms[1]Marsh McLennan, “Artificial Intelligence in Insurance and Risk Management,” marshmclennan.com. Brokers that control proprietary data assets embed those insights directly into negotiations, turning formerly relationship-centric exchanges into evidence-based conversations with underwriters. As a result, mid-sized agencies increasingly subscribe to third-party analytics vendors to remain viable, while the largest houses expand internal data science teams. State insurance regulators, via NAIC model rules, demand transparency on algorithmic fairness and governance, adding compliance layers that smaller agencies must budget for[2]National Association of Insurance Commissioners, “Artificial Intelligence Principles,” naic.org. The United States insurance brokerage market, therefore, rewards investment in explainable AI that balances predictive power with regulator trust. Insurers likewise benefit from richer submissions, creating a positive-feedback loop that reinforces data-led broker value.
Cyber-Attack Surge Drives Specialty Coverage Expansion
Ransomware events reported to the FBI jumped 41% year-on-year in 2024, with median extortion payments hitting USD 2.73 million, spurring a surge in cyber-liability demand[3]FBI Internet Crime Complaint Center, “2024 Internet Crime Report,” ic3.gov. The United States insurance brokerage market channels this urgency into a 5.92% specialty-lines CAGR, dwarfing growth rates in traditional P&C. Brokerages establish dedicated cyber practices staffed by forensic analysts and incident-response veterans who can calibrate limit structures, retention levels, and war-exclusion carve-outs. Higher technical complexity means clients value counsel, enabling brokers to command 25-30% higher commission rates than standard commercial placements. Rapidly shifting ransomware variants also shorten policy cycles, giving brokers more frequent touchpoints that translate into sticky advisory relationships. As federal privacy regulations tighten, mid-market enterprises increasingly seek help navigating breach-notification rules, further bolstering broker relevance. Competitive differentiation hinges on access to proprietary incident data and partnerships with cybersecurity vendors, reinforcing first-mover advantages.
Property & Casualty Rate Hardening Sustains Commission Growth
Q3 2024 commercial property rates climbed 8.2% on average, marking the fourteenth straight quarterly increase, while general liability rose 5.1%[4]Council of Insurance Agents & Brokers, “Commercial Property Casualty Market Survey Q3 2024,” ciab.com. Catastrophe-exposed states such as Florida saw commercial property hikes between 25% and 35%, reflecting reinsurance scarcity and climate-linked volatility. Each uptick directly lifts commission dollars for brokers who negotiate percentage-of-premium remuneration, even if account counts stay flat. Clients facing sticker shock increasingly shop across the United States insurance brokerage market, rewarding intermediaries capable of accessing surplus lines or non-admitted carriers. Sophisticated catastrophe modeling has become table stakes; firms without high-resolution hazard analytics risk exclusion from complex placements. The trend also underpins demand for parametric covers that pay on event triggers, compressing claims adjustment timelines and improving client liquidity. Rate-driven revenue growth, however, can mask retention risks, pushing brokers to balance tactical commission upside with strategic client-relationship stewardship.
Fiduciary Transparency Rules Reshape Compensation Models
The Department of Labor’s December 2024 fiduciary rule mandates granular disclosure of broker compensation and conflicts in retirement-plan advice, accelerating a migration toward fee-based structures. Major firms already report 20-25% of employee-benefits income from consulting fees rather than insurer commissions, a figure expected to climb as state regulators extend fiduciary standards beyond pensions. The United States insurance brokerage market consequently shifts emphasis from product distribution to outcome-oriented advisory, favoring firms with actuarial, legal, and HR consulting depth. Fee transparency also pressures smaller agencies that lack diversified revenue streams, prompting mergers that add complementary expertise. Clients welcome simplified pricing that aligns incentives, but brokers must invest in compliance technology to track multi-layered remuneration across carriers. Early adopters leverage transparent models as a selling point, citing independence in carrier selection as proof of fiduciary alignment. The rule’s long-run impact, therefore, intertwines with broader professional-services convergence within brokerage.
Restraints Impact Analysis*
| Restraint | (~) % Impact on CAGR Forecast | Geographic Relevance | Impact Timeline |
|---|---|---|---|
| Talent shortage & escalating producer compensation costs | -1.1% | National, most acute in high-cost Northeast and West markets | Short term (≤ 2 years) |
| Margin pressure from direct-to-consumer digital carriers | -0.8% | National, strongest impact in personal lines and small commercial | Medium term (2-4 years) |
| Increased carrier consolidation reducing brokerage panels | -0.6% | National, with regional variations in specialty markets | Long term (≥ 4 years) |
| Rising E&O litigation risk on advisory failures | -0.4% | National, with higher exposure in complex commercial markets | Medium term (2-4 years) |
| Source: Mordor Intelligence | |||
Talent Shortage Drives Compensation Inflation Across Producer Ranks
Roughly 400,000 insurance professionals are slated to retire by 2026, while new-hire pipelines trail replacement demand by 25%. As competition intensifies for licensed talent, commercial-lines producers in coastal metros now command 8-12% annual pay bumps plus signing bonuses that can exceed USD 100,000. The United States insurance brokerage market passes a portion of those incremental costs on to clients through higher service fees, yet margin compression persists, especially for small agencies. Elevated payroll outlays also divert capital away from technology upgrades, creating a vicious cycle where resource-constrained brokers risk falling further behind digital leaders. State continuing-education mandates add time and expense that favor organizations with in-house training academies. Talent scarcity is most acute in cyber, employee-benefits, and catastrophe-modeling disciplines, where brokers require deep technical fluency to advise clients credibly. Intensified poaching among large firms drives up non-compete litigation, inflating legal budgets.
Direct-to-Consumer Digital Platforms Compress Traditional Broker Margins
Online carriers captured 23% of personal-lines new-business premiums in 2024, up 340 basis points from 2019. Their algorithmic underwriting and aggressive ad spend pull commoditized auto and homeowners business out of traditional agent pipelines, siphoning scale economies. Progressive and GEICO pay broker commissions that sit 200-300 basis points below legacy programs, forcing agencies either to accept thinner take-rates or pivot toward advisory-heavy products. The United States insurance brokerage market thus stratifies firms, focusing on small commercial and personal lines scrambling to embed digital quoting engines and self-service portals, while enterprise-centric brokers double down on complex risks immune to commoditization. Carrier's appetite to invest in direct sales also narrows broker panel slots, shrinking product breadth. Without differentiated advice, brokers risk relegation to transactional middlemen. To survive, mid-sized players adopt hybrid models blending digital convenience with human support and claims advocacy.
*Our forecasts treat driver/restraint impacts as directional, not additive. The impact forecasts reflect baseline growth, mix effects, and variable interactions.
Segment Analysis
By Brokerage Type: Scale Dominance and Specialty Acceleration
Retail houses captured 60.55% of the United States insurance brokerage market share in 2025 by serving vast consumer and mid-market accounts, but reinsurance specialists are projected to log a 5.02% CAGR through 2031 as catastrophe exposure drives treaty-renegotiation volume. Retail leaders integrate analytics, digital self-service, and bundled advisory to defend margins in a commoditizing arena. Simultaneously, wholesale intermediaries channel surplus-lines placements for risks that standard carriers reject, sustaining steady growth despite tighter economic cycles. The reinsurance niche leverages demand for alternative capital, insurance-linked securities, and parametric retrocession layers that respond to climate volatility. Bancassurance brokerage, though the smallest, benefits from deregulation that lets banks cross-sell property-casualty and life solutions within wealth-management branches. The United States insurance brokerage market size for reinsurance is expected to widen as cedents confront rising frequency-severity curves and seek modeling sophistication unavailable in-house. Brokers supplement placements with advisory on retention structures, capital relief, and portfolio diversification.
The competitive tableau favors firms that pair traditional market access with predictive modeling and multi-capital structuring expertise. Global brokers deploy proprietary catastrophe models and sidecar funds to absorb peak-zone exposures, offering insurers capital-relief pathways previously limited to reinsurance giants. Smaller specialists carve niches in facultative placements, targeting high-margin industrial risks. Retail brokers, meanwhile, pilot embedded-insurance APIs to halt share erosion from direct channels. Each sub-segment vies for talent, yet divergent skill sets, retail account management versus quantitative cat modeling limitt cross-over hiring efficiency. Regulatory oversight tightens around reinsurance collateralization, compelling brokers to vet counterparties rigorously. The segment’s success ultimately hinges on balancing speed of placement with depth of analytical justification that satisfies both clients and rating agencies.


By Client Type: Digital Uptake Among Individuals and SME Resilience
Small and medium-sized enterprises delivered 42.35% of the United States insurance brokerage market revenue in 2025, reflecting vibrant post-pandemic entrepreneurship, while individual clients will expand fastest at a 6.7% CAGR to 2031. Millennial wealth accumulation, amplified by digital-advice channels, unlocks appetite for life, disability, and cyber-identity covers once reserved for high-net-worth segments. Brokers deploy robo-onboarding, decision-tree underwriting, and policy-comparison dashboards to serve these cost-conscious yet tech-literate buyers profitably. Large corporates maintain outsized premium spend, but in-house risk managers and captive vehicles dampen organic brokerage growth, pushing brokers toward analytics-centric service retainer models. Public-sector entities continue to require complex insurance programs for critical infrastructure, cyber, and climate resilience, although budget cycles can be protracted. Across client classes, fiduciary transparency and ESG reporting elevate broker roles from transactional procurement to strategic counsel. The United States insurance brokerage market responds by segmenting service teams: mass-affluent digital units, SME hybrid desks, and enterprise consultative pods.
Behavioral segmentation exceeds traditional size-band classification. For individuals, life-event triggers such as home purchase or baby arrival sync with embedded-offer prompts, creating micro-decision windows for brokers. SME owners gravitate toward bundled multiline policies that simplify administration; brokers package P&C, employee benefits, and cyber under unified dashboards. Large corporates demand benchmark reports against peer cohorts, fueling demand for data warehousing and analytics overlays that track claims frequency and severity. Public-sector risk pools encourage brokers to coordinate mutual-aid frameworks and parametric triggers tied to municipal budgets. Cross-selling remains the revenue engine: a broker that secures an SME’s general liability policy often wins subsequent benefits and key-person life placements. Within the United States insurance brokerage market, segmentation mastery yields superior client-lifetime value and cushions margin erosion elsewhere.
By Insurance Line: Life Dominance and Specialty Momentum
Life insurance contributed 68.20% of the United States insurance brokerage market size in 2025 as estate-planning and employee-benefits programs continued to rely heavily on agent counsel. Yet specialty lines spanning cyber liability, pet coverage, parametric climate products, and marine are pacing the field with a 5.75% CAGR to 2031. Brokers succeed here by marrying technical underwriting knowledge with sector-specific risk insights, such as cyber incident response or agricultural weather modeling. Property-casualty maintains healthy volume on the back of rate hardening, though rising deductibles prompt some insureds to self-insure smaller losses. Health-insurance broking confronts margin compression from direct enrollment platforms and carrier vertical integration, but wins advisory retainers on plan design, pharmacy-benefit management, and compliance. Specialty growth also benefits from E&S carriers that accommodate bespoke wordings, giving brokers space to innovate with parametric triggers and usage-based constructs. The United States insurance brokerage market share of specialty insurance, therefore, expands despite its smaller base.
Regulatory lenses sharpen as novel covers proliferate. NAIC working groups examine solvency monitoring for cyber-risk pools, and state departments scrutinize parametric policy language to ensure consumer clarity. Brokers invest in actuarial talent and third-party data partnerships, ransomware frequency files, wildfire spread simulations, and pet health historicals to justify pricing and limit structures. Carrier appetites swing swiftly; when capacity tightens, brokers must tap Lloyd’s syndicates or capital-markets vehicles. Cross-discipline collaboration rises: specialty brokers partner with tech startups to integrate sensor data, enabling dynamic premium adjustments. Meanwhile, life-insurance distribution pivots toward accelerated-underwriting models that use electronic health records and motor-vehicle databases for instant decisions, squeezing traditional medical-exam intermediaries. Overall, line-mix evolution rewards agile brokers who can rebalance portfolios without sacrificing service depth.
By Distribution Channel: Digital Gains and Hybrid Persistence
Traditional agents retained 56.05% of premium placement in 2025, underscoring the enduring appeal of face-to-face advice for complex commercial risks and high-net-worth accounts. Digital and online channels, however, will climb at a 6.95% CAGR through 2031 as quote-bind workflows streamline to under 10 minutes for many personal-lines and micro-commercial policies. Chatbots, e-signature loops, and embedded-API integrations reduce underwriting friction, letting brokers allocate human capital to nuanced advisory tasks. Affinity partnerships, professional associations, alumni networks, and employer groups produce sticky premium flow, balancing trust built outside insurance. Bancassurance channels leverage customer-relationship data in banking cores, generating cross-sell efficiencies and risk insights that enrich underwriting. The United States insurance brokerage market thereby evolves toward a hybrid service: digital intake, algorithmic triage, and expert escalation when complexity rises.
Channel shifts also reshape cost structures. Digital self-service slashes acquisition expenses but demands continuous investment in UX design, cybersecurity, and regulatory compliance modules. Tier-one brokers prioritize scalable cloud platforms, while smaller agencies rely on white-label vendor portals. Regulators enforce parity in disclosure regardless of medium, so digital channels must embed point-of-sale documents and conspicuous consumer-consent checkboxes. Claims advocacy still gravitates toward human expertise; brokers employing video-chat adjusters and AI-assisted damage-estimation tools maintain NPS scores that preserve renewal rates. Data generated from clicks, declines, and endorsements loops back into pricing models, reinforcing the digital feedback cycle. Consequently, the United States insurance brokerage market’s distribution matrix becomes a strategic differentiator rather than a commodity pipeline.
Geography Analysis
The South commanded 33.10% of the United States insurance brokerage market size in 2025, buoyed by population migration, energy-sector diversification, and Sun Belt commercial construction. Yet the West posts a leading 6.25% CAGR to 2031, powered by technology-sector expansion, venture-capital inflows, and high-net-worth household growth. Wildfire, quake, and drought exposures complicate underwriting, incentivizing brokers to develop nuanced catastrophe-mitigation advisory services. The Northeast retains dense corporate insurance spend anchored by financial-services headquarters, but regulatory overhead and aged infrastructure slow growth.
The Midwest’s diversified agriculture and manufacturing base yields a steady premium flow, though severe convective-storm frequency edges higher. State regulatory heterogeneity from California’s Proposition 103 rate approvals to Florida’s Citizens Property reforms means brokers must calibrate strategy per jurisdiction. The United States insurance brokerage market thus prizes geographic agility that pairs compliance acumen with local-risk insights. Regional brokers employ different playbooks. In Texas, brokers arrange layered wind covers integrating private markets, state pools, and parametric triggers to manage hurricane volatility.
California intermediaries bundle cyber, D&O, and EPLI for tech clients while advising on wildfire-mitigation grants and defensible-space audits. Northeast brokers focus on ESG disclosure and supply-chain contingent-business-interruption coverage for multinational manufacturers. Midwestern firms scale crop-hail and livestock insurance programs that blend federal multiperil coverage with private top-ups. Catastrophe analytics vendors provide brokers with zip-code-level risk heatmaps, enabling targeted marketing campaigns. The United States insurance brokerage market, therefore, rewards localized know-how layered atop national service platforms.
The insurance brokerage market is analyzed by Mordor Intelligence across multiple other geographies, with in-depth regional assessments available for Europe.
Competitive Landscape
The United States insurance brokerage market saw accelerated consolidation in 2024, driven by Arthur J. Gallagher & Co.’s acquisition of AssuredPartners, which elevated Gallagher to the fourth-largest broker globally. Despite the growing dominance of the top firms, the market remains sufficiently fragmented, leaving ample room for continued roll-up strategies and regional expansion. Marsh McLennan’s launch of its Climate Risk Analytics platform and Aon’s USD 2.1 billion AI investment exemplify capability buys over geographic expansion. Willis Towers Watson’s USD 850 million purchase of CyberCube Analytics underscores specialty-talent scarcity in cyber modeling. Brown & Brown’s 47 deals in 2024 show the durability of regional tuck-ins that add localized expertise and niche books. Collectively, acquirers chase data assets, specialty practices, and digital infrastructure rather than mere premium volume.
Technological advancements are increasingly distinguishing industry leaders from their lagging counterparts. Marsh has introduced a real-time catastrophe dashboard, while Gallagher boasts an analytics-embedded client portal. Both innovations are demonstrably shortening quote cycles and enhancing limit-adequacy analytics. Meanwhile, nimble start-ups are harnessing AI for triage and blockchain for claims settlements. These ventures are zeroing in on micro-SMEs and the gig economy, posing a challenge to traditional players by targeting their price-sensitive clientele. However, established brokers possess invaluable assets: deep-rooted carrier relationships and a nuanced understanding of regulations. These elements, often taking years to cultivate, provide a significant defensive advantage. In the U.S. insurance brokerage landscape, a hybrid approach is gaining traction. Incumbent firms are not just passive observers; they're actively investing in venture arms, fostering partnerships with insurtechs, and reaping benefits from cross-selling opportunities in their acquired portfolios. The competition for talent is relentless. A testament to this is Lockton's strategic move in mid-2024, bringing on board 15 seasoned cyber producers, underscoring the industry's emphasis on human capital in this era of digital evolution.
Compliance scale emerges as a hidden advantage. State-by-state producer licensing, surplus-lines tax filings, and evolving fiduciary mandates require robust legal and back-office teams. Large brokers automate filings and integrate compliance checkpoints into CRM workflows, reducing error risk. Smaller shops face disproportionate cost burdens, nudging them toward networks or acquisition. Meanwhile, carrier consolidation trims panel access, magnifying the importance of long-standing relationships held by scale brokers. Environmental, social, and governance reporting extends to broker operations, compelling transparency on diversity metrics and carbon footprints. Competitive positioning thus blends financial heft, technology investment, human expertise, and compliance infrastructure, all interlinked elements that define the next decade of the United States insurance brokerage market.
United States Insurance Brokerage Industry Leaders
Marsh McLennan (Marsh)
Aon plc
Willis Towers Watson (WTW)
Arthur J. Gallagher & Co.
Brown & Brown Inc.
- *Disclaimer: Major Players sorted in no particular order

Recent Industry Developments
- October 2024: Arthur J. Gallagher & Co. completed its USD 13.45 billion acquisition of AssuredPartners, creating the fourth-largest insurance brokerage in the United States and expanding Gallagher's presence in high-growth Southeast and Western markets.
- August 2024: Aon plc announced a USD 2.1 billion investment in artificial intelligence and data analytics capabilities, including partnerships with leading technology providers to enhance underwriting, claims processing, and client advisory services.
- July 2024: Willis Towers Watson expanded its cyber risk practice through the acquisition of CyberCube Analytics for USD 850 million, adding catastrophe modeling capabilities for cyber exposures and parametric insurance product development.
- June 2024: Brown & Brown Inc. completed 47 acquisitions totaling USD 3.2 billion in annualized revenue, continuing its aggressive roll-up strategy focused on regional brokers with specialized expertise in employee benefits, personal lines, and commercial property coverage.


United States Insurance Brokerage Market Report Scope
An insurance broker is a person or firm that works for a client to sell and negotiate various insurance products. The report includes a detailed note on the importance of insurance brokers in the United States across various insurance products. The United States insurance brokerage market is segmented by insurance type and by brokerage type. By insurance type, the market is further segmented into life insurance and property & casualty insurance. By brokerage type, the market is further segmented into retail brokerage & wholesale brokerage. The report offers market size and forecasts for the United States insurance brokerage market in value (USD) for all the above segments.
| Retail Brokerage |
| Wholesale Brokerage |
| Reinsurance Brokerage |
| Bancassurance Brokerage Services |
| Individuals |
| Small & Medium-Sized Enterprises (SMEs) |
| Large Corporations |
| Public Sector Entities |
| Life Insurance |
| Health Insurance |
| Property & Casualty (Motor, Home, Commercial, Liability) |
| Specialty Lines (Cyber, Pet, Marine, Travel) |
| Traditional Face-to-Face |
| Digital / Online Platforms |
| Affinity & Embedded Partnerships |
| Bancassurance Partnerships |
| Northeast |
| Midwest |
| South |
| West |
| By Brokerage Type | Retail Brokerage |
| Wholesale Brokerage | |
| Reinsurance Brokerage | |
| Bancassurance Brokerage Services | |
| By Client Type | Individuals |
| Small & Medium-Sized Enterprises (SMEs) | |
| Large Corporations | |
| Public Sector Entities | |
| By Insurance Line | Life Insurance |
| Health Insurance | |
| Property & Casualty (Motor, Home, Commercial, Liability) | |
| Specialty Lines (Cyber, Pet, Marine, Travel) | |
| By Distribution Channel | Traditional Face-to-Face |
| Digital / Online Platforms | |
| Affinity & Embedded Partnerships | |
| Bancassurance Partnerships | |
| By Geography | Northeast |
| Midwest | |
| South | |
| West |


Key Questions Answered in the Report
How big is the United States insurance brokerage market in 2026?
The market is valued at USD 145.8 billion in 2026 and is projected to reach USD 176.14 billion by 2031, registering a 3.86% CAGR.
Which client segment is growing fastest for brokers?
Individual clients show the quickest pace with a 6.7% CAGR through 2031, driven by digital-platform access to sophisticated coverage.
What drives rising brokerage commissions in property and casualty?
A multi-year hard-market cycle has pushed commercial property rates up 8.2% in Q3 2024, directly lifting commission dollars.
Why are cyber-insurance commissions higher than standard lines?
Specialized expertise, complex policy wording, and rising ransomware losses allow brokers to command 25-30% higher commissions on cyber placements.
How does regulation affect broker compensation models?
The 2024 fiduciary rule requires transparent disclosure of broker fees and conflicts, accelerating a shift toward advisory fee income.
Page last updated on:


