Nigeria Telecom Towers Market Size and Share
Market Overview
| Study Period | 2019 - 2030 |
|---|---|
| Forecast Data Period | 2025 - 2030 |
| Historical Data Period | 2019 - 2023 |
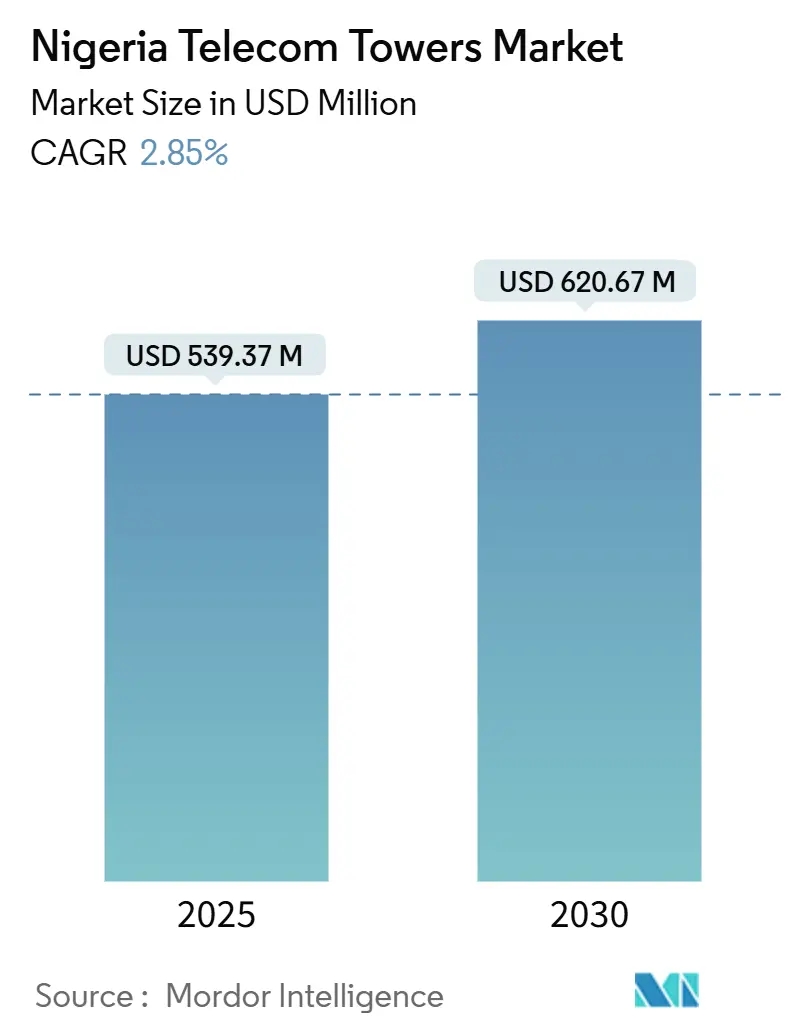
| Market Size (2025) | USD 539.37 Million |
| Market Size (2030) | USD 620.67 Million |
| Growth Rate (2025 - 2030) | 2.85% CAGR |
| Market Concentration | Medium |
Major Players *Disclaimer: Major Players sorted in no particular order Image © Mordor Intelligence. Reuse requires attribution under CC BY 4.0. | |
Nigeria Telecom Towers Market Analysis by Mordor Intelligence
The Nigerian Telecom Towers Market size is estimated at USD 539.37 million in 2025, and is expected to reach USD 620.67 million by 2030, at a CAGR of 2.85% during the forecast period (2025-2030). In terms of the installed base, the market is expected to grow from 41 thousand units in 2025 to 45.46 thousand units by 2030, at a CAGR of 2.09% during the forecast period (2025-2030). This growth reflects a measured trajectory of growth, rooted in rising tenancy ratios, gradual 5G densification, and supportive public-private investment frameworks. Rapid 5G rollouts in Lagos, Abuja, and Port Harcourt, the Federal Executive Council’s 7,000-tower mandate, and green-linked financing for solar-hybrid retrofits collectively reinforce network expansion plans amid currency-related cost pressures. Independent tower companies deepen their dominance through multi-tenant asset strategies, while operators refocus capital on service differentiation after sale-and-leaseback transactions. Renewable-powered sites gain momentum as diesel price volatility and theft risks squeeze operating margins, prompting solar-battery hybrid retrofits. Sophisticated FX- and CPI-indexed lease clauses, along with diesel hedging arrangements, cushion revenue streams against macroeconomic fluctuations, ensuring investor appetite for long-duration, inflation-protected cash flows.
Key Report Takeaways
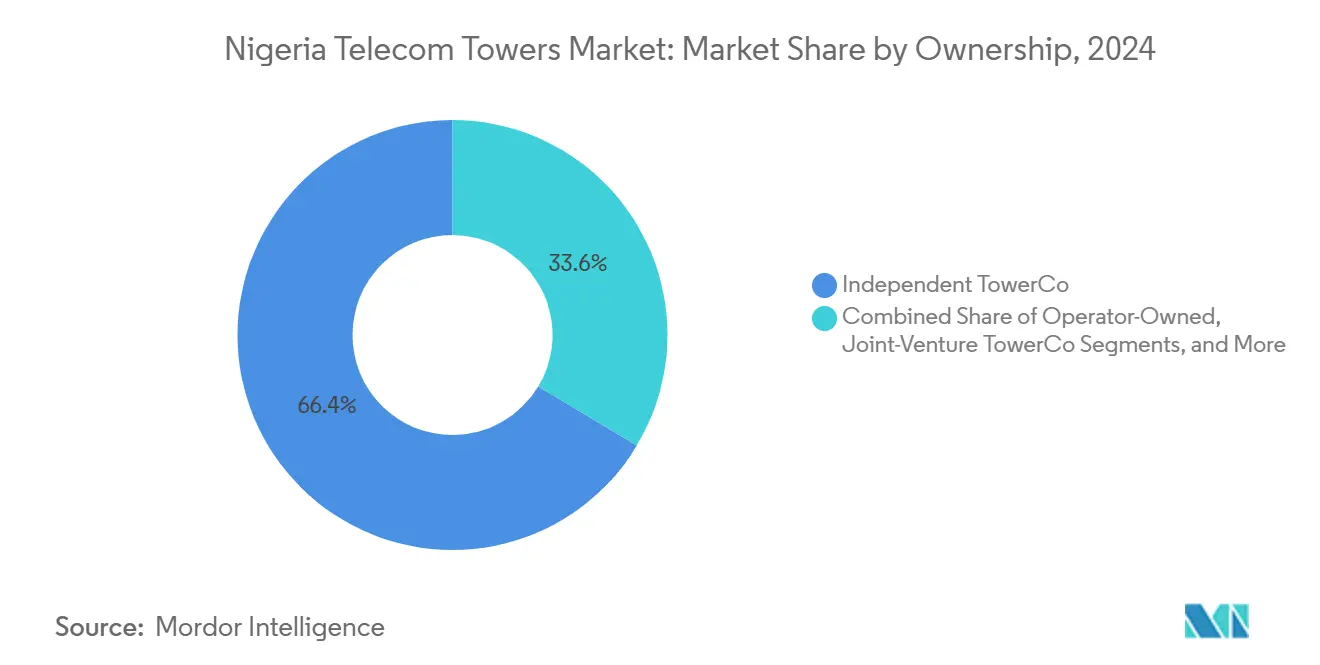
- By ownership, the independent tower companies led the Nigerian telecom towers market with 66.40% of the market share in 2024 and are projected to grow at a 4.91% CAGR through 2030.
- By installation, rooftop solutions captured an 8.98% CAGR, the fastest among installation types, while ground-based sites retained a 74.56% revenue share in 2024.
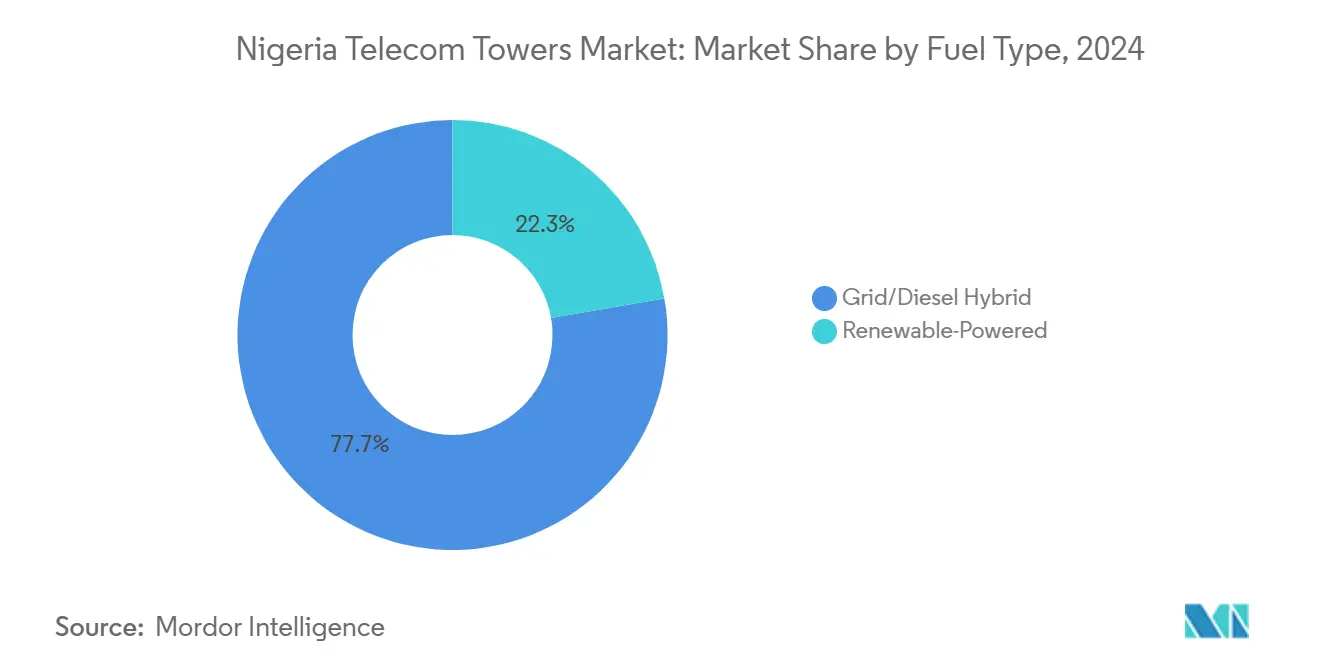
- By fuel type, renewable-powered solutions are forecast to expand at a 13.92% CAGR to 2030, even as grid/diesel hybrids held an 85.03% share of the Nigeria telecom towers market in 2024.
- By tower type, lattice structures are expected to advance at a 6.54% CAGR through 2030, whereas monopoles accounted for 50.69% of the Nigerian telecom towers market in 2024.
Nigeria Telecom Towers Market Trends and Insights
Drivers Impact Analysis*
| Driver | (~) % Impact on CAGR Forecast | Geographic Relevance | Impact Timeline |
|---|---|---|---|
| Rapid 5G Rollout Commitments by MTN, Airtel and Mafab | +1.2% | Lagos, Abuja, Port Harcourt first | Medium term (2-4 years) |
| Federal Executive Council Approval for 7,000 New Towers | +0.8% | Underserved rural corridors | Medium term (2-4 years) |
| Rising Mobile Data Consumption Boosting Tenancy Ratios | +0.9% | Urban centers nationwide | Short term (≤ 2 years) |
| FX- and CPI-Indexed Lease Models De-Risking Revenues | +0.4% | National | Long term (≥ 4 years) |
| Diesel-Price Hedge Clauses Lowering OPEX Volatility | +0.3% | Rural focus | Short term (≤ 2 years) |
| Green-Linked DFI Financing for Solar-Hybrid Retrofits | +0.6% | Off-grid locations | Long term (≥ 4 years) |
| Source: Mordor Intelligence | |||
Rapid 5G Rollout Commitments by MTN, Airtel and Mafab
MTN ended 2024 with 2,251 live 5G sites and 11.3% population coverage, Airtel secured USD 200 million IFC funding to scale its own network, and Mafab began pilot clusters in Lagos and Abuja. Millimeter-wave spectrum necessitates denser site grids, propelling tenancy ratios as operators co-locate on existing towers to manage capex. [1]MTN Group, “Interim financial results for the six months ended 30 June 2024,” mtn-investor.comIndependent tower companies benefit immediately from urban densification because each new 5G layer adds radio heads to current structures rather than creating greenfield builds. Tenancy upgrades carry minimal incremental opex, lifting tower-level EBITDA margins. As operators race to replicate nationwide 4G coverage levels by 2027, the adoption of mid-band 5G in secondary cities stimulates additional colocation demand, reinforcing the Nigerian telecom tower market’s recurring-revenue model.
Federal Executive Council Approval for 7,000 New Towers
The March 2025 green-light drives investment into economically marginal rural zones by balancing financial risk between the state and private tower firms. [2]Federal Executive Council, “Communiqué on National Telecom Infrastructure Expansion 2025,” nigeriagov.ng Deployment guidelines prioritize communities with weak or no broadband signals, directly supporting the National Broadband Plan’s goal of 70% penetration. The scheme mandates open-access leasing, ensuring every licensed mobile network operator can secure capacity on cost-based terms. Guaranteed anchor-tenant pre-commitments, import-duty waivers on structural steel, and fast-track environmental approvals shorten payback periods below seven years, an improvement over legacy rural economics. Consequently, tower firms forecast higher internal rates of return, even in low-ARPU districts, which incentivizes accelerated build programs.
Rising Mobile Data Consumption Boosting Tenancy Ratios
Monthly data usage climbed 44.9% year-on-year to 8.2 GB per subscriber in 2024, driven by TikTok short-form video and a 55.6% smartphone penetration rate. Operators increasingly prefer adding third-party tenants rather than building proprietary structures, lifting the nationwide tenancy ratio to 1.59x by December 2024. Each 10 percentage-point increase in 4G traffic pushes an additional 0.05x in tenancy density, creating a virtuous profitability cycle for tower companies. Edge-computing pilots for gaming and fintech latency requirements stimulate micro-data-center add-ons at tower bases, a high-margin ancillary revenue stream. Independent tower companies, therefore, leverage both higher collocation rents and emerging edge services, strengthening revenue diversity against ARPU compression risk.
FX- and CPI-Indexed Lease Models De-Risking Revenues
IHS Towers historically denominated 60% of its Nigerian revenue in USD, but 2024 amendments with MTN shifted a portion to inflation-linked naira payments, embedding quarterly CPI escalators alongside diesel hedging triggers. The hybrid approach reduces tenant exposure to naira depreciation while securing a predictable local-currency cash flow for lenders. Better duration matching allows tower companies to tap domestic bond markets for NGN-denominated debt, lowering weighted-average cost of capital by 120 basis points. Multilateral investors view the structure as proof of maturing counterparty alignment, widening the investable universe for pension funds and infrastructure funds that require steady naira yields.
Restraints Impact Analysis*
| Restraint | (~) % Impact on CAGR Forecast | Geographic Relevance | Impact Timeline |
|---|---|---|---|
| Naira Volatility Inflating Imported CAPEX | –0.7% | National | Short term (≤ 2 years) |
| Chronic Grid Outages and Diesel Theft | –0.5% | Rural bias | Medium term (2-4 years) |
| Site-Permitting Delays from Land-Tenure Disputes | –0.3% | Rural margins | Long term (≥ 4 years) |
| New Right-of-Way Fees by State Governments | –0.2% | Selected states | Medium term (2-4 years) |
| Source: Mordor Intelligence | |||
Naira Volatility Inflating Imported CAPEX
The naira weakened from 461.10/USD at end-2022 to 907.11/USD at end-2023, doubling the local-currency cost of imported steel, antennas, and lithium batteries. MTN responded by trimming 2024 capex by 69.1%, delaying non-critical projects until forex liquidity improves. Tower firms hedge 40-50% of anticipated equipment imports through forward contracts, but residual exposure erodes IRRs on new builds. Currency swings also inflate debt-service obligations on USD loans, forcing management to renegotiate covenants or refinance in higher-cost naira instruments. The macro headwind mainly moderates near-term ground-up build volumes yet does not materially affect contracted lease cash flows once assets are operational.
Chronic Grid Outages and Diesel Theft
Average daily grid uptime outside Lagos hovers below 10 hours, compelling tower owners to operate generators for prolonged periods. [3]IHS Towers, “Project Green Progress Update 2024,” ihstowers.comDiesel constitutes nearly 24% of site opex, and theft shaved 4-5 percentage points off EBITDA margins in 2024 despite the installation of remote fuel sensors and perimeter alarms. Hybrid solar-battery retrofits under Project Green cut generator runtime by 55% on upgraded sites, but roll-out remains capital-intensive. Rural exposure increases the risk due to longer resupply routes and limited security presence. Until national power-sector reforms deliver reliable grid electricity, diesel dependence will continue to suppress cash conversion rates, particularly on single-tenant rural towers.
*Our forecasts treat driver/restraint impacts as directional, not additive. The impact forecasts reflect baseline growth, mix effects, and variable interactions.
Segment Analysis
By Ownership: Independent Tower Companies Extend Lead
Independent tower companies controlled 66.40% of Nigeria's telecom towers market share in 2024 and are projected to compound at a 4.91% CAGR through 2030, underscoring the appeal of asset-light operator strategies favoring sale-and-leaseback monetization. The Nigeria telecom tower market is driven by tenancy-ratio uplift and expansion into rural corridors. Operator-owned assets shrink as MTN and Airtel monetize portfolios to fund spectrum fees and digital-service plays. Joint-venture vehicles persist for strategic locations such as submarine-cable landing stations, while MNO captive towers remain limited to mission-critical backbone nodes. Regulatory encouragement of infrastructure sharing, combined with investors’ appetite for predictable inflation-linked yields, sustains a pipeline of portfolio divestitures to independent specialists.
Continued consolidation elevates bargaining power with equipment suppliers, enabling bulk procurement discounts of up to 12% versus single-operator purchasing. Independents also deploy centralized NOC platforms that integrate AI-driven predictive maintenance, cutting diesel consumption and unplanned outages. These operational efficiencies attract multilateral climate-finance facilities eager to back high-impact green-infrastructure upgrades, further lowering WACC and reinforcing competitive advantages.


By Installation: Rooftops Accelerate Urban Densification
Ground-based towers retained 74.56% of the Nigeria telecom towers market size in 2024, as wide-area rural coverage remains the primary connectivity goal. Rooftop deployments, however, clock an 8.98% CAGR to 2030, reflecting demand for urban capacity layers where small cell backhaul and in-building penetration are critical. Nigeria telecom tower market share attributed to rooftops is projected to improve by 320 basis points over the forecast window, propelled by streamlined permitting and zero land-acquisition expenses. Building owners gain incremental rental income, while tower companies deploy lightweight monopoles and concealed antennas to satisfy municipal aesthetic codes.
Rooftops also support neutral-host indoor DAS networks in commercial real estate, airports, and shopping centers, generating higher per-site ARPUs than macro structures. Integration with edge-computing cabinets further differentiates rooftop assets, offering low-latency processing for fintech and streaming applications. Although structural load limits cap tenant count, advancements in composite materials enable multi-operator configurations without reinforcing roof slabs, trimming deployment timelines.
By Fuel Type: Renewables Gain Momentum
Grid/diesel hybrids dominated 85.03% of Nigeria's telecom towers market size in 2024, yet renewable-powered solutions are set for a 13.92% CAGR through 2030. Nigeria telecom tower market share captured by solar-battery hybrids is forecast to reach 26% by 2030 as photovoltaic module prices fall and lithium-ion storage packs lengthen cycle life. Development-finance institutions channel concessional loans at sub-10% interest, contingent on measurable emission-intensity reductions.
Rising carbon-pricing chatter in export markets pressures MNOs to decarbonize supply chains, positioning green power upgrades as a strategic imperative. Pure grid-only sites remain rare until national electricity reforms materialize, while diesel-only systems taper off as theft and price volatility erode profitability. Hybrid systems thus provide the optimum balance of reliability and cost control in Nigeria’s current power landscape.
By Tower Type: Lattice Structures Support Multi-Tenant Growth
Monopoles accounted for 50.69% of Nigeria's telecom towers market size in 2024, favored for urban or roadside use cases requiring minimal footprints. Lattice structures, however, will record a 6.54% CAGR on the back of multi-tenant demand. Their high-load capacity accommodates multiple 5G Massive-MIMO arrays, microwave dishes, and edge-computing cabinets without structural upgrades. Nigeria telecom tower market share for lattice designs is projected to rise by 410 basis points by 2030. Guyed towers continue serving low-density rural zones, given their lower capex, while stealth alternatives satisfy city-center visual-impact restrictions but remain niche.
Lattice designs also enable cost-effective tower-top solar canopies, integrating 3-5 kW PV panels that feed on-site batteries. This incremental power generation supports small cooling loads for edge servers, further monetizing existing real estate. High steel content initially hikes capex during naira weakness, yet higher rental yields and longevity offset the disadvantage over a 25-year asset life.
Geography Analysis
The Nigeria telecom towers market concentration remains highest in Lagos, Abuja, and Port Harcourt, which together accounted for an estimated 48% of active sites in 2024. These metros deliver average tenancy ratios above 1.8x owing to dense subscriber bases and relatively stable grid supply. Nigeria's telecom tower market is bolstered by oil-export corridor upgrades and port modernization projects that demand robust data connectivity. Mid-belt states see balanced growth as agritech deployments and minerals exploration digitize operations, driving incremental tower demand for IoT sensor backhaul.
Northern states exhibit the widest coverage deficit yet represent the largest upside once security concerns subside. The Federal Executive Council’s 7,000-tower program earmarks 45% of new builds for these regions, supported by viability gap funding that subsidizes civil works and renewable power kits. Nigeria's telecom tower market share in the north is projected to climb from 21% in 2024 to 26% by 2030, narrowing the urban-rural digital divide. Border areas additionally require terrestrial links for ECOWAS roaming corridors and cross-border fiber hand-offs, adding specialized microwave relay sites.
Site economics increasingly hinge on power availability; clusters near hydro-rich states like Niger and Benue enjoy grid uptimes exceeding 16 hours daily, shaving 9% off opex versus diesel-dependent peers in Sokoto or Kebbi. Consequently, tower companies prioritize renewable retrofits where grid unreliability erodes margins, clustering solar-battery hybrids in sun-belt regions. Regulatory facilitation by the Nigerian Communications Commission expedites permits for shared passive infrastructure, particularly where new state right-of-way fees threaten deployment costs.
Competitive Landscape
IHS Towers controls 16,395 sites and 26,009 tenants, translating to a 36% physical-tower share and an even greater revenue footprint owing to its higher tenancy ratio. American Tower Corporation follows with roughly 10,100 structures after securing a multi-year MTN build-to-suit mandate in 2024. Pan African Towers and a cluster of local independents, such as Hotspot Networks, fill regional niches, while operator-owned remnants shrink via staged divestitures. Competition centers on lease renewal terms, fuel-cost pass-through clauses, and sustainability scorecards demanded by multilateral financiers.
Strategic activity increasingly targets operational efficiency rather than raw build volumes. IHS deployed AI-driven predictive-maintenance software that reduced mean-time-to-repair by 22%, while American Tower’s remote-monitoring rollout trimmed diesel pilferage incidents 30%. Both groups accelerate solar retrofits, unlocking concessional green-bond financing that lowers interest expense and lengthens debt tenors. Smaller rivals differentiate through rapid rooftop deployments for enterprise small-cell networks, leveraging lighter balance sheets and shorter permit cycles.
Edge-computing partnerships emerge as the next battleground. IHS inked a memorandum with a pan-African CDN provider to co-locate micro-data cabinets on 50 Lagos towers, while American Tower pilots content-caching nodes for video-streaming services. These initiatives diversify revenue beyond pure tenancy rent, positioning leaders for cloud-adjacent growth. Despite rising rivalry, contractual lock-ins exceeding 9 years on average create high switching barriers, preserving stable cash flows essential for long-duration infrastructure investors.
Nigeria Telecom Towers Industry Leaders
IHS Holding Limited (IHS Towers)
American Tower Corporation (ATC Nigeria)
Pan African Towers Limited
Communication Towers Nigeria Limited
Eastcastle Infrastructure Limited
- *Disclaimer: Major Players sorted in no particular order


Recent Industry Developments
- March 2025: Federal Executive Council sanctioned 7,000 new telecom towers through public-private partnerships to expand rural broadband coverage.
- September 2024: Jaza Energy and IHS Towers agreed to deploy 250 solar-powered rural sites, reinforcing sustainability credentials.
- August 2024: MTN Nigeria renegotiated master lease terms with IHS Towers, cutting USD-indexed components and embedding diesel-cost hedges, yielding NGN 100-110 billion annual cash-flow gains.


Nigeria Telecom Towers Market Report Scope
Telecom towers encompass a variety of structures, such as monopoles, tripoles, lattice towers, guyed towers, self-supporting towers, poles, masts, and other similar forms. These towers, equipped with one or more telecommunication antennas, facilitate radio communications. They can be situated on the ground or atop a building's rooftop and often include storage for equipment and electronic components.
The Nigeria telecom towers market is segmented by ownership (operator-owned, private-owned, and MNO Captive sites), by installation (rooftop, and ground-based), and by fuel type (renewable and non-renewable). The Market Sizes and Forecasts are Provided in Terms of Installed Base (in Thousand Units) for all the Above Segments.
| Operator-Owned |
| Independent TowerCo |
| Joint-Venture TowerCo |
| MNO Captive |
| Rooftop |
| Ground-Based |
| Renewable-Powered |
| Grid/Diesel Hybrid |
| Monopole |
| Lattice |
| Guyed |
| Stealth/Concealed |
| By Ownership | Operator-Owned |
| Independent TowerCo | |
| Joint-Venture TowerCo | |
| MNO Captive | |
| By Installation | Rooftop |
| Ground-Based | |
| By Fuel Type | Renewable-Powered |
| Grid/Diesel Hybrid | |
| By Tower Type | Monopole |
| Lattice | |
| Guyed | |
| Stealth/Concealed |


Key Questions Answered in the Report
How large is the Nigeria telecom tower market today?
The market generated USD 539.37 million in revenue in 2025 and is projected to reach USD 620.67 million by 2030.
What is the expected growth rate for telecom towers in Nigeria?
Industry revenue is forecast to grow at a 2.85% CAGR between 2025 and 2030, supported by 5G densification and rural connectivity mandates.
Who are the leading tower companies operating in Nigeria?
IHS Towers holds the largest portfolio with 16,395 structures, followed by American Tower Corporation and Pan African Towers.
How is renewable energy adoption progressing at tower sites?
Solar-battery hybrids are expanding at a 13.92% CAGR, driven by Project Green investments that cut diesel runtime by more than half on upgraded sites.
What risks do tower operators face in Nigeria?
Key challenges include naira volatility inflating imported equipment costs and chronic grid outages that heighten diesel dependence and theft risk.
How will the 7,000-tower government program affect the market?
The initiative will accelerate rural coverage, adding new revenue streams for tower companies through subsidized public-private deployments.
Page last updated on:


