South Africa Telecom Tower Market Size and Share
Market Overview
| Study Period | 2020 - 2031 |
|---|---|
| Forecast Data Period | 2026 - 2031 |
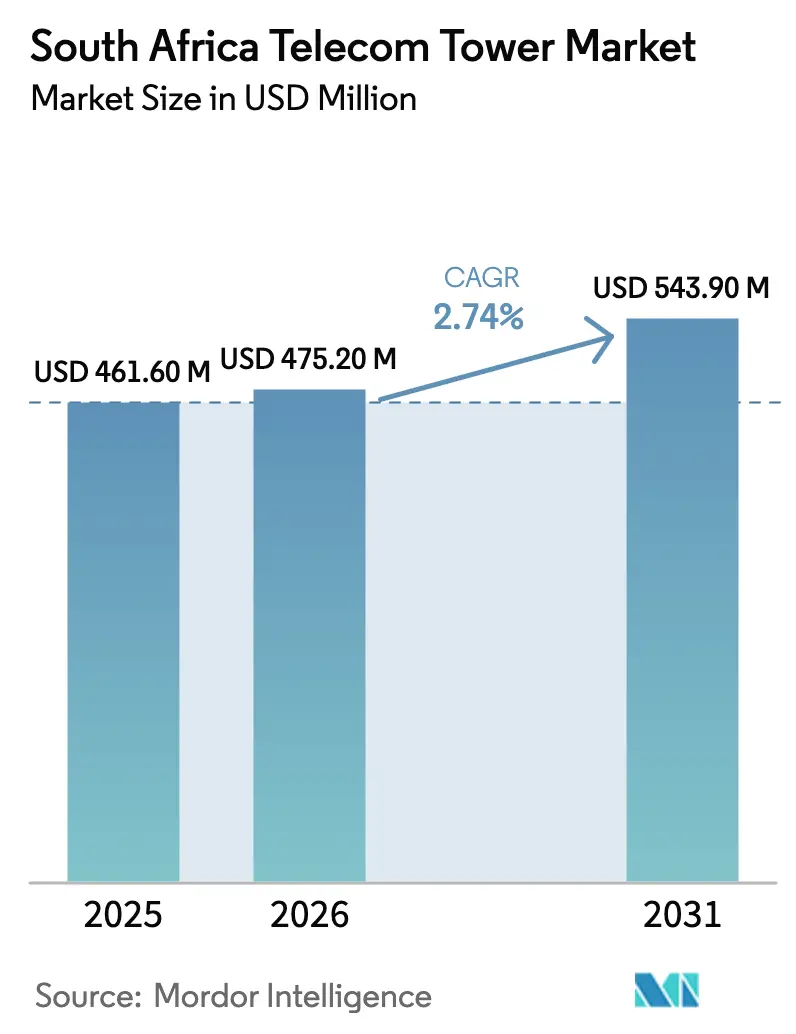
| Base Year Market Size (2025) | USD 461.60 Million |
| Market Size (2026) | USD 475.20 Million |
| Market Size (2031) | USD 543.90 Million |
| Growth Rate (2026 - 2031) | 2.74% CAGR |
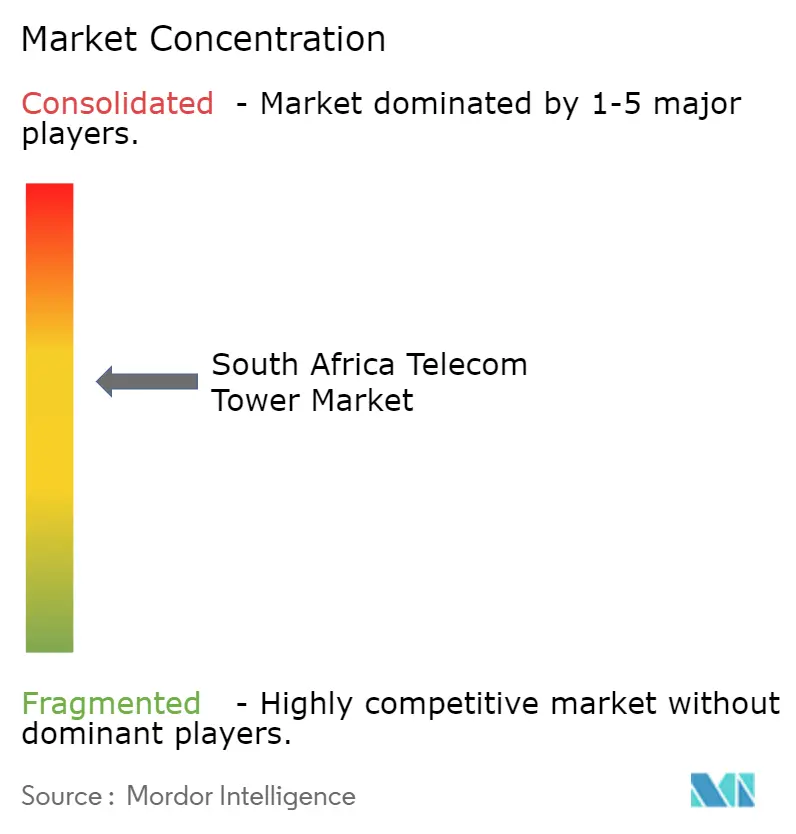
| Market Concentration | Medium |
Major Players *Disclaimer: Major Players sorted in no particular order Image © Mordor Intelligence. Reuse requires attribution under CC BY 4.0. | |
South Africa Telecom Tower Market Analysis by Mordor Intelligence
The South Africa telecom tower market size is expected to increase from USD 461.6 million in 2025 to USD 475.2 million in 2026 and reach USD 543.9 million by 2031, growing at a CAGR of 2.74% over 2026-2031. Ongoing divestitures by mobile network operators (MNOs), sustained private-equity interest, and rising demand for resilient off-grid power solutions are reshaping ownership structures and cost curves. High-density urban footprints continue to improve tenancy ratios, while rural build-to-suit contracts benefit from microwave backhaul economics and streamlined open-access policies. At the same time, persistent load-shedding, copper theft, and land-lease uncertainty inflate operating risk, forcing tower companies (towercos) to adopt power-as-a-service contracts, rooftop installations, and stealth designs that comply with municipal aesthetic rules. Competitive intensity remains moderate because scale advantages in diesel procurement, security, and site maintenance still determine margin leadership, even as new spectrum allocations compress upgrade cycles and lift co-location revenue.
Key Report Takeaways
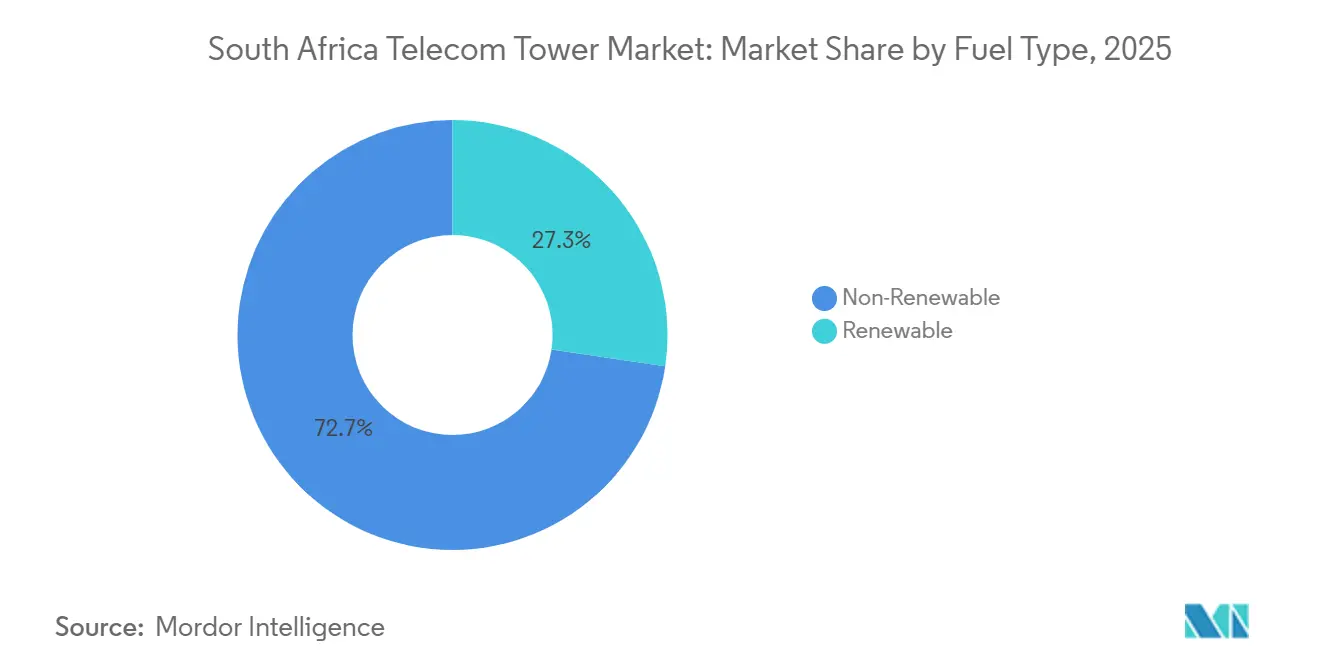
- By fuel type, non-renewable systems commanded 72.67% of deployments in 2025, while renewable configurations are expanding at a 4.34% CAGR through 2031.
- By type of tower, lattice structures held a 28.89% share of the South Africa telecom tower market size in 2025, but stealth formats are advancing at 4.28% over 2026-2031.
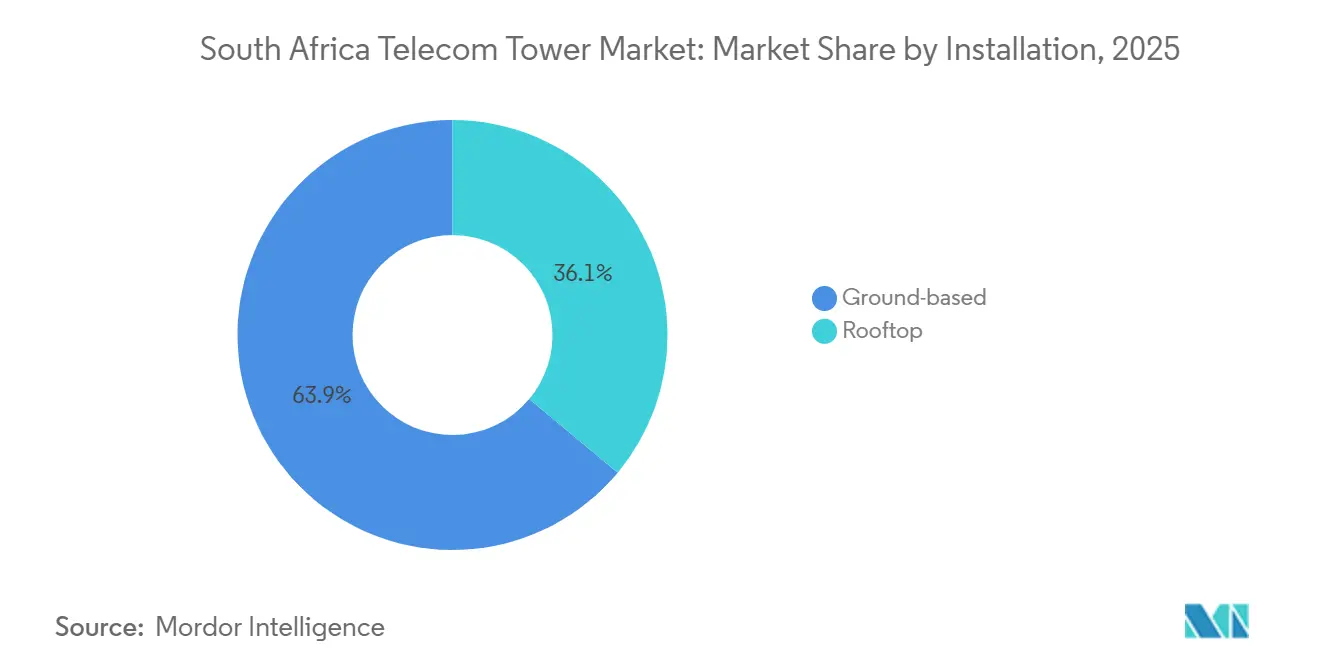
- By installation, ground-based sites delivered 63.94% of the South Africa telecom tower market share in 2025, whereas rooftop builds are the fastest-growing category at 3.57% CAGR.
- By ownership, private towercos controlled 59.26% of sites in 2025 and continue to expand through carve-outs, while MNO-captive assets record a 4.01% CAGR between 2026 and 2031.
Note: Market size and forecast figures in this report are generated using Mordor Intelligence’s proprietary estimation framework, updated with the latest available data and insights as of January 2026.
South Africa Telecom Tower Market Trends and Insights
Drivers Impact Analysis*
| Driver | (~) % Impact on CAGR Forecast | Geographic Relevance | Impact Timeline |
|---|---|---|---|
| Rapid 5G Spectrum Allocations Boost Tenancy Ratios | +0.9% | National, Early Gains in Gauteng, Western Cape, KwaZulu-Natal | Medium Term (2-4 Years) |
| Outsourcing Wave as MNOs Monetize Passive Assets | +0.7% | National, Metro and Peri-Urban Clusters | Short Term (≤ 2 Years) |
| Private-Equity Backing Accelerates Carve-Outs | +0.5% | National, Deal Flow in Gauteng, Western Cape | Short Term (≤ 2 Years) |
| Load-Shedding Crisis Spurs Power-as-a-Service | +0.6% | National, Acute in Gauteng, Eastern Cape, KwaZulu-Natal | Medium Term (2-4 Years) |
| Draft Open-Access Policy Compresses Permitting | +0.3% | National, Pilot Rollouts in Metros | Long Term (≥ 4 Years) |
| High-Altitude Microwave Rings Unlock Rural Sites | +0.4% | Limpopo, Northern Cape, Eastern Cape, Mpumalanga | Long Term (≥ 4 Years) |
| Source: Mordor Intelligence | |||
Rapid 5G Spectrum Allocations Boost Tenancy Ratios
ICASA’s plan to release roughly 280 MHz in sub-1 GHz and mid-band spectrum has accelerated antenna upgrades and increased co-location bookings across established portfolios.[1]Independent Communications Authority of South Africa, “Draft National Radio Frequency Plan 2025,” icasa.org.za Swiftnet recorded a 25.8% year-on-year rise in tenancy revenue to ZAR 324 million (USD 20 million), illustrating how operators deploy 5G radios on existing 4G sites rather than funding greenfield builds. Blue Sky Towers now operates at ratios near 3.0, and incremental 5G gear creates additional revenue streams from structural-reinforcement fees. Metro-dense assets in Johannesburg and Cape Town therefore enjoy higher lease rates and faster paybacks, a trend validated by Rain’s rollout of 2,800 5G fixed-wireless sites.
Outsourcing Wave as MNOs Monetize Passive Assets
Telkom’s April 2025 sale of Swiftnet for ZAR 6.75 billion (USD 370.9 million) exemplifies how operators unlock capital for spectrum fees and core-network upgrades.[2]Telkom SA SOC Ltd., “Unaudited Interim Results for the Six Months Ended 30 September 2024,” telkom.co.za MTN and Vodacom have evaluated similar carve-outs because tower ownership no longer confers strategic differentiation once network quality depends more on spectrum depth and transport capacity. Independent towercos aggregate portfolios, centralize diesel procurement, and secure volume discounts on batteries, delivering opex savings that captive divisions cannot match. Regulatory approval of the Swiftnet transaction signals confidence that non-discriminatory access can coexist with private ownership.
Private-Equity Backing Accelerates Carve-Out Transactions
A consortium led by Actis acquired 70% of Swiftnet, while Royal Bafokeng Holdings took the remaining 30%, underscoring investor appetite for inflation-linked cash flows in a data-hungry market. The price equated to roughly 12-15 times EBITDA, reflecting expectations that tenancy growth and power-cost optimization will lift margins above the 73.2% reported in fiscal 2025. IHS Towers, with 2,079 domestic sites, has similarly attracted institutional capital by highlighting multi-year lease visibility. These transactions compress the timeline for additional divestitures as remaining MNOs recognize the valuation uplift from spinning out passive assets.
Load-Shedding Crisis Spurs Power-as-a-Service Adoption
Frequent Eskom outages boost diesel usage and inflate site opex by 20-30%, prompting towercos to outsource energy management to specialized providers. Swiftnet connected 499 solar-hybrid power-as-a-service solutions in its latest fiscal quarter, cutting grid reliance and eliminating diesel logistics. Telkom trimmed diesel spend by 87.8%, or ZAR 78 million (USD 4.8 million), after rolling out lithium-ion battery banks, achieving under-24-month paybacks when diesel exceeds ZAR 25 per liter Vodacom and MTN have equipped over 2,700 sites with similar systems, and service-level agreements guarantee 99.5% uptime, transforming volatile fuel costs into predictable per-kilowatt-hour charges.[3]Vodacom Group Limited, “Integrated Report for the Year Ended 31 March 2024,” vodacom.co.za
Restraints Impact Analysis*
| Restraint | (~) % Impact on CAGR Forecast | Geographic Relevance | Impact Timeline |
|---|---|---|---|
| Persistent Eskom Outages Inflate Site OPEX 20-30% | -0.6% | National, Severe in Eastern Cape, Gauteng, KwaZulu-Natal | Short Term (≤ 2 Years) |
| Lengthy Municipal Way-Leave Approvals | -0.4% | National, Acute in Metros With Complex Zoning | Medium Term (2-4 Years) |
| Rising Crime and Copper Theft Escalate Security CAPEX | -0.5% | National, Concentrated in Gauteng, Western Cape, KwaZulu-Natal | Short Term (≤ 2 Years) |
| Land-Reform Uncertainty Raises Ground-Lease Renewals | -0.3% | Peri-Urban Limpopo, Mpumalanga, Eastern Cape | Long Term (≥ 4 Years) |
| Source: Mordor Intelligence | |||
Persistent Eskom Outages Inflate Site OPEX 20-30%
Grid instability forces operators to run dual-fuel configurations that raise operating costs by up to one-third.[4]MTN Group Limited, “Interim Results for the Six Months Ended 30 June 2024,” mtn.com MTN set aside ZAR 1.1 billion (67.9 million) for security and power resilience in the first half of 2024, while Vodacom spent ZAR 800 million (USD 49.4 million) on similar defenses. Diesel logistics add complexity because weekly refueling runs to remote sites are prone to theft and price swings. Smaller towercos struggle to finance lithium-ion upgrades, and South Africa lacks regulatory resilience standards, leaving companies to self-insure through redundant systems that erode returns.
Rising Crime and Copper Theft Escalate Security CAPEX
MTN recorded 5,887 theft incidents in the first six months of 2024, prompting deployment of armed guards, perimeter fencing, and remote sensors. Vodacom fitted GPS trackers on battery banks as syndicates resell lithium-ion cells in gray markets. High crime reshapes site-selection logic, encouraging rooftop installations that leverage building security systems to deter intrusion. Insurance premiums for tower assets have climbed 15-20% since 2024, compressing margins especially in Gauteng and Western Cape.
*Our forecasts treat driver/restraint impacts as directional, not additive. The impact forecasts reflect baseline growth, mix effects, and variable interactions.
Segment Analysis
By Fuel Type: Renewable Systems Gain Traction Amid Diesel Dependence
Non-renewable energy powered 72.67% of towers in 2025, underscoring diesel’s hold on the South Africa telecom tower market share. Renewable configurations, chiefly solar-hybrid systems with lithium-ion storage, are advancing at a 4.34% CAGR to 2031 as operators hedge against fuel volatility and Eskom outages. Telkom cut diesel outlays by 87.8%, equal to ZAR 78 million (USD 4.8 million), after installing battery-solar hybrids, proving paybacks fall below two years when diesel exceeds ZAR 25 (USD 1.5) per liter. MTN and Vodacom have already converted more than 2,700 sites, validating commercial viability even without feed-in tariffs.
Hybrid architectures now dominate greenfield builds in Limpopo and Northern Cape where diesel logistics are costly, while metros with 95% grid uptime still favor direct Eskom feeds. Power-as-a-service contracts guarantee 99.5% availability and convert erratic fuel spend into predictable per-kilowatt-hour charges that improve site-level returns. The International Telecommunication Union links these renewable rollouts to South Africa’s Paris Agreement commitments, reinforcing corporate sustainability targets. As fuel prices rise, the South Africa telecom tower market size tied to renewable power is expected to outpace overall growth, narrowing the dominance of legacy diesel systems by 2031.


By Type of Tower: Stealth Designs Satisfy Urban Aesthetic Codes
Lattice towers accounted for 28.89% of installations in 2025, but stealth variants are growing at a 4.28% CAGR as municipalities impose strict visual-impact bylaws in Gauteng and Western Cape. Disguised palm trees, flagpoles, and façade-mounted antennas add a 30-40% capex premium, yet developers absorb the cost to avoid 12-18-month permitting delays. Guyed towers remain niche for high-wind rural corridors, while monopoles strike a balance between structural efficiency and visual acceptance in suburban infill projects.
Rooftop stealth antennas address landlord concerns about tenant perception, supporting densification in Johannesburg’s central business district where co-location ratios top 3.0. The flexible profiles also accommodate 5G radios without extensive structural reinforcement, further boosting tenancy revenue for towercos focused on the South Africa telecom tower market. Community approval has become a gating factor for rollout speed, making stealth formats critical to meeting 2031 coverage targets. As urban data demand climbs, stealth and monopole designs are poised to chip away at the South Africa telecom tower market share historically held by lattice structures.
By Installation: Rooftop Builds Shortcut Permitting and Cut Theft Risk
Ground-based towers delivered 63.94% of deployments in 2025, reflecting legacy build patterns, but rooftop sites are expanding at a 3.57% CAGR through 2031 as towercos exploit existing buildings to bypass municipal way-leave queues. Johannesburg, Cape Town, and Durban now clear rooftop leases in weeks, whereas ground sites can languish 18 months in zoning review, slowing network densification.
Rooftop locations leverage building security systems to deter copper theft, lowering insurance premiums that have risen 15-20% since 2024. They also shorten fiber runs, reducing backhaul latency important for 5G fixed-wireless services. Ground installations remain vital for rural coverage where building heights are insufficient for long-haul propagation, a reality underscored by Swiftnet’s 14 new greenfield towers in peri-urban Gauteng. Nevertheless, accelerating rooftop adoption will gradually boost this segment’s contribution to the South Africa telecom tower market size over the forecast horizon.
By Ownership: Private Towercos Consolidate While MNOs Retain High-Yield Sites
Private entities controlled 59.26% of sites in 2025, capturing the majority of South Africa telecom tower market share after successive carve-outs, including Telkom’s April 2025 sale of Swiftnet for ZAR 6.75 billion (USD 370.9 million). Operator-captive assets, paradoxically, are growing at a 4.01% CAGR because MNOs keep metro locations that host multiple tenants and deliver outsized lease margins.
IHS Towers’ 2,079-site portfolio illustrates how scale unlocks diesel and battery procurement discounts that smaller rivals cannot match . Joint-venture builds remain limited to universal-service obligations in underserved provinces, offering Cell C a path to infrastructure without full capex exposure. Regulatory conditions attached to the Swiftnet transfer require non-discriminatory access, ensuring lease parity regardless of owner. With private-equity capital still chasing inflation-linked cash flows, additional carve-outs could swell private ownership to roughly two-thirds of the South Africa telecom tower market by 2031.
Geography Analysis
Gauteng accounts for the largest share of active sites and commands lease rates up to 35% above the national average because metropolitan density lifts tenancy ratios beyond 3.0. The South Africa telecom tower market size attached to Gauteng is forecast to outpace the national mean, expanding at roughly 3% CAGR as 5G densification accelerates in Johannesburg and Pretoria. Rooftop installations dominate central business districts, where building owners fast-track approvals and fiber backhaul is abundant. Crime risk remains elevated, though co-location economics continue to outweigh security surcharges.
The Western Cape follows, anchored by Cape Town’s high data consumption and strict aesthetic ordinances that favor stealth towers. Municipalities impose rigorous environmental-impact assessments, extending lead times for ground-based sites. Private towercos respond by clustering stealth monopoles on commercial rooftops along the Atlantic seaboard, a tactic that trims permitting by nearly a year. Renewable-energy adoption reaches above-average penetration because solar irradiance is higher in coastal regions, creating strong economics for hybrid systems.
KwaZulu-Natal, Eastern Cape, and Limpopo represent the fastest-growing rural corridors. Microwave backhaul rings, launched in 2025, now connect remote towns to national fiber routes and enable build-to-suit contracts with paybacks below four years. Vodacom’s ZAR 100 million (USD 6.1 million) rural program illustrates how towercos use solar-hybrid power to sidestep diesel logistics, improving uptime in areas where Eskom reliability drops below 80%. Land-claim complexity still clouds lease renewals on communal plots, pressing operators to favor rooftop or municipal-owned properties when possible.
Competitive Landscape
Roughly 10 towercos and four MNOs shape a moderately fragmented competitive field. Swiftnet, now under Actis and Royal Bafokeng ownership, ranks third by footprint and focuses on boosting tenancy ratios and rolling out 500 additional power-as-a-service systems. IHS Towers emphasizes centralized diesel procurement and predictive maintenance to trim opex by up to 20%. American Tower Corporation and SBA Communications maintain metro-centric portfolios and compete on rapid rooftop permitting rather than scale.
MNOs MTN and Vodacom still own clusters of high-tenancy urban sites, generating lease revenue that partially offsets network operating costs. Their selective retention strategy balances capital recycling with the desire to control strategic city-center nodes. Rain’s street-level small-cell rollout on lamp posts introduces a disruptive element that pressures towercos to offer flexible terms.
Technology differentiation increasingly centers on energy services. Providers that bundle solar, lithium-ion batteries, and smart inverters under service-level agreements attract MNOs wrestling with volatile diesel prices. Remote-monitoring platforms use machine learning to predict battery degradation, avoiding unscheduled outages and reducing field visits. ICASA’s mandate for non-discriminatory access limits the ability of dominant towercos to raise lease rates, although call-termination-rate reductions indirectly push MNOs to further monetize passive assets.
South Africa Telecom Tower Industry Leaders
Thabure Towerco
IHS Towers South Africa
American Tower South Africa
SBA Communications South Africa
Helios Towers SA
- *Disclaimer: Major Players sorted in no particular order

Recent Industry Developments
- January 2026: ICASA opened public consultation on draft guidelines that will allow rooftop installations to bypass environmental-impact studies if building height remains unchanged. Approval is expected by July 2026.
- June 2025: Vodacom pledged ZAR 100 million (USD 5.5 million) to build 106 rural sites in KwaZulu-Natal using microwave backhaul and solar-hybrid power. Completion is scheduled for Q4 2025.
- April 2025: An Actis-led consortium acquired Swiftnet from Telkom for ZAR 6.75 billion (USD 370.9 million), gaining more than 4,000 towers nationwide.


South Africa Telecom Tower Market Report Scope
Telecom towers encompass a variety of structures, such as monopoles, tripoles, lattice towers, guyed towers, self-supporting towers, poles, masts, and other similar forms. These towers, equipped with one or more telecommunication antennas, facilitate radio communications. They can be situated on the ground or atop a building's rooftop and often include storage for equipment and electronic components.
The South Africa Telecom Tower Market Report is Segmented by Fuel Type (Renewable, and Non-Renewable), Tower Type (Lattice Tower, Guyed Tower, Monopole Tower, and Stealth Tower), Installation (Rooftop, and Ground-based), Ownership (Operator-owned, Joint Venture, Private-owned, and MNO Captive), and Geography. The Market Forecasts are Provided in Terms of Value (USD).
| Renewable |
| Non-Renewable |
| Lattice Tower |
| Guyed Tower |
| Monopole Tower |
| Stealth Tower |
| Rooftop |
| Ground-based |
| Operator-owned |
| Joint Venture |
| Private-owned |
| MNO Captive |
| By Fuel Type | Renewable |
| Non-Renewable | |
| By Type of Tower | Lattice Tower |
| Guyed Tower | |
| Monopole Tower | |
| Stealth Tower | |
| By Installation | Rooftop |
| Ground-based | |
| By Ownership | Operator-owned |
| Joint Venture | |
| Private-owned | |
| MNO Captive |


Key Questions Answered in the Report
How large will the South Africa telecom tower market be by 2031?
The market is forecast to reach USD 543.9 million by 2031 on a 2.74% CAGR from 2026.
Why are rooftop telecom towers gaining popularity in South Africa?
Rooftop sites bypass lengthy municipal way-leave processes and leverage existing building security, cutting rollout time and lowering theft risk.
What role does renewable energy play in powering towers?
Solar-hybrid and battery systems are expanding at a 4.34% CAGR because they reduce diesel spend and improve uptime during Eskom load-shedding.
How are private-equity firms influencing the tower landscape?
Firms like Actis pay premium multiples for tower portfolios, inject capital for tenancy expansion, and centralize procurement to lift EBITDA margins.
Which factors most constrain tower deployment today?
Persistent Eskom outages, copper theft, and slow municipal approvals raise operating costs and delay new builds.
What is the typical tenancy ratio for leading towercos?
Mature metro portfolios now average between 2.6 and 3.0 tenants per site, with further upside as 5G equipment layers onto existing structures.
Page last updated on:


