Zambia Telecom MNO Market Size and Share
Market Overview
| Study Period | 2020 - 2031 |
|---|---|
| Forecast Data Period | 2026 - 2031 |
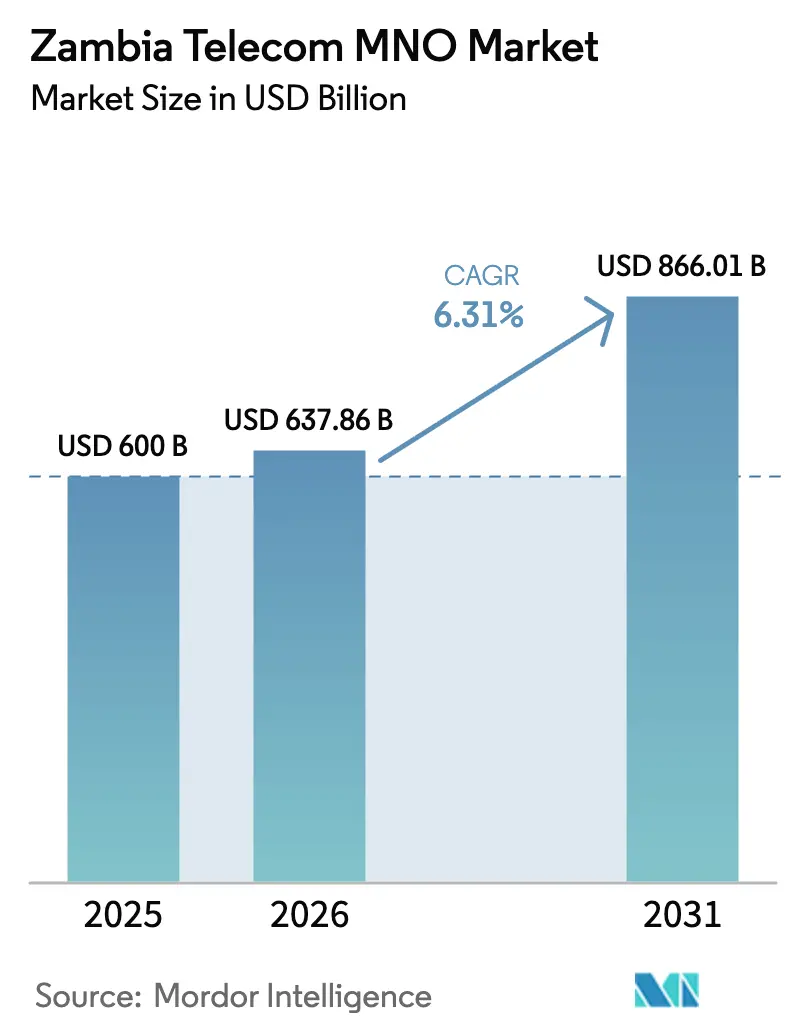
| Base Year Market Size (2025) | USD 600 Billion |
| Market Size (2026) | USD 637.86 Billion |
| Market Size (2031) | USD 866.01 Billion |
| Growth Rate (2026 - 2031) | 6.31% CAGR |
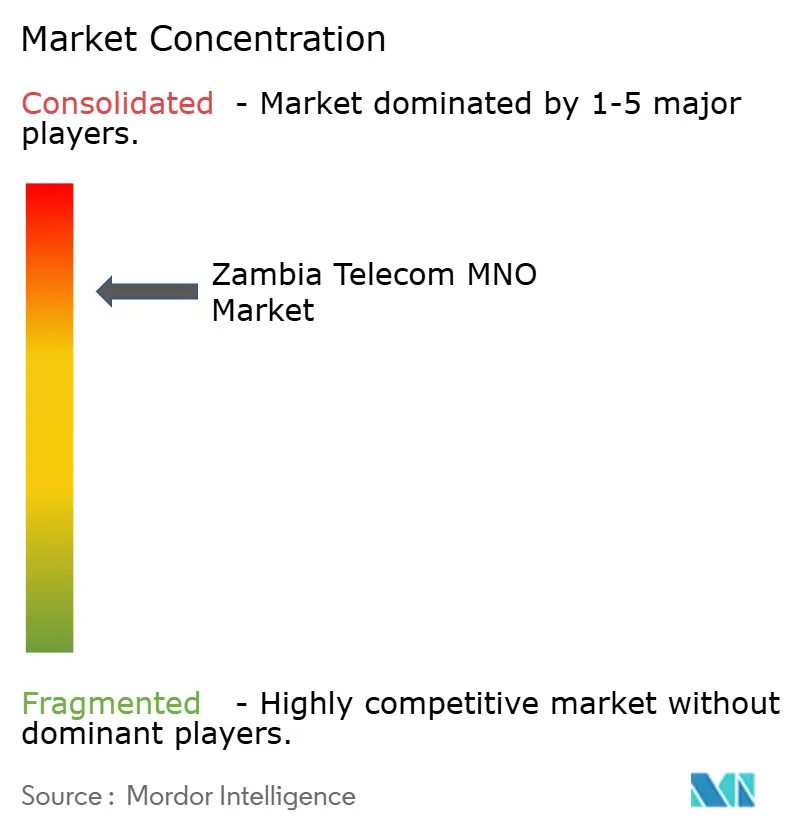
| Market Concentration | High |
Major Players *Disclaimer: Major Players sorted in no particular order Image © Mordor Intelligence. Reuse requires attribution under CC BY 4.0. | |
Zambia Telecom MNO Market Analysis by Mordor Intelligence
Zambia Telecom MNO Market size in 2026 is estimated at USD 637.86 million, growing from 2025 value of USD 600 million with 2031 projections showing USD 866.01 million, growing at 6.31% CAGR over 2026-2031.
Accelerated smartphone adoption, mobile penetration of 109.2 subscriptions per 100 inhabitants, and stepped-up public spending on ICT infrastructure keep the Zambia Telecom MNO market on a steady growth path. Operators channel capital toward 4G and 5G radio upgrades, long-haul fiber routes, and tower infill projects that enable data-centric networks. At the same time, enterprise digitization in mining, finance, and government broadens the service mix and cushions consumer price sensitivity. Macroeconomic volatility and power-supply disruptions inflate operating costs, yet regulatory programs such as the World Bank-funded Digital Zambia Acceleration Project ease spectrum access and rural-coverage economics, sustaining long-term expansion.
Key Report Takeaways
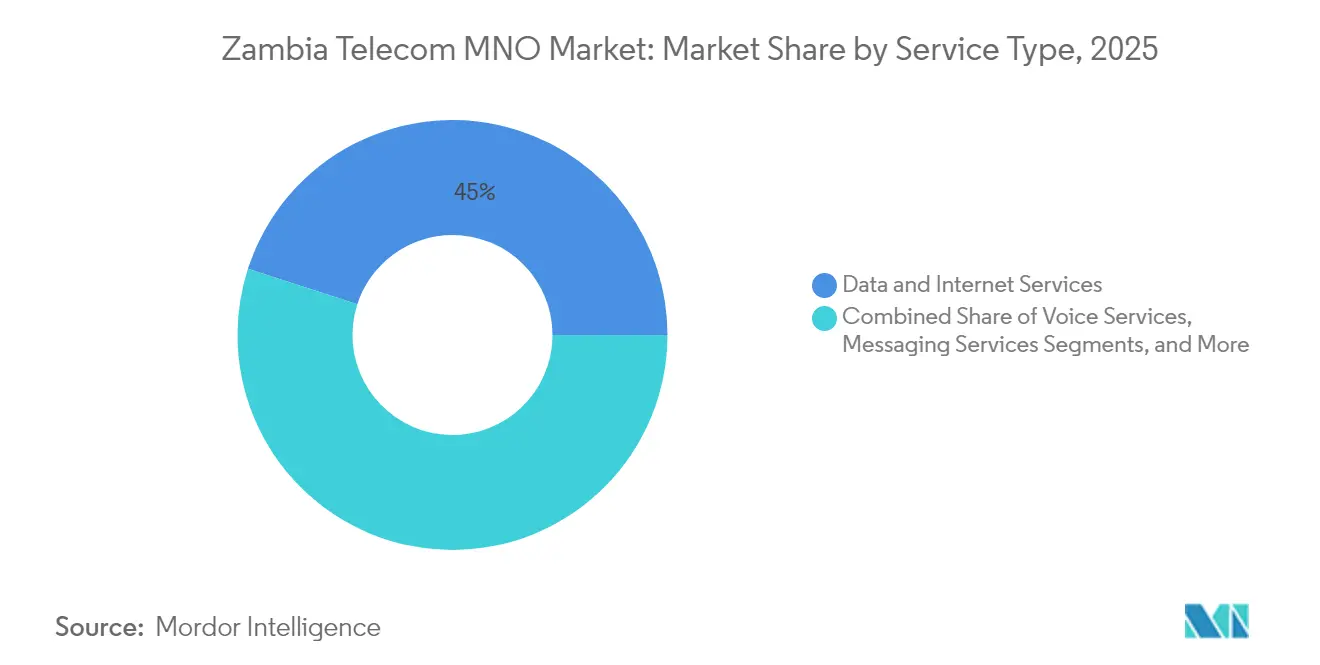
- By service type, data and internet services led with 45.02% revenue share in 2025, whereas IoT and M2M services are projected to post a 6.61% CAGR through 2031.
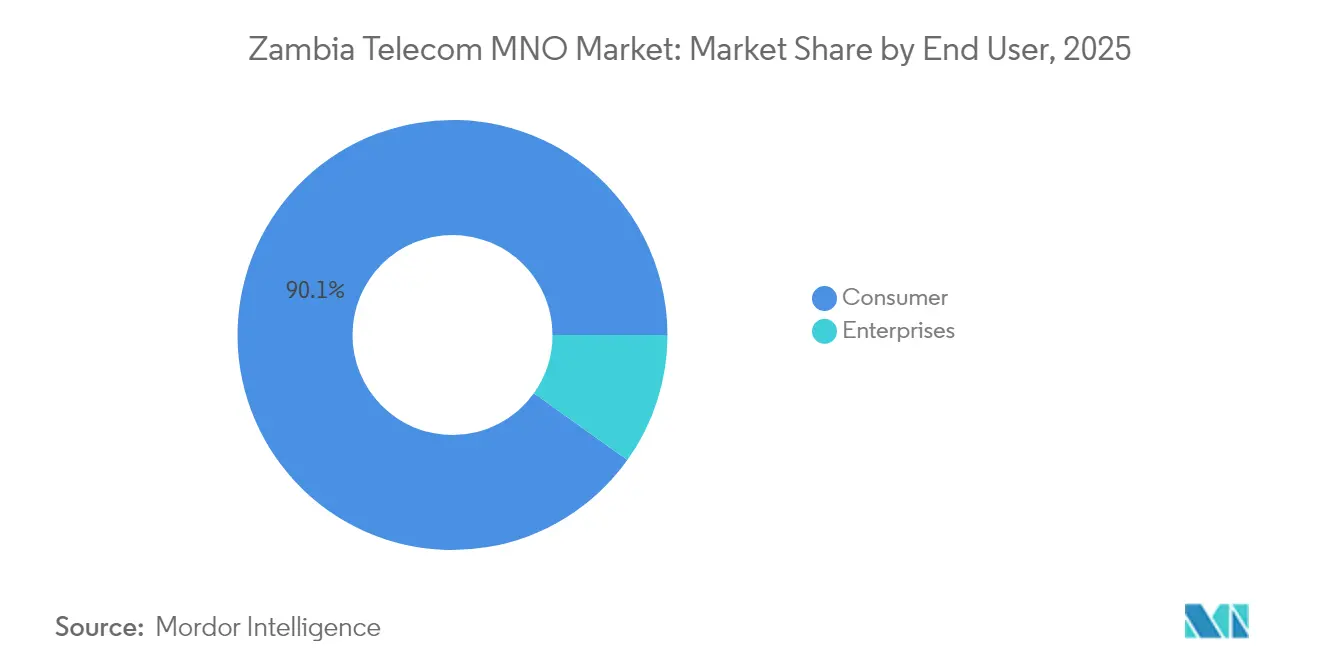
- By end user, the consumer segment held 90.12% of the Zambia Telecom MNO market share in 2025, while the enterprise segment is expected to advance at a 7.38% CAGR up to 2031.
Note: Market size and forecast figures in this report are generated using Mordor Intelligence’s proprietary estimation framework, updated with the latest available data and insights as of 2026.
Zambia Telecom MNO Market Trends and Insights
Drivers Impact Analysis*
| Driver | (~) % Impact on CAGR Forecast | Geographic Relevance | Impact Timeline |
|---|---|---|---|
| Explosive mobile-data consumption | +1.8% | Major urban clusters | Medium term (2-4 years) |
| 4G / 5G spectrum releases and roll-outs | +1.2% | Urban cores to secondary cities | Long term (≥ 4 years) |
| Enterprise digital-transformation spend | +0.9% | Mining belt, commercial hubs | Medium term (2-4 years) |
| Growing demand for mobile-money services | +1.1% | Nationwide, rising rural uptake | Short term (≤ 2 years) |
| Government ICT infrastructure push | +0.7% | Underserved districts | Long term (≥ 4 years) |
| Cross-border fiber back-haul new builds | +0.5% | Border gateways | Long term (≥ 4 years) |
| Source: Mordor Intelligence | |||
Explosive Mobile-Data Consumption
Data traffic growth outpaces voice as affordable Android devices and social-media engagement redefine usage habits. MTN Group recorded a 35.7% rise in data volumes across Africa to 9,054 petabytes in H1 2024, with Zambia contributing solid double-digit growth. [1]MTN Group, “Interim Results 2024,” mtn-investor.com Operators re-package data into micro-bundles priced in single-digit Kwacha, matching the cash-flow cadence of the informal economy. Video streaming, mobile gaming, and e-learning portals lengthen on-net time, pushing per-user megabyte consumption upward. Capacity additions now concentrate on LTE and 5G sectors, shifting capital away from legacy voice switching. This behavioral pivot compels the Zambia Telecom MNO market to front-load radio and transport investments, laying the foundation for higher-margin digital services.
4G / 5G Spectrum Releases and Roll-outs
The regulator opened contiguous mid-band blocks and rationalized fees in 2024, enabling operators to accelerate the first commercial 5G offers. MTN Zambia went live in six cities during November 2022 and targets near-complete urban coverage by mid-2025. [2]Connecting Africa, “MTN Zambia Rolls Out Commercial 5G,” connectingafrica.com Airtel followed with its own 5G launch in March 2025, intensifying competition for high-value users. Network slicing proofs-of-concept in mining and finance validate premium positioning for ultra-low-latency connections. Yet spectrum fees, site-power costs, and extensive backhaul requirements remain entry hurdles for smaller entrants, creating an implicit scale premium in the Zambia Telecom MNO market.
Enterprise Digital-Transformation Spend
Corporate demand for managed connectivity grows as mines deploy IoT sensors for real-time equipment diagnostics and environmental compliance. MTN Zambia’s “Oxygen” program integrates AI and big-data engines to deliver analytics-as-a-service, moving the operator up the value chain. [3]CIO Africa, “MTN Zambia CIO Shares Lessons from a Digital Transformation Journey,” cio.com Banking groups simultaneously insist on secure, near-instant links that undergird mobile-money clearing. Enterprise contracts carry multi-year terms and higher average revenue per connection, helping operators hedge against fragile consumer purchasing power. As a result, enterprise solutions are a pivotal leg of the Zambia Telecom MNO market growth strategy.
Growing Demand for Mobile-Money Services
Active mobile-money accounts covered 58.4% of Zambia’s adult population in 2023, handling K452 billion in transaction value and marking a 50% annual jump. [4]United Nations Development Programme, “The Role of Digital Mobile Money in Catalyzing Financial Inclusion,” undp.org Enhanced interoperability among networks lowers switching frictions and spurs merchant acceptance. Government targets 85% financial inclusion by 2028, signaling policy continuity. For operators, mobile money broadens service stickiness, supplies float income, and anchors upsell of micro-insurance and micro-credit, reinforcing the data-driven growth loop of the Zambia Telecom MNO market.
Restraints Impact Analysis*
| Restraint | (~) % Impact on CAGR Forecast | Geographic Relevance | Impact Timeline |
|---|---|---|---|
| Currency depreciation vs. capex costs | -1.4% | Nationwide | Short term (≤ 2 years) |
| High sector-specific tax burden | -0.8% | Nationwide | Medium term (2-4 years) |
| Chronic power-supply instability | -1.1% | Industrial corridors | Short term (≤ 2 years) |
| Shortage of local fiber-skills workforce | -0.6% | Urban expansion zones | Long term (≥ 4 years) |
| Source: Mordor Intelligence | |||
Currency Depreciation vs. Capex Costs
Telecom equipment is largely USD-denominated, yet revenues accrue in Kwacha, so currency swings erode purchasing power for radio kits and fiber gear. Airtel Africa’s group results showed a 9.7% drop in reported revenue despite double-digit constant-currency gains, with Zambia among the heaviest hit markets. Operators postpone non-critical upgrades, stretch vendor payment terms, or resort to costlier short-term loans. The compression of free cash flow threatens to slow rural coverage targets, dampening part of the Zambia Telecom MNO market trajectory.
Chronic Power-Supply Instability
Load-shedding episodes can last up to 21 hours, obliging operators to run diesel generators that triple site opex in affected provinces. Fuel logistics to remote towers raise security and theft risks, while voltage fluctuations shorten equipment lifespans. Power constraints limit radio-access expansions and retard quality-of-service improvements, directly suppressing the Zambia Telecom MNO market growth contribution that would otherwise spring from advanced LTE and 5G layers.
*Our forecasts treat driver/restraint impacts as directional, not additive. The impact forecasts reflect baseline growth, mix effects, and variable interactions.
Segment Analysis
By Service Type: Data-Led Revenue Transformation
Data services captured 45.02% of 2025 revenue, overtaking legacy voice streams as smartphone ownership crossed the 50% mark in metropolitan districts. The Zambia Telecom MNO market size attributable to data-centric offerings climbed 18.2% at MTN Zambia, far above the 5.4% rise in total service revenue. IoT and M2M connections, though nascent, are projected to grow at a 6.61% CAGR through 2031 as mines automate conveyor belts and trucking fleets. Operators routinely bundle zero-rated educational portals and limited-window video passes to deepen engagement and trim churn.
Voice, messaging, and value-added services remain relevant in peri-urban and rural settings, yet the revenue mix continues tilting toward data. Over-the-top calling and messaging apps shrink traditional traffic, but operators reclaim value by offering sponsored-data arrangements with content partners. The Zambia Telecom MNO market share advantage now gravitates to players able to monetize digital platforms around cloud, fintech, and content, reinforcing the strategic pivot away from time-division voice toward packet-based services.


By End User: Enterprise Upside Surges
Consumers represented 90.12% of subscriber lines in 2025, highlighting the mass-market origins of the Zambia Telecom MNO industry. However, enterprises are set for a 7.38% CAGR, exceeding the consumer growth slope. Financial institutions, agri-processors, and municipal authorities contract-managed IoT networks, MPLS, and software-defined wide-area links that command pricing premiums. Dedicated 5G slices for mining drills or real-time surveillance double the average monthly revenue per line compared with prepaid consumer packs.
Cross-selling of mobile-money bulk-payment tools strengthens enterprise relationships, while tier-1 data-center footprints allow operators to host mission-critical workloads domestically, lowering latency and regulatory exposure. This structural pivot indicates that the Zambia Telecom MNO market size allocated to enterprise services will expand steadily, cushioning operators from price wars in the prepaid consumer arena.
Geography Analysis
Lusaka, Kitwe, and Ndola cluster more than 60% of high-value data subscribers and form the nucleus of 5G roll-out plans. Urban coverage exceeds 95%, whereas remote districts average below 50%, underscoring a widening digital divide. The Copperbelt’s mining towns generate outsized enterprise traffic that feeds demand for low-latency fiber circuits. Southern and Central Provinces benefit from recent renewable energy additions that stabilize grid power, reducing generator reliance at tower sites.
National backbone projects totaling 18,000 kilometers of optical fiber cover 92% of the population, with recent cross-border builds to Malawi, Tanzania, and the Democratic Republic of Congo enlarging regional peering options. Submarine upgrades, including SEACOM’s 1.5 Tbps boost, cut IP-transit costs and raise international bandwidth headroom. Rural broadband still lags, prompting satellite entrants such as Starlink to activate services in nine provinces, thereby pressuring incumbents to match coverage and customer experience.
Government programs encompass tower subsidies, universal-service levies channeled to backhaul builds, and simplified right-of-way procedures, ultimately enlarging the addressable base of the Zambia Telecom MNO market. Public-private partnerships anchored by the World Bank target village broadband and e-government portals, offering incremental revenue layers for operators that can execute efficiently.
Competitive Landscape
The Zambia Telecom MNO market is oligopolistic, with Airtel Zambia holding about 48% of subscribers, MTN Zambia around 35%, and state-owned Zamtel the remainder. Airtel leverages deep spectrum holdings and an aggressive tower densification roadmap to defend leadership in data throughput. MTN differentiates via service innovation, evidenced by its AI contact-center agent “Call Natasha,” which slashes average call-waiting times and lifts customer-satisfaction scores.
Both incumbents extend mobile-money ecosystems into savings, loans, and insurance, generating non-telecom fee revenue and anchoring loyalty. Zamtel, despite a smaller wallet, benefits from favored access to government programs and universal-service subsidies that support tower builds in underserved chiefdoms. The 2025 entry of Zed Mobile, backed by USD 400 million in commitments, introduces fresh capital but must overcome scale disadvantages and spectrum scarcity. Rivalry thus centers on network quality, fintech breadth, and enterprise solution portfolios rather than headline tariffs, shaping the qualitative contours of the Zambia Telecom MNO market.
Zambia Telecom MNO Industry Leaders
MTN Zambia
Airtel Zambia
Zamtel
- *Disclaimer: Major Players sorted in no particular order

Recent Industry Developments
- February 2025: MTN Zambia introduced “Call Natasha,” an AI-powered customer-service agent that automates routine inquiries and shortens response times.
- August 2024: Zambia completed a USD 14 million ground-receiving station for its inaugural earth-observation satellite, setting the stage for enhanced climate-monitoring and connectivity applications.


Zambia Telecom MNO Market Report Scope
| Voice Services |
| Data and Internet Services |
| Messaging Services |
| IoT and M2M Services |
| OTT and PayTV Services |
| Other Services (VAS, Roaming and International Services, Enterprise and Wholesale Services, etc.) |
| Enterprises |
| Consumer |
| Service Type | Voice Services |
| Data and Internet Services | |
| Messaging Services | |
| IoT and M2M Services | |
| OTT and PayTV Services | |
| Other Services (VAS, Roaming and International Services, Enterprise and Wholesale Services, etc.) | |
| End-user | Enterprises |
| Consumer |


Key Questions Answered in the Report
How large is the Zambia Telecom MNO Market in 2026?
The Zambia Telecom MNO Market size is USD 637.86 million in 2026 and is projected to reach USD 866.01 million by 2031.
What is the expected growth rate for Zambia’s mobile network operators until 2031?
Aggregate revenue is forecast to compound at 6.31% annually through 2031.
Which service category leads operator revenue in Zambia?
Data and internet services hold the highest share at 45.02% of 2025 revenue.
Why are enterprises becoming a priority customer group?
Enterprise demand for managed IoT, cloud connectivity, and dedicated 5G slices is growing at a 7.38% CAGR, outpacing consumer lines and raising margins.
What are the biggest challenges facing Zambian operators?
Currency depreciation that inflates capex, persistent power outages, and sector-specific taxes weigh on profitability and investment cycles.
How is 5G deployment progressing in Zambia?
MTN Zambia launched 5G commercially in late 2022 and plans near-total urban coverage in 2025, with Airtel following in March 2025.
Page last updated on:


