Africa Telecom Towers And Allied Market Size and Share
Market Overview
| Study Period | 2020 - 2031 |
|---|---|
| Forecast Data Period | 2026 - 2031 |
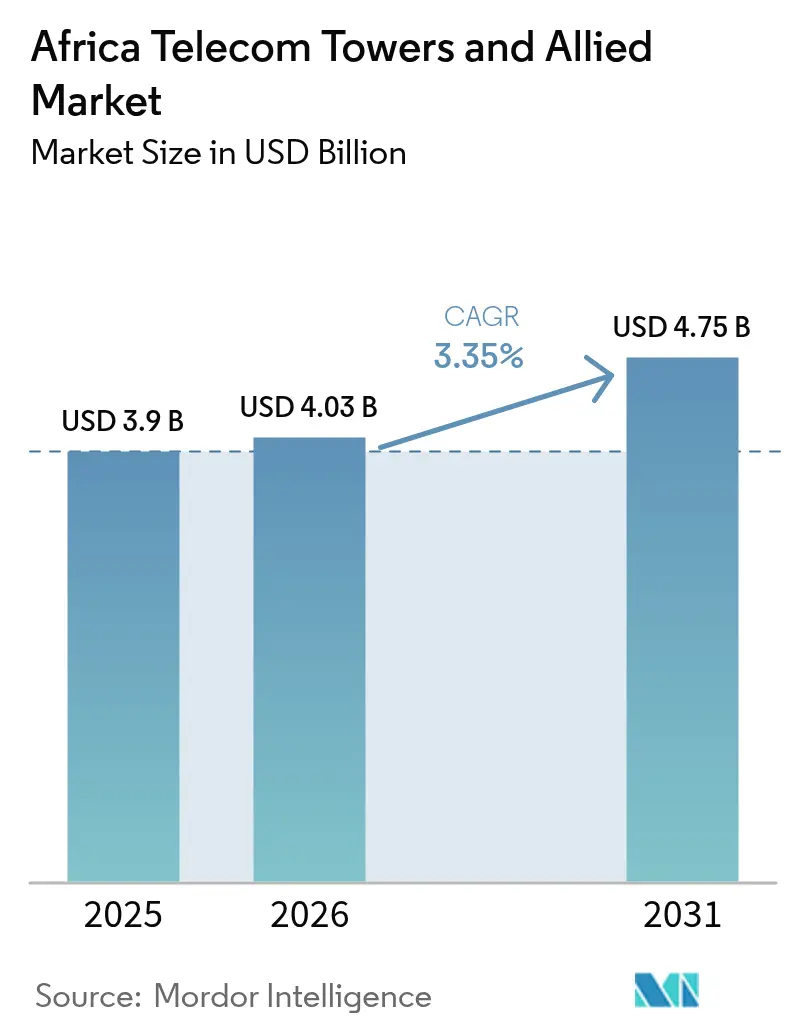
| Base Year Market Size (2025) | USD 3.9 Billion |
| Market Size (2026) | USD 4.03 Billion |
| Market Size (2031) | USD 4.75 Billion |
| Growth Rate (2026 - 2031) | 3.35% CAGR |
| Market Concentration | Medium |
Major Players *Disclaimer: Major Players sorted in no particular order Image © Mordor Intelligence. Reuse requires attribution under CC BY 4.0. | |
Africa Telecom Towers And Allied Market Analysis by Mordor Intelligence
The Africa Telecom Towers And Allied Market size in 2026 is estimated at USD 4.03 billion, growing from 2025 value of USD 3.9 billion with 2031 projections showing USD 4.75 billion, growing at 3.35% CAGR over 2026-2031.
Accelerated 4G and newly launched 5G rollouts, rising data consumption, and government-backed rural coverage mandates underpin this steady expansion. Independent TowerCos continue to win large multi-year outsourcing contracts from pan-African mobile network operators, a trend that lifts tenancy ratios and improves operating cash flows. Renewable-powered systems are gaining momentum as green financing incentives offset the volatility of diesel fuel costs. Meanwhile, country-specific programs, such as Algeria’s fiber-to-the-home build-out and Kenya’s digital-economy blueprint, add geographic depth to overall demand for ground-based and rooftop sites across the Africa telecom tower market.
Key Report Takeaways
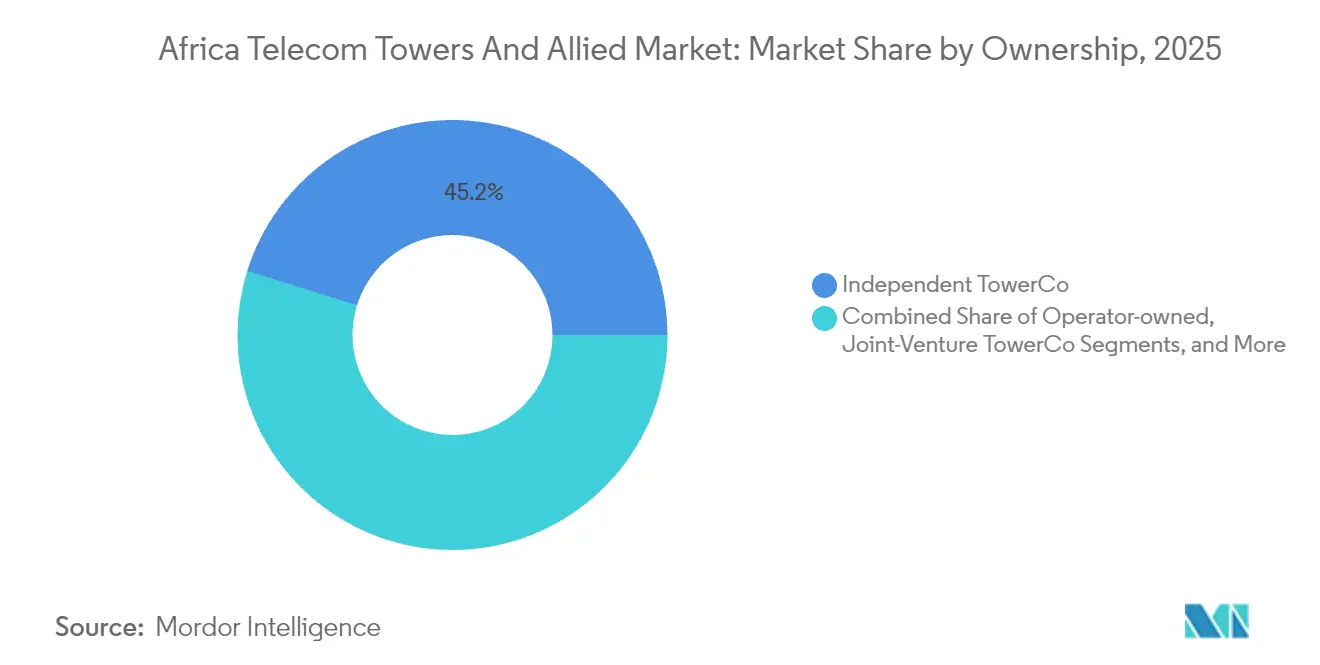
- By ownership, independent TowerCos held 45.18% of the Africa telecom tower market share in 2025 and are advancing at a 6.53% CAGR through 2031.
- By installation, ground-based towers accounted for 76.20% of the Africa telecom tower market size in 2025, while rooftop sites represent the fastest-growing segment with a 7.34% CAGR to 2031.
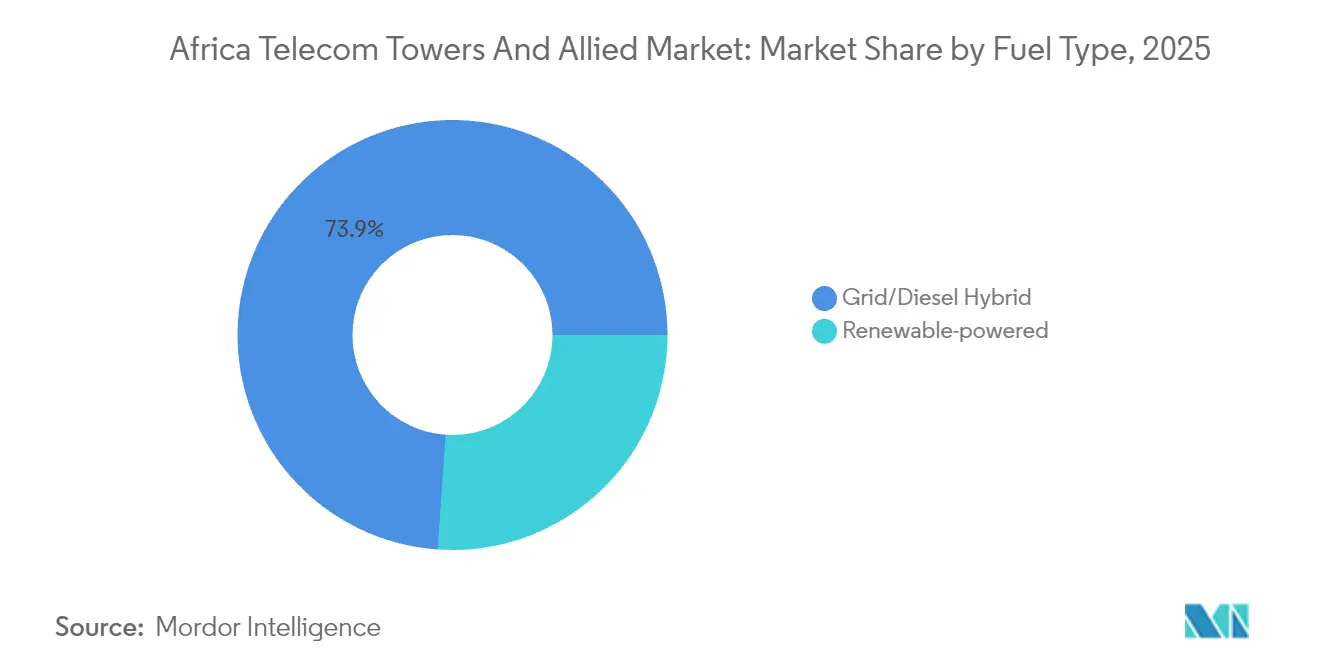
- By fuel type, grid/diesel hybrid systems dominated with 73.90% of the Africa telecom tower market share in 2025; renewable-powered sites are expanding at 11.68% CAGR to 2031.
- By tower type, monopole structures captured 36.40% share of the Africa telecom tower market size in 2025, whereas stealth and concealed designs exhibit the highest 9.46% CAGR to 2031.
- By country, Algeria led with 49.30% Africa telecom tower market share in 2025; Kenya shows the strongest 5.03% growth trajectory through 2031.
Note: Market size and forecast figures in this report are generated using Mordor Intelligence’s proprietary estimation framework, updated with the latest available data and insights as of 2026.
Africa Telecom Towers And Allied Market Trends and Insights
Drivers Impact Analysis*
| Driver | (~) % Impact on CAGR Forecast | Geographic Relevance | Impact Timeline |
|---|---|---|---|
| Accelerated 4G/5G rollout by pan-African MNOs | +1.2% | Global, with concentration in Nigeria, South Africa, Kenya | Medium term (2-4 years) |
| Rising data consumption and smartphone penetration | +0.9% | Global, with highest impact in North and West Africa | Long term (≥ 4 years) |
| Government-led rural coverage mandates and universal service funds | +0.7% | Sub-Saharan Africa, particularly Kenya, Tanzania, Ghana | Medium term (2-4 years) |
| Asset-light network strategies by MNOs boosting tower outsourcing | +1.1% | Global, with early adoption in Nigeria, Morocco, Algeria | Short term (≤ 2 years) |
| Green financing incentives for renewable power retrofits | +0.4% | Global, with focus on off-grid sites across rural Africa | Long term (≥ 4 years) |
| Expansion of neutral-host indoor DAS and small-cell backhaul demand | +0.3% | Urban centers in Algeria, Nigeria, South Africa, Morocco | Medium term (2-4 years) |
| Source: Mordor Intelligence | |||
Accelerated 4G/5G rollout by pan-African MNOs
Pan-African mobile network operators added hundreds of 5G sites in 2024 and early 2025, lifting total 5G subscriptions in Sub-Saharan Africa toward Ericsson’s 420 million projection for 2030 [1]Ericsson, “Mobility Report June 2025,” ericsson.com. MTN Group alone expanded its 5G footprint to more than 3,000 sites, prompting a surge in colocation requests across the Africa telecom tower market [2]MTN Group, “Integrated Report 2024,” mtn.com. The densification imperative is especially acute in Lagos, Nairobi, and Johannesburg, where 5G mid-band spectrum requires closer site spacing. Independent TowerCos capitalize on this urgency by offering turnkey build-to-suit programs that shorten time-to-market for operators migrating from legacy 4G networks. The momentum is reinforced by the recent commercial 5G launch in Tunisia, underscoring the broad regional commitment to next-generation connectivity [3]Tunisia Telecom, “5G Commercial Launch,” tunisietelecom.tn.
Rising data consumption and smartphone penetration
Video streaming, social media, and mobile payments are elevating per-subscriber data use into double-digit gigabyte ranges across North and West Africa. Young demographics and low-cost smartphone imports sustain this demand curve, compelling operators to add capacity faster than originally budgeted. Higher data volumes translate into larger leaseable antenna counts per site, pushing tenancy ratios across the Africa telecom tower market from 1.5x toward 2x in core metros. TowerCos are therefore incentivized to future-proof structures with stronger load capacities and fiber-ready backhaul, ensuring revenue upside as data-heavy services proliferate.
Government-led rural coverage mandates and universal service funds
Kenya, Tanzania, and Ghana channel universal service funds into new tower builds in hard-to-reach areas, guaranteeing baseline tenancy and 10-year lease commitments for TowerCos. Nigeria’s approval for 7,000 additional towers highlights the scope of public-sector intervention aimed at closing the digital divide. Because these mandates often stipulate minimum coverage ratios and performance KPIs, TowerCos secure predictable cash flows that de-risk greenfield investments. Rural subsidies also accelerate the adoption of solar-hybrid power systems, a shift that further differentiates the Africa telecom tower market from more mature regions.
Asset-light network strategies by MNOs boosting tower outsourcing
IHS Towers’ decade-long renewal with MTN Nigeria covering roughly 13,500 tenancies showcases the stickiness of the sale-leaseback model. Operator balance sheets benefit from an immediate capital infusion, while TowerCos unlock recurring revenue through multi-tenant leasing. Joint-venture structures, such as the new Maroc Telecom-inwi vehicle targeting 2,000 towers, illustrate how competitors can share passive infrastructure yet preserve brand-level differentiation in active radio assets. This outsourcing momentum is expected to boost the Africa telecom tower market well into the next decade.
Restraints Impact Analysis*
| Restraint | (~) % Impact on CAGR Forecast | Geographic Relevance | Impact Timeline |
|---|---|---|---|
| Volatile foreign-exchange and high sovereign risk | -0.8% | Global, with highest impact in Nigeria, Ghana, Egypt | Short term (≤ 2 years) |
| Lengthy permitting and land-acquisition bottlenecks | -0.6% | Global, with severe constraints in Algeria, Morocco, South Africa | Medium term (2-4 years) |
| Diesel supply disruptions raising opex at off-grid sites | -0.4% | Rural areas across Sub-Saharan Africa | Short term (≤ 2 years) |
| Fiber backhaul deficits limiting tenancy ratios in secondary cities | -0.5% | Secondary cities across West and East Africa | Long term (≥ 4 years) |
| Source: Mordor Intelligence | |||
Volatile foreign-exchange and high sovereign risk
Revenue is largely denominated in local currencies, but debt and capex remain USD-linked, exposing TowerCos to material conversion losses during currency depreciations. IHS Towers reported notable FX headwinds in several African markets during 2024, underscoring sensitivity to macroeconomic cycles. Sovereign credit downgrades trigger higher interest rates that can render new builds unviable or slow refinancing efforts. Operators and TowerCos are increasingly exploring natural hedges such as USD-indexed lease escalators, but uptake remains limited by regulatory caps on foreign-currency billing.
Lengthy permitting and land-acquisition bottlenecks
Environmental clearances, zoning approvals, and community consultations can extend site rollout timelines from 3 months to more than 18 months, especially in dense urban cores. The African Development Bank notes that these procedural delays inflate project costs and reduce investor returns across the continent. As 5G pushes coverage deeper into city centers, administrative complexity becomes an even bigger drag on the Africa telecom tower market growth. Streamlined one-stop permitting windows are emerging in Morocco and South Africa, but have yet to reach scale across the region.
*Our forecasts treat driver/restraint impacts as directional, not additive. The impact forecasts reflect baseline growth, mix effects, and variable interactions.
Segment Analysis
By Ownership: Multi-tenant scale widens Independent TowerCo lead
Independent TowerCos commanded 45.18% of the Africa telecom tower market share in 2025 and are on track for a 6.53% CAGR through 2031. The superior returns stem from 92.4% utilization rates and diversified country portfolios that smooth FX and regulatory risk. Operator-owned assets persist in markets with infrastructure-sharing constraints, but monetization pressure is rising as balance-sheet light strategies take hold. The Africa telecom tower market size for Independent TowerCos could exceed USD 2.07 billion in annual lease revenue by 2031 if current divestiture pipelines close on schedule.
MNO captive sites remain critical in politically sensitive geographies where network control is paramount; however, cash-strapped operators increasingly favor sale-leasebacks to fund 5G spectrum fees. Joint-venture TowerCos offer a middle path, letting rivals co-invest in passive plant without sacrificing active-layer differentiation. American Tower’s selective entry strategy validates the margin advantage enjoyed by global specialists in complex metros, a dynamic likely to accelerate consolidation across the Africa telecom tower industry.


By Installation: Rooftops race ahead inside land-constrained metros
Ground-based towers held 76.20% of the Africa telecom tower market size in 2025, proving cost-effective for suburban and rural macro coverage. Rooftop installations, though smaller in absolute footprint, are gaining a 7.34% CAGR as 5G mid-band frequencies demand tighter grid spacing in densely populated business districts. Municipal aesthetic guidelines and mounting land prices make rooftops the only viable option in central Nairobi, Casablanca, and Johannesburg.
Ground-based towers still deliver higher absolute revenue per site thanks to greater antenna load capacity and ease of renewable-power retrofits. Yet rooftops promise faster permitting and reduced civil works expenditure, allowing TowerCos to capture incremental revenue within established coverage zones. This nuanced mix of site types ensures the Africa telecom tower market remains flexible as data-traffic patterns evolve.
By Fuel Type: Solar-hybrid economics eclipse diesel volatility
Grid/diesel hybrids controlled 73.90% of the Africa telecom tower market share in 2025, but renewable-powered systems are expanding at a 11.68% CAGR, buoyed by falling photovoltaic costs and green-bond financing. GreenWish Partners earmarked USD 800 million for solar-powered towers, spotlighting the commercial viability of renewables in off-grid areas. The Africa telecom tower market size tied to renewable-powered sites could top USD 694 million by 2031 if current retrofit targets are met.
Diesel logistics account for up to 40% of opex at remote sites, a figure that renewable systems can cut in half once battery storage is amortized. IHS Towers’ Project Green saved USD 49 million annually, strengthening the business case for aggressive renewable adoption. Solar-hybrid systems also improve uptime, a key KPI in service-level agreements with MNOs.
By Tower Type: Stealth designs satisfy urban regulators
Monopoles captured 36.40% of the Africa telecom tower market share in 2025, favored for their balance between cost efficiency and structural strength. The Africa telecom tower market size, attributable to stealth or concealed designs, while small today, is climbing at a 9.46% CAGR as municipalities impose visual-impact caps on new towers. Lattice and guyed structures remain indispensable for heavy-load rural sites, but their share is declining because urban densification now drives incremental demand.
Stealth installs cost up to 25% more than standard monopoles, yet TowerCos often recoup the premium via higher rents from multiple tenants eager to secure downtown coverage. New composite materials and integrated antenna shrouds are cutting installation times, thus mitigating the added capex burden.
Geography Analysis
North Africa benefits from clear policy frameworks that prioritize telecom infrastructure as an economic enabler. Algeria’s leadership with 49.30% market share is anchored in state-backed fiber programs that lower backhaul costs and elevate tower economics. Morocco’s strategy to reach 5.6 million fiber households by 2030 and Tunisia’s national 5G launch in 2025 further underscore the region’s forward-leaning stance.
West Africa exhibits scale-driven dynamics, with Nigeria’s 7,000-tower expansion underscoring the sheer volume required to serve the continent’s largest population. Ghana’s regulatory stability attracts regional TowerCos, whereas Côte d’Ivoire leverages infrastructure-sharing rules to accelerate rural coverage. Currency volatility and inconsistent grid power remain common hurdles across the sub-region.
East Africa combines innovation with rapid adoption. Kenya’s 5.03% CAGR stands out amid regional peers, propelled by mobile money ecosystems that demand low-latency coverage. Tanzania’s universal-service incentives guarantee tenancy for new rural sites, while Uganda and Rwanda represent sizeable white-space potential once financing hurdles ease.
Competitive Landscape
Three international TowerCos, IHS Towers, American Tower, and Helios Towers, collectively control a significant share of tenable sites across the Africa telecom tower market. IHS Towers leads with 39,229 global towers, achieving 92.4% utilization that outperforms regional averages. American Tower channels more than USD 350 million into renewable upgrades across its African portfolio, using sustainability as a competitive lever. Helios Towers posts a 2.05x tenancy ratio across 14,325 sites, illustrating how operational focus can offset smaller scale.
Competition is shifting from build-volume races toward tenancy-ratio optimization and service-quality differentiation. AI-based energy management, predictive maintenance, and digital customer portals are becoming must-have capabilities. Smaller regional players may become acquisition targets as they struggle to match the financing clout and technology stack of the top three. Nevertheless, white-space in secondary cities and off-grid corridors still provides room for nimble local operators that possess superior site-acquisition networks.
Africa Telecom Towers And Allied Industry Leaders
American Tower Corporation
IHS Towers (IHS Holding Limited)
Helios Towers Plc
SBA Communications Corporation
Pan African Towers
- *Disclaimer: Major Players sorted in no particular order

Recent Industry Developments
- March 2025: Maroc Telecom and inwi formed a joint-venture TowerCo aiming to roll out 2,000 sites within three years.
- March 2025: Nigeria’s federal government approved construction of 7,000 new towers under a rural-coverage mandate.
- February 2025: Tunisia launched commercial 5G services nationwide, pairing coverage goals with infrastructure-sharing regulations to jump-start additional tower demand.
- December 2024: IHS Towers exited Kuwait for USD 230 million, reallocating capital toward higher-growth African markets.
- August 2024: IHS Towers extended its MTN Nigeria master lease through 2032, securing roughly 13,500 tenancies.


Africa Telecom Towers And Allied Market Report Scope
The Telecom Towers market study tracks the installed base of telecom towers across Africa. The study provides a market breakdown by fuel type, ownership, and region. Market dynamics, market attractiveness, and key developments are covered as part of the study. The scope of the study has been segmented based on the ownership (operator-owned, joint venture, private-owned, and MNO captive) and fuel type (renewable and non-renewable) across Africa.
The Telecom Power market study tracks the revenue opportunity for power suppliers in Africa. : The scope of the study has been segmented based on utility billing (generation and distribution) and generation source (renewable, hydro, and other generation sources) across Africa.
The Africa Telecom Towers and Allied Market is segmented by Telecom Tower Market (ownership (operator owned, joint venture, private owned, MNO captive), by fuel type (renewable, non-renewable), by country (Algeria, Nigeria, South Africa, Tanzania, Morocco, Rest of Africa)), by Africa power market (type [generation, distribution], by generation source (renewable, hydro), by country (installed capacity in GW) (Algeria, Nigeria, South Africa, Tanzania, Morocco, Rest of Africa)). The market sizes and forecasts are provided in terms of Units and Electricity Installed Capacity (MW) for Telecom Tower segments and Power Segments, respectively.
| Operator-owned |
| Independent TowerCo |
| Joint-Venture TowerCo |
| MNO Captive |
| Rooftop |
| Ground-based |
| Renewable-powered |
| Grid/Diesel Hybrid |
| Monopole |
| Lattice |
| Guyed |
| Stealth / Concealed |
| Algeria |
| Kenya |
| Morocco |
| South Africa |
| Nigeria |
| Ghana |
| Egypt |
| Tanzania |
| Rest of Africa (Tunisia, Uganda, Zambia, Senegal, and Others) |
| By Ownership | Operator-owned |
| Independent TowerCo | |
| Joint-Venture TowerCo | |
| MNO Captive | |
| By Installation | Rooftop |
| Ground-based | |
| By Fuel Type | Renewable-powered |
| Grid/Diesel Hybrid | |
| By Tower Type | Monopole |
| Lattice | |
| Guyed | |
| Stealth / Concealed | |
| By Country | Algeria |
| Kenya | |
| Morocco | |
| South Africa | |
| Nigeria | |
| Ghana | |
| Egypt | |
| Tanzania | |
| Rest of Africa (Tunisia, Uganda, Zambia, Senegal, and Others) |


Key Questions Answered in the Report
What is the current value of the Africa telecom tower market?
The sector is valued at USD 4.03 billion in 2026 and is forecast to reach USD 4.75 billion by 2031.
Which ownership model dominates the continent’s tower landscape?
Independent TowerCos lead, holding 45.18% share and growing at the fastest 6.53% CAGR through 2031.
Why are renewable-powered tower sites gaining traction?
Solar-hybrid systems cut diesel opex and tap green financing, producing a segment CAGR of 11.68%.
Which country shows the highest growth momentum?
Kenya posts a 5.03% CAGR, driven by Safaricom’s network upgrades and a supportive digital-economy plan.
How are foreign-exchange risks managed by tower operators?
Leading TowerCos use partial USD-indexed lease escalators and natural hedges, though FX volatility still trims forecast CAGR by 0.8%.
What strategic moves stand out among market leaders?
IHS Towers’ 13,500‐tenancy renewal with MTN Nigeria and American Tower’s USD 350 million renewable program underscore a pivot toward long-term contracts and sustainability.
Page last updated on:


