Wind & Solar Blade Inspection NDT Market Size and Share
Market Overview
| Study Period | 2019 - 2030 |
|---|---|
| Market Size (2025) | USD 0.65 Billion |
| Market Size (2030) | USD 1.23 Billion |
| Growth Rate (2025 - 2030) | 13.61% CAGR |
| Fastest Growing Market | Asia Pacific |
| Largest Market | Asia Pacific |
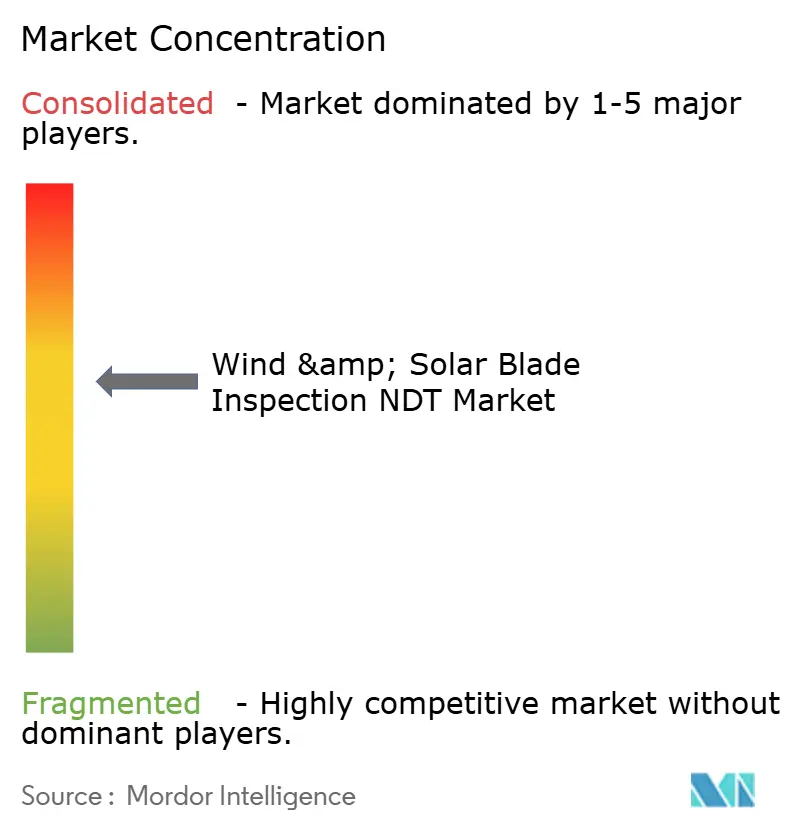
| Market Concentration | Medium |
Major Players *Disclaimer: Major Players sorted in no particular order Image © Mordor Intelligence. Reuse requires attribution under CC BY 4.0. | |

Wind & Solar Blade Inspection NDT Market Analysis by Mordor Intelligence
The wind and solar blade inspection NDT market size reached USD 650 million in 2025 and is forecast to attain USD 1.23 billion by 2030, advancing at a 13.61% CAGR through the period. The expansion reflects the confluence of aging renewable assets, mandatory integrity audits, and rapid progress in autonomous inspection technology. Drone‐based platforms that combine ultrasonic, thermal, and visual sensors shorten inspection cycles, lowering downtime and maintenance costs for operators. In parallel, the deployment of offshore wind and concentrated solar power expands the addressable installed base, particularly in the Asia-Pacific region. Larger service providers are acquiring niche robotics firms to deliver turnkey predictive maintenance solutions, while insurers prefer contracts that demonstrate measurable reductions in risk. Regulatory directives in the European Union and the United States now require certified multi-technique blade audits, accelerating the adoption of standardized digital reporting solutions.
Key Report Takeaways
- By inspection technique, ultrasonic testing led the wind and solar blade inspection NDT market, with a 42.5% revenue share in 2024. Meanwhile, acoustic emission testing is projected to expand at a 15.5% CAGR through 2030.
- By inspection platform, drone-based systems are expected to capture a 51.6% share of the wind and solar blade inspection NDT market size in 2024; embedded sensor networks are forecasted to record the highest CAGR of 18.2% through 2030.
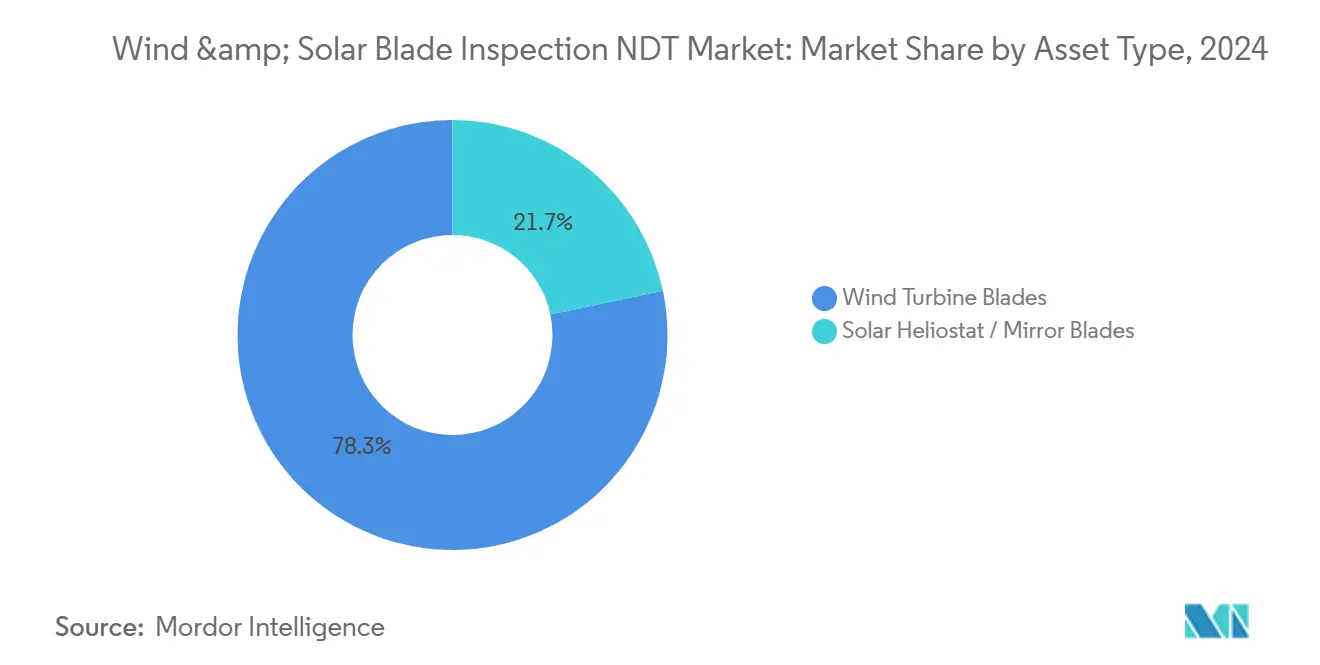
- By asset type, wind turbine blades accounted for 78.3% of the wind and solar blade inspection NDT market share in 2024; however, solar heliostat and mirror blades are projected to advance at a 15.1% CAGR through 2030.
- By application, onshore wind held a 62.4% share in 2024, whereas offshore wind is expected to grow at a 19.2% CAGR through 2030.
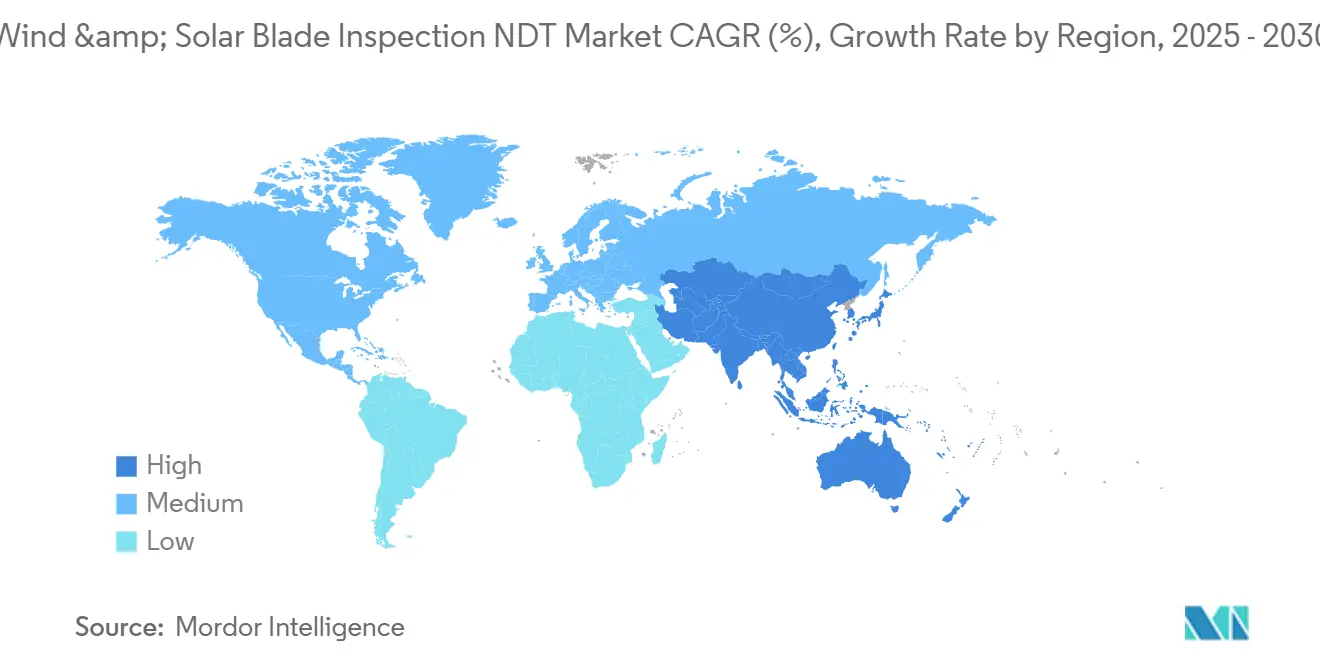
- By geography, the Asia-Pacific region accounted for a 38.7% share in 2024 and is projected to post the fastest regional CAGR of 15.3% from 2024 to 2030.
Global Wind & Solar Blade Inspection NDT Market Trends and Insights
Drivers Impact Analysis*
| Driver | (~) % Impact on CAGR Forecast | Geographic Relevance | Impact Timeline |
|---|---|---|---|
| AI-enabled multi-sensor drones cut inspection time by 70% | +2.8% | Global, with early adoption in North America and Europe | Short term (≤ 2 years) |
| Offshore wind turbine boom drives demand for remote NDT | +3.2% | Europe and Asia-Pacific coastal regions, expanding to North America | Medium term (2-4 years) |
| Mandatory blade integrity audits in the EU and the US from 2025 | +2.1% | North America and Europe, with spillover to other regions | Short term (≤ 2 years) |
| Aging on-shore fleets (>15 years) require frequent NDT | +2.9% | Global, concentrated in early wind adoption regions | Long term (≥ 4 years) |
| Solar heliostat composites shift to lightweight CFRP | +1.4% | Middle East and Africa, expanding to Asia-Pacific | Medium term (2-4 years) |
| Insurance-linked performance contracts favor predictive NDT | +1.7% | Global, with emphasis on mature renewable markets | Medium term (2-4 years) |
| Source: Mordor Intelligence | |||
AI-Enabled Multi-Sensor Drones Cut Inspection Time by 70%
Autonomous drones fitted with ultrasonic transducers, thermal imagers, and high-resolution cameras now complete comprehensive blade assessments in a single flight, reducing task duration from days to hours. Machine-learning algorithms trained on extensive defect libraries flag anomalies in real-time, enabling the immediate generation of work orders and sparing operators from lengthy post-processing.[1]Company Press Release, “AI-Enabled Drone Inspection Reduces Time by 72%,” skyspecs.com The Federal Aviation Administration’s Part 107 framework enables beyond-visual-line-of-sight missions, broadening the adoption of drones across U.S. wind farms. Similar policy clarity in Europe accelerates the uptake of offshore arrays, where vessel access is costly. Lower labor exposure and faster data delivery translate into quantifiable production-loss avoidance, reinforcing the technology’s ROI narrative with insurers and asset managers.
Offshore Wind Turbine Boom Drives Demand for Remote NDT
Europe added 3.8 GW of offshore capacity in 2024, and planned projects top 25 GW for 2030, magnifying the need for remote, weather-resilient inspections. Salt-laden air, wave loading, and constrained vessel schedules limit the feasibility of rope access, steering owners toward drones, climber robots, and embedded sensors that operate without manned intervention. IEC 61400-25 communications revisions embed continuous blade health data streams into turbine SCADA systems, allowing onshore engineers to verify integrity remotely.[2]International Electrotechnical Commission, “IEC 61400-25 Update,” iec.ch Suppliers that can certify hardware for marine corrosion and high-wind operation gain a clear competitive edge.
Mandatory Blade Integrity Audits in EU and US from 2025
The European Renewable Energy Directive and U.S. Department of Energy guidelines require operators to conduct periodic, multi-technique blade inspections once turbines have been in service for 10 years. Compliance requires documented evidence from ultrasonic, thermographic, or acoustic emission tests, rather than relying solely on visual checks, which boosts demand for accredited laboratories and certified technicians. Providers with ISO 17025 accreditation and digital traceability platforms are favored, while smaller firms face higher barriers to entry and certification costs.
Aging On-Shore Fleets (>15 Years) Require Frequent NDT
Roughly 40% of global onshore turbines are expected to exceed 15 years of operation by 2025, a cohort that is projected to have a 23% higher incidence of blade failure.[3]International Renewable Energy Agency, “Wind Turbine Aging Report,” irena.org Increased delamination and crack propagation necessitate shorter inspection intervals and advanced detection modalities such as phased-array ultrasonics. Insurers now adjust premiums according to documented inspection cadences and predictive analytics programs, incentivizing asset owners to invest in continuous condition monitoring rather than time-based schedules.
Restraints Impact Analysis*
| Restraint | (~) % Impact on CAGR Forecast | Geographic Relevance | Impact Timeline |
|---|---|---|---|
| Harsh-weather autonomy limits for drones and climber robots | -1.8% | Global, particularly severe in offshore and high-altitude installations | Short term (≤ 2 years) |
| Skilled NDT inspector shortage in emerging markets | -1.3% | Asia-Pacific emerging markets, Latin America, and Africa | Medium term (2-4 years) |
| Fragmented drone-flight rules raise compliance costs | -0.9% | Global, with particular complexity in Europe and the Asia-Pacific | Short term (≤ 2 years) |
| High upfront capex for ultrasonic / shearography payloads | -1.1% | Global, affecting smaller inspection service providers | Medium term (2-4 years) |
| Source: Mordor Intelligence | |||
Harsh-Weather Autonomy Limits for Drones and Climber Robots
Standard inspection UAVs are cleared for winds up to 20 m/s, yet offshore turbines frequently exceed that threshold, curbing available flight windows. The European Center for Medium-Range Weather Forecasts recorded an 18% reduction in suitable weather days in 2024, which is expected to prolong maintenance cycles.[4]European Center for Medium-Range Weather Forecasts, “Weather Impact on Offshore Wind,” ecmwf.int Developers are investing in higher-thrust propulsion, ice-resistant airframes, and adaptive flight controls, but the engineering challenge raises R&D costs and delays commercialization.
Skilled NDT Inspector Shortage in Emerging Markets
Certification pipelines produce 8% more inspectors per year, lagging the 15-20% growth in renewable capacity across emerging economies. While AI analytics reduce the reliance on subject matter in data interpretation, regulations still require human sign-off. Training centers and joint industry programs are expanding, yet the gap persists, limiting the scalability of services in high-growth regions.
*Our forecasts treat driver/restraint impacts as directional, not additive. The impact forecasts reflect baseline growth, mix effects, and variable interactions.
Segment Analysis
By Inspection Technique: Ultrasonic Testing Anchors Market Leadership
Ultrasonic testing accounted for 42.5% of 2024 revenue, owing to its proven capability to reveal internal delamination and bond-line defects that are imperceptible to surface scans, thereby satisfying insurers’ evidence thresholds. The wind and solar blade inspection NDT market size tied to ultrasonic solutions is projected to extend steadily through 2030 as phased-array probes and automated scanners increase coverage speed and resolution. Acoustic emission testing, although smaller today, is poised for the highest 15.5% CAGR because it detects active crack propagation during turbine operation, enabling early intervention and reducing the risk of catastrophic failure. Infrared thermography and AI-enhanced visual methods serve complementary roles in surface anomaly screening and electrical hot-spot detection, while shearography remains a niche application, primarily used in controlled factory environments for debonding verification. Standardization, as outlined in ISO 17025, continues to harmonize quality benchmarks, thereby reinforcing customer confidence in test outcomes.
Between 2025 and 2030, vendors are integrating multiple modalities into single payloads to streamline workflows. Software platforms integrate data layers, creating a consolidated defect map that directly feeds into enterprise asset management systems. This convergence lowers interpretation errors and positions multi-technique providers to capture larger service contracts. As regulatory bodies increasingly stipulate the use of at least two independent methods per audit, suppliers able to offer ultrasonic testing, acoustic emission, or thermography gain preferred-bidder status.


By Inspection Platform: Drones Dominate, Sensors Surge
Drone systems commanded a 51.6% share in 2024, as operators increasingly embraced their non-intrusive access, particularly for blades exceeding 100 m in length. Their adoption cuts downtime because turbines remain online during visual and thermographic passes. Embedded sensors, although accounting for a smaller share today, are forecast to register an 18.2% CAGR, the fastest among platforms, due to their continuous data feed that supports predictive maintenance. Robotic climbers require detailed ultrasonic mapping but face deployment challenges in extreme weather conditions. Rope-access teams retain value on older assets lacking clear flight paths, whereas ground-based imaging towers fill a cost-efficient niche for low-hub-height turbines.
Future investment is flowing into autonomous drone swarms capable of inspecting an entire farm in a single shift, seamlessly handing off data to cloud analytics. Simultaneously, blade manufacturers are embedding fiber-optic strain gauges and acoustic sensors during fabrication, creating a cradle-to-grave structural health record. Providers that integrate in-situ sensor analytics with periodic drone validation stand to differentiate on risk-based maintenance optimization.
By Asset Type: Wind Turbine Blades Predominate, Solar Blades Accelerate
Wind turbine blades represented 78.3% of 2024 demand, reflecting the historical dominance of wind energy installations and stringent insurance requirements. The wind and solar blade inspection NDT market share for this segment remains sizable, yet growth is maturing as installed fleets in some regions plateau. Solar heliostat and mirror blades, although only a minority share, will log a 15.1% CAGR as concentrated solar power complexes proliferate in high-insolation areas. These structures utilize lightweight carbon-fiber skins, which require specialized ultrasonic and shearographic techniques to detect micro-voids that affect optical alignment.
Wind blade designs are trending toward 120 m lengths, complicating inspection logistics. Providers are tailoring drone flight algorithms to manage longer arcs while retaining image resolution. Solar applications introduce various tolerances; optical surface quality significantly impacts energy yield, making thermographic imaging and AI-enabled visual analytics critical. Diversifying across both asset types allows service firms to balance seasonality and regional demand cycles.
By Application: Onshore Wind Commands Volume, Offshore Wind Leads Growth
Onshore wind captured 62.4% of 2024 revenue, buoyed by vast installed capacity and established road access that simplifies service delivery. Despite its volume advantage, the segment’s growth is moderating. Offshore wind, in contrast, is poised for a 19.2% CAGR as European, Asian, and soon North American federal auctions propel multigigawatt projects. The wind and solar blade inspection NDT market size for offshore applications is set to expand sharply once floating turbine deployments move from pilot to commercial scale, necessitating specialized robotics capable of handling heave motions.
Utility-scale solar follows a steady trajectory as heliostat fields gain traction in the Middle East and Africa, whereas distributed solar remains minor due to simpler maintenance needs. Providers active in both onshore and offshore arenas diversify their revenue streams and can leverage shared analytics platforms; however, equipment ruggedization and certification requirements diverge significantly between land and sea, necessitating flexible technology roadmaps.
Geography Analysis
Asia-Pacific held a 38.7% share in 2024 on the back of China’s turbine roll-out, Japan’s concentrated solar power investments, and India’s grid-scale renewable targets. Government incentives, extensive manufacturing bases, and supportive permitting frameworks sustain double-digit growth in inspection demand. The region’s 15.3% forecast CAGR exceeds that of every other geography, driven by life-extension programs for first-generation turbines and new-build offshore projects along the Chinese and Taiwanese coasts.
Europe follows as a mature yet innovation-driven market, pioneering offshore wind and enforcing Europe-wide blade audit mandates. High regulatory rigor and the aging of onshore fleets create a steady demand for inspections, while regional service providers innovate continuous monitoring solutions to manage the harsh conditions of the North Sea. North America benefits from the Inflation Reduction Act incentives and clear FAA drone guidance, stimulating investment in autonomous platforms and integrated analytics. However, supply-chain constraints for certified inspectors temper short-term scalability.
The Middle East and Africa are emerging focal points for heliostat inspection, where desert environments pose challenges to sensor calibration and dust mitigation. Latin America shows moderate adoption as Brazilian and Chilean wind clusters mature. International financing agencies and development banks now stipulate structured maintenance plans, indirectly boosting NDT uptake. Cross-regional partnerships facilitate the transfer of best practices, with IEC and IRENA serving as conduits for knowledge.

Competitive Landscape
The wind and solar blade inspection NDT market remains moderately fragmented. Niche drone analytics firms, legacy industrial inspection companies, and robotics start-ups vie for contracts. Consolidation is accelerating - MISTRAS Group’s purchase of Rope Robotics in May 2025 underscores a trend toward bundling domain expertise with autonomous platforms. Strategic alliances, such as SkySpecs with GE Renewable Energy, integrate AI analytics directly into OEM monitoring suites, locking in recurring data subscriptions.
Technology roadmaps tilt toward multi-sensor payloads that deliver quantifiable ROI. Providers offering ISO 9001 quality and ISO 45001 safety certifications gain bidding advantages with utilities and insurers. All-weather capability is a key differentiation, prompting Aerones and BladeBUG to channel venture funding into high-wind endurance and de-icing features. Meanwhile, sensor OEMs collaborate with blade manufacturers to embed health-monitoring fibers, creating aftermarket pull for analytics dashboards.
Price competition persists for commoditized visual inspections, but advanced ultrasonic services and sensor deployments command premium margins. Market entrants focusing solely on manual rope-access face shrinking opportunities as automation penetrates even aging fleets. Companies capable of spanning the full maintenance cycle—inspection, analytics, and in-situ repair, are best positioned to capture value as owners pivot to performance-based contracts.
Wind & Solar Blade Inspection NDT Industry Leaders
MISTRAS Group
Eddyfi Technologies
SkySpecs
BladeBUG
Aerones
- *Disclaimer: Major Players sorted in no particular order

Recent Industry Developments
- September 2025: Aerones secured USD 15 million Series B funding to scale its robotic maintenance platform for offshore blades, emphasizing all-weather ultrasonic capabilities.
- August 2025: SkySpecs began integrating AI analytics into GE Renewable Energy turbines to enable real-time blade health dashboards.
- July 2025: BladeBUG’s climber robot completed North Sea trials on 15 MW turbines, validating inspections in 25 m/s winds.
- June 2025: Clobotics raised USD 12 million Series A to tailor AI visual analytics for heliostat mirrors and enter Middle Eastern markets.


Global Wind & Solar Blade Inspection NDT Market Report Scope
| Ultrasonic Testing |
| Infra-red Thermography |
| Visual (High-Res / AI) |
| Shearography |
| Acoustic Emission |
| Eddy Current |
| Drone-Based Systems |
| Robotic Climbers |
| Rope-Access Teams with Portable NDT |
| Ground-Based Imaging Towers |
| Embedded Sensor Networks |
| Wind Turbine Blades |
| Solar Heliostat / Mirror Blades |
| Onshore Wind |
| Offshore Wind |
| Utility-Scale Solar |
| Distributed Solar |
| North America | United States | |
| Canada | ||
| Mexico | ||
| South America | Brazil | |
| Argentina | ||
| Rest of South America | ||
| Europe | Germany | |
| United Kingdom | ||
| France | ||
| Italy | ||
| Spain | ||
| Rest of Europe | ||
| Asia Pacific | China | |
| Japan | ||
| India | ||
| South Korea | ||
| South-East Asia | ||
| Rest of Asia Pacific | ||
| Middle East and Africa | Middle East | Saudi Arabia |
| United Arab Emirates | ||
| Turkey | ||
| Rest of Middle East | ||
| Africa | South Africa | |
| Nigeria | ||
| Rest of Africa | ||
| By Inspection Technique | Ultrasonic Testing | ||
| Infra-red Thermography | |||
| Visual (High-Res / AI) | |||
| Shearography | |||
| Acoustic Emission | |||
| Eddy Current | |||
| By Inspection Platform | Drone-Based Systems | ||
| Robotic Climbers | |||
| Rope-Access Teams with Portable NDT | |||
| Ground-Based Imaging Towers | |||
| Embedded Sensor Networks | |||
| By Asset Type | Wind Turbine Blades | ||
| Solar Heliostat / Mirror Blades | |||
| By Application | Onshore Wind | ||
| Offshore Wind | |||
| Utility-Scale Solar | |||
| Distributed Solar | |||
| By Geography | North America | United States | |
| Canada | |||
| Mexico | |||
| South America | Brazil | ||
| Argentina | |||
| Rest of South America | |||
| Europe | Germany | ||
| United Kingdom | |||
| France | |||
| Italy | |||
| Spain | |||
| Rest of Europe | |||
| Asia Pacific | China | ||
| Japan | |||
| India | |||
| South Korea | |||
| South-East Asia | |||
| Rest of Asia Pacific | |||
| Middle East and Africa | Middle East | Saudi Arabia | |
| United Arab Emirates | |||
| Turkey | |||
| Rest of Middle East | |||
| Africa | South Africa | ||
| Nigeria | |||
| Rest of Africa | |||


Key Questions Answered in the Report
How large is the wind and solar blade inspection NDT market in 2025?
The market stands at USD 650 million in 2025 and is projected to double by 2030 at a 13.61% CAGR.
Which inspection technique is most widely used for blades?
Ultrasonic testing leads with 42.5% 2024 revenue share, thanks to its accuracy for internal defect detection.
Why is Asia-Pacific dominant in blade inspections?
Massive turbine installations in China, along with expanding solar projects in Japan and India, give the region a 38.7% share and the fastest CAGR of 15.3%.
What drives the shift to autonomous inspections?
Regulations require certified audits, while operators seek to minimize downtime, making AI-enabled drones and embedded sensors increasingly attractive.
Which platform category is growing fastest?
Embedded sensor networks are forecast to expand at an 18.2% CAGR as owners adopt continuous blade health monitoring.
Page last updated on:


