Aerospace NDT Market Size and Share
Market Overview
| Study Period | 2020 - 2031 |
|---|---|
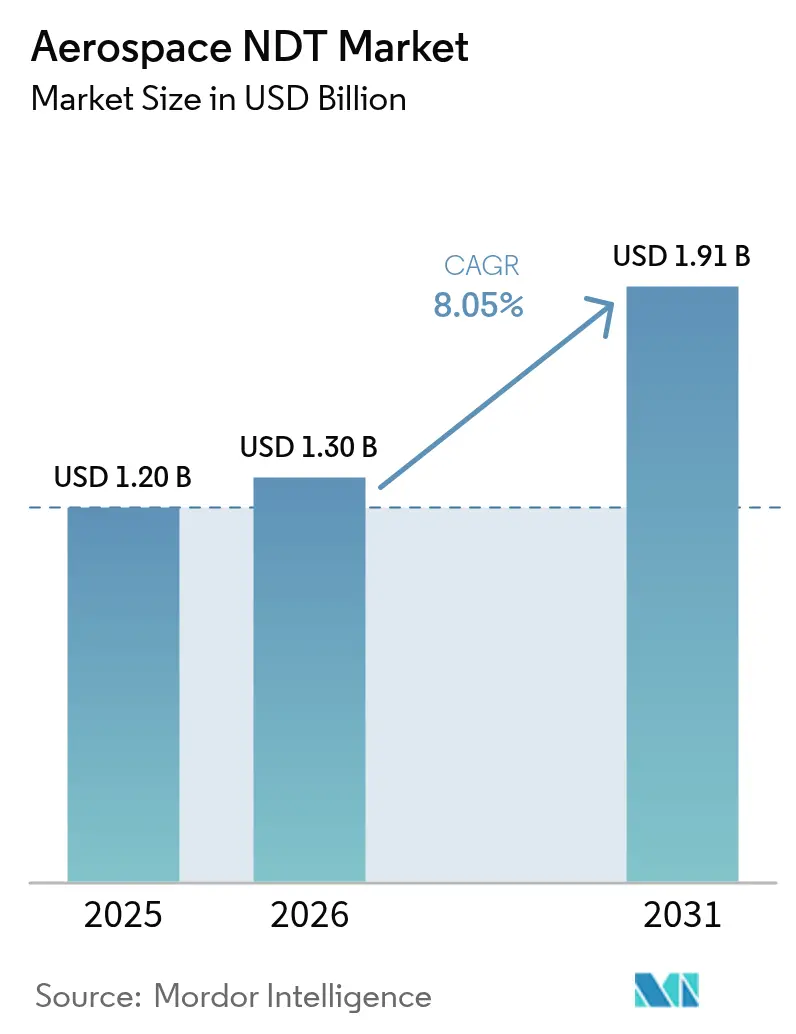
| Market Size (2026) | USD 1.3 Billion |
| Market Size (2031) | USD 1.91 Billion |
| Growth Rate (2026 - 2031) | 8.05% CAGR |
| Fastest Growing Market | Asia Pacific |
| Largest Market | North America |
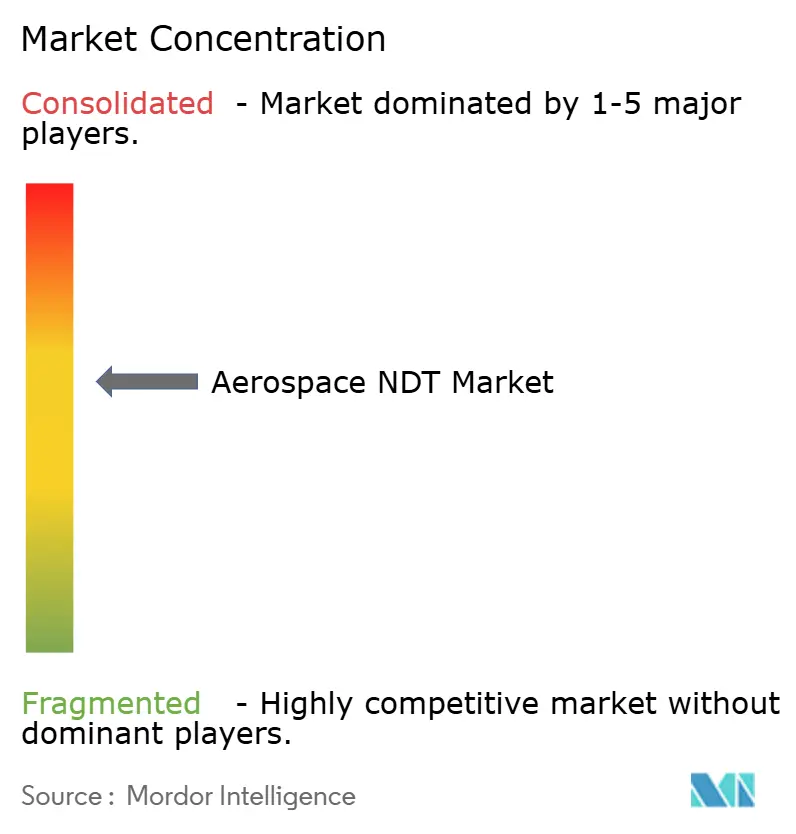
| Market Concentration | Medium |
Major Players *Disclaimer: Major Players sorted in no particular order Image © Mordor Intelligence. Reuse requires attribution under CC BY 4.0. | |
Aerospace NDT Market Analysis by Mordor Intelligence
Aerospace NDT market size in 2026 is estimated at USD 1.3 billion, growing from 2025 value of USD 1.20 billion with 2031 projections showing USD 1.91 billion, growing at 8.05% CAGR over 2026-2031. Fleet expansion programs, surging maintenance workloads, and the sector-wide embrace of predictive maintenance platforms anchor this growth trajectory. Aircraft makers accelerated output in 2024. Boeing handed over 528 jets and Airbus 735—thereby sustaining demand for rigorous inspection protocols that safeguard structural integrity throughout the product life-cycle.[1]Boeing Company, “Orders and Deliveries,” boeing.com Equipment currently leads procurement budgets, yet software adoption is rising as operators consolidate inspection records with analytics that anticipate component fatigue. Composite airframe penetration, stringent safety regulations, and the arrival of urban air mobility prototypes further widen the addressable inspection scope, rewarding providers that deliver AI-enabled, documentation-rich solutions. Competitive pressures increasingly favor vendors capable of blending hardware expertise with automated defect-recognition algorithms.
Key Report Takeaways
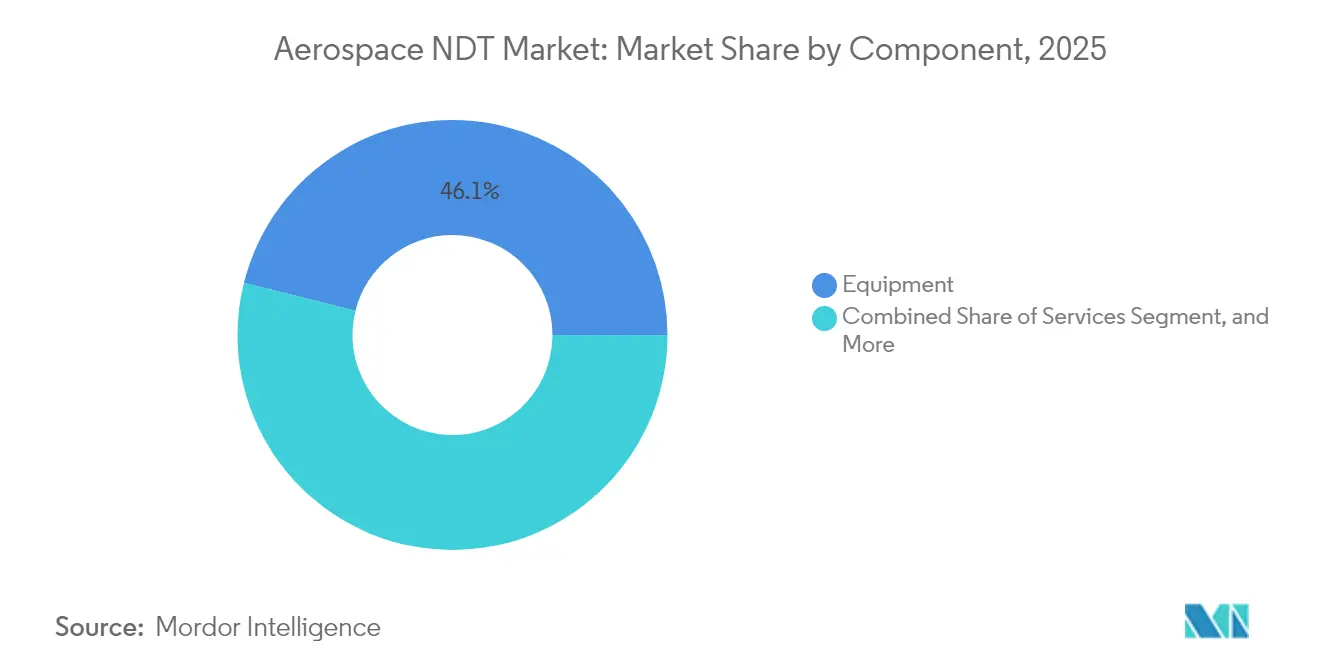
- By component, equipment captured 46.10% of the Aerospace NDT market share in 2025, while the software segment revenue is projected to climb at a 9.15% CAGR through 2031.
- By testing method, ultrasonic testing accounted for 32.35% of the Aerospace NDT market size in 2025; computed tomography is forecasted to grow at a 10.45% CAGR through 2031.
- By technique, traditional approaches commanded 79.95% of the Aerospace NDT market size in 2025, whereas AI-enabled solutions are advancing at a 8.85% CAGR.
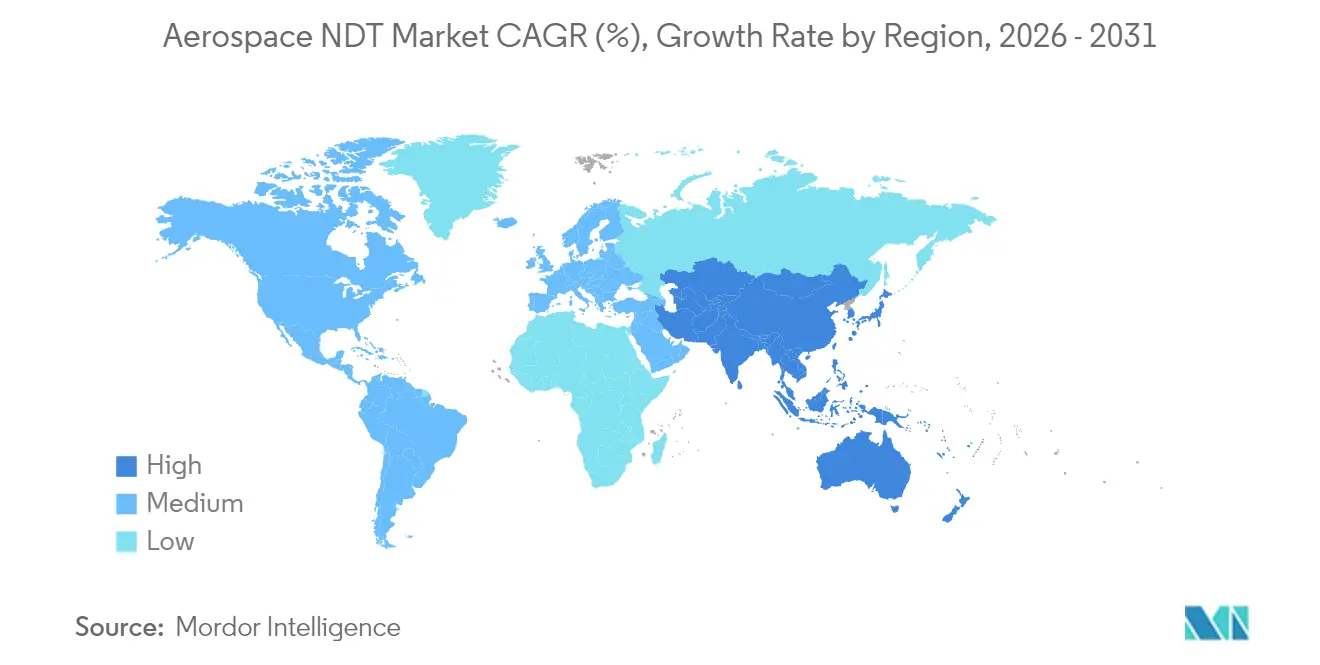
- By geography, North America accounted for 38.45% of the Aerospace NDT market share in 2025; Asia-Pacific represents the fastest-growing region, expanding at a 9.1% CAGR through 2031.
Note: Market size and forecast figures in this report are generated using Mordor Intelligence’s proprietary estimation framework, updated with the latest available data and insights as of 2026.
Market Trends and Insights
Drivers Impact Analysis of Aerospace NDT Market*
| Driver | (~) % Impact on CAGR Forecast | Geographic Relevance | Impact Timeline |
|---|---|---|---|
| Increasing passenger aircraft production | +2.1% | North America, Europe; global spillover | Medium term (2-4 years) |
| Growing MRO demand | +1.8% | Asia-Pacific leadership; global scope | Long term (≥4 years) |
| Rising adoption of composite airframes | +1.5% | North America, Europe; widening to Asia-Pacific | Long term (≥4 years) |
| Stricter safety-quality assurance regulations | +1.2% | Worldwide; FAA and EASA stewardship | Medium term (2-4 years) |
| Integration of predictive analytics | +1.0% | Early adoption in North America, Europe; global diffusion | Short term (≤2 years) |
| Expansion of urban air mobility prototypes | +0.9% | Pilot programs in North America, Europe; selective APAC locations | Long term (≥4 years) |
| Source: Mordor Intelligence | |||
Increasing Passenger Aircraft Production
Boeing and Airbus together shipped more than 1,200 airframes in 2024, doubling post-pandemic lows and forcing production lines to embed high-throughput inspection systems that verify engine pylons, wing spars, and fuselage panels without slowing takt times. Automated phased-array robots now populate final-assembly stations, capturing repeatable scans that feed centralized defect libraries. Documentation burdens under AS9100 require manufacturers to associate every ultrasonic reading with specific part serial numbers, thereby driving incremental software demand for digital traceability. Equipment vendors offering inline robotics paired with analytics dashboards have seen order pipelines tighten, while legacy manual workflows struggle to scale at current build rates.
Growing Maintenance, Repair and Overhaul (MRO) Demand
Commercial fleets averaged 12.8 years of service in 2025, a life cycle that magnifies structural fatigue risk and inflates heavy-check workloads.[2]International Air Transport Association, “MRO Programs,” iata.org Airlines prolong the lives of their assets to counterbalance the capital-intensive replacement cycles of narrow-body aircraft, thereby enlarging the installed base of aging airframes that require periodic eddy-current and radiographic evaluations. Asia-Pacific facilities, from Guangzhou to Hyderabad, are tripling their hangar capacity, creating a neighborhood demand for equipment rentals, inspector training, and supply chains for consumables. Predictive analytics platforms now fuse flight-load data with non-destructive test histories, enabling engineering teams to defer or accelerate checks based on real-world stress cycles. Providers that bundle sensors, analytics, and field-service training secure multi-year framework contracts amid this MRO up-cycle.
Rising Adoption of Composite Airframes
Carbon-fiber reinforced structures dominate roughly 50% of the Boeing 787 and Airbus A350 airframes, shifting defect-detection priorities from corrosion to delamination.[3]Federal Aviation Administration, “Design Approvals Publications,” faa.gov Pulse-echo ultrasonics and high-energy computed tomography have become indispensable, as resin-rich pockets and impact-induced fiber breaks evade legacy magnetic particle or liquid penetrant techniques. Composite repairs also require post-cure verification, which spurs sales of portable phased-array devices calibrated for anisotropic materials. Training syllabi now emphasize signal interpretation in multi-layer laminate stacks, a skillset scarce among incumbent inspectors. Vendors capable of delivering turnkey composite solutions encompassing hardware, simulation software, and refresher courses capture and require post-cure verification, which spurs a sizable wallet share.
Stricter Safety-Quality Assurance Regulations
After several fatigue-related incidents, the FAA and EASA toughened directives governing inspection frequency and documentation, compelling airlines and MROs to invest in traceable digital workflows. ISO 9712 and EN 4179 provisions now require recertification audits that verify calibration logs, scan files, and the credentials of inspectors. Compliance has accelerated the adoption of cloud-based repositories that store raw image stacks alongside interpreted results, simplifying regulator access. Hardware suppliers that can encrypt data at the source and export secure manifests position themselves as partners rather than vendors, thereby mitigating cybersecurity anxieties shared by defense operators.
Restraints Impact Analysis of Aerospace NDT Market*
| Restraint | (~) % Impact on CAGR Forecast | Geographic Relevance | Impact Timeline |
|---|---|---|---|
| High capital cost of advanced NDT equipment | -1.4% | Emerging markets feel constraints acutely | Medium term (2-4 years) |
| Shortage of Level III certified inspectors | -1.1% | Global; severe in Asia-Pacific, Middle East | Long term (≥4 years) |
| Data-security concerns in cloud tools | -0.8% | Worldwide; sharp focus in defense programs | Short term (≤2 years) |
| Limited standards for additive parts | -0.6% | Early adoption in North America, Europe | Medium term (2-4 years) |
| Source: Mordor Intelligence | |||
High Capital Cost of Advanced NDT Equipment
Turnkey phased-array and CT installations frequently exceed USD 500,000, straining the budgets of regional MROs and launch-phase eVTOL manufacturers. Financing hurdles intensify in economies where lenders lack technical valuation frameworks, postponing upgrade cycles. Vendors are now piloting rental pools and usage-based subscription models that shift investments from CapEx to OpEx; however, hardware refresh rates remain slower outside tier-one hubs.
Shortage of Level III Certified Inspectors
The American Society for Nondestructive Testing estimates a 40% global shortfall in Level III talent as senior specialists retire faster than training pipelines replenish. Regulatory mandates require Level III oversight for critical tasks, bottlenecking capacity even as backlogs swell. Remote-verification platforms and AI-assisted interpretation aim to lower the reliance on human expertise, but full regulatory acceptance lags, prolonging the skills gap.
*Our forecasts treat driver/restraint impacts as directional, not additive. The impact forecasts reflect baseline growth, mix effects, and variable interactions.
Aerospace NDT Market Segment Analysis
By Component:
Equipment Dominance Faces Software DisruptionIn 2025, precision scanners, phased-array probes, and high-energy CT machines accounted for 46.10% of the Aerospace NDT market size, underscoring the hardware-centric purchasing approach that has historically defined inspection budgets. Average ticket prices of USD 300,000-500,000 per platform underscore high barriers to entry and long depreciation schedules that stabilize incumbent revenues. Software, however, is scaling faster; its 9.15% CAGR signals a pivot toward cloud dashboards that mine historical scans for predictive signatures. By 2030, analytics subscriptions could dilute hardware’s revenue share as SaaS fees compound annually.
Software vendors leverage low entry costs to seed installations across mixed OEM fleets, monetizing via per-scan or per-aircraft licenses. This asset-light model appeals to regional MROs that are locked out of top-tier hardware purchases. Service contracts hold steady as airlines outsource periodic inspections, while consumables supply recurring cash flow linked directly to test frequency, cushioning revenue during hardware down-cycles. The interplay of high upfront equipment outlays and modest but compounding software fees is reshaping lifetime-value calculations across the Aerospace NDT market.


By Testing Method:
Ultrasonic Leadership Challenged by Computed Tomography InnovationUltrasonic technology contributed 32.35% to the Aerospace NDT market share in 2025, reflecting its versatility on metallic and composite assemblies. Portable phased-array probes now integrate AI recognition that flags signal anomalies in real-time, reducing inspection time per component. Computed tomography races ahead at a 10.45% CAGR, as OEMs rely on 3D volumetric insight to validate bonded joints and complex composite layups that evade two-dimensional modalities.
Radiographic, eddy-current, thermography, and acoustic-emission techniques occupy niche roles tied to specific material properties or defect morphologies. Regulatory momentum favors CT for critical composites, forcing MROs to weigh seven-figure investments or outsource jobs to specialized labs. Suppliers bundling CT hardware with dose-optimization software and operator-certification courses stand to accelerate penetration.
By Technique:
AI-Enabled Methods Disrupt Traditional ApproachesConventional methodologies still account for 79.95% of the Aerospace NDT market size, a testament to their decades of proven reliability and entrenched certification schemes. Yet, AI-assisted platforms post a 8.85% CAGR, as image-classification neural networks outperform human eyes in signal-to-noise differentiation.
Early-stage pilots demonstrate 20-40% cycle-time reductions, creating cost avoidance that offsets software license fees. Regulators demand rigorous proof of equivalency, so vendors pair AI outputs with human cross-checks during transition phases, thereby easing adoption risk.

Geography Analysis
North America Aerospace NDT Market
North America retained 38.45% of the Aerospace NDT market share in 2025, buoyed by Boeing’s production hubs and dense MRO corridors stretching from Seattle to Miami. Federal Aviation Administration directives prescribe exhaustive inspection routines for aging fleets, prompting airlines to refresh equipment arsenals and expand digital record systems. The region also pioneers predictive analytics integrations that feed maintenance-scheduling engines, driving incremental software spend.
APAC Aerospace NDT Market
Asia-Pacific posts the fastest trajectory at 9.1% CAGR, energized by China’s narrow-body manufacturing ramp and India’s government-backed MRO incentives. Guangzhou, Hyderabad, and Singapore have emerged as inspection hubs where AI-enabled platforms leapfrog legacy infrastructure gaps. Talent shortages remain acute, however, nudging stakeholders to adopt remote-verification services that connect on-site technicians with off-shore Level III experts via encrypted links.
EMEA and South America Aerospace NDT Market
Europe sustains mid-single-digit growth, anchored by Airbus assembly lines in Toulouse and Hamburg, alongside mature supply chains that serve both civil and defense programs. The European Union Aviation Safety Agency enforces stringent data-retention mandates, accelerating SaaS adoption that automates compliance reporting. Middle Eastern carriers channel petro-dollar capital into hangar complexes in Dubai and Doha, vying to capture long-haul layover maintenance; yet, inspector shortages and high equipment costs cap immediate expansion. South America and Africa remain nascent, with sporadic upgrades tied to government-funded safety drives.

Regulatory Landscape
Aerospace NDT operates under a layered compliance framework covering regulator mandates and industry standards for inspection methods, documentation, and personnel qualification. In practice, Airworthiness Directives issued by regulators such as the Federal Aviation Administration (FAA) and the European Union Aviation Safety Agency (EASA) drive near-term inspection demand by prescribing repetitive checks and traceability for affected aircraft structures; for example, the FAA published an Airworthiness Directive in April 2026 (Docket No. FAA-2026-06599) that requires recurring visual and NDT inspections to address cracking and corrosion topics initially identified by EASA.
At the standards and accreditation level, EN 4179 and NAS 410 are widely used for aerospace NDT personnel qualification frameworks across civil and defense supply chains, while ASTM International maintains foundational NDT standards and terminology (for example, ASTM E1316-25A) plus method standards used to qualify emerging applications such as additive-manufactured parts (for example, ASTM E3166-20e01). Nadcap (Performance Review Institute) acts as an industry-managed accreditation pathway for aerospace special processes, shaping audit readiness and recordkeeping expectations for OEMs, Tier suppliers, and MRO organizations.
Value Chain Analysis
The aerospace NDT value chain starts with equipment and software suppliers (ultrasonic, radiographic, and computed tomography systems, plus analytics and data-management layers), extends to OEM and Tier manufacturing users, and then moves into airline, defense, and independent MRO inspection workflows where services and consumables generate recurring spend. As production and heavy-check workloads rise, the chain is increasingly shaped by automation enablers, including digital radiography, PAUT with FMC/TFM, and robotic scanning systems that convert inspections into structured datasets for fleet and production quality systems.
Downstream capacity and accreditation are increasingly differentiators as work shifts toward complex composites and additive geometries that are harder to inspect manually. In June 2026, MISTRAS Group expanded its Houston, Texas laboratory with added aerospace inspection capabilities (including digital radiography and ultrasonic systems) and positioned the site for Nadcap accreditation, reflecting how service providers are investing in in-house lab throughput to reduce turnaround time and qualify for prime contractor requirements. On the defense side, programs that mature autonomous inspection at depots (for example, Asylon's Phase Three U.S. Air Force work at Warner Robins Air Logistics Complex in July 2026) reinforce a parallel channel where robotics and software integrate into sustainment operations, tightening feedback loops between inspection results, repair decisions, and digital maintenance records.
Competitive Landscape
The Aerospace NDT market remains moderately fragmented, with the top five suppliers accounting for approximately 55% of the market share, leaving a long tail of regional distributors, rental houses, and specialist software firms. Baker Hughes, GE Aviation NDT Solutions, Olympus Corporation, and Evident (now part of Wabtec) maintain depth across ultrasonic, CT, and phased-array portfolios.[4]Railway Age, “Wabtec to Acquire Evident for $1.78 Billion,” railwayage.com Their entrenched channel networks and bundled training services constitute durable moats. Nonetheless, venture-backed software entrants such as Vibrant Corporation gain traction by offering AI diagnostics that can be retrofitted onto incumbent hardware, compelling legacy leaders to accelerate their digital roadmaps.
Acquisition activity intensifies: Wabtec’s USD 1.78 billion purchase of Evident in 2024 realigned competitive contours by merging rolling-stock and aerospace NDT assets under one analytics-centric umbrella. Baker Hughes invested USD 45 million in a Houston R&D campus to accelerate the development of AI-enabled phased-array probes, while GE Aviation launched the Digital Inspector suite, which integrates inspection imagery with fleet health dashboards. Mid-tier players are pursuing rental pools and training academies to secure downstream customer relationships as hardware margins compress.
Patent filings in automated defect recognition surged 18% YoY in 2024, signaling an arms race to secure data-science talent and proprietary image libraries. Supply-chain partnerships with cloud providers, cybersecurity auditors, and universities underpin technology pipelines. In parallel, standards bodies are drafting frameworks for AI result validation, a development that is likely to advantage early movers who have embedded explainability features into their algorithms.
Aerospace NDT Industry Leaders
Baker Hughes Company
Mistras Group Inc.
SGS SA
Intertek Group plc
Applus Services SA
- *Disclaimer: Major Players sorted in no particular order
Aerospace NDT Market Companies Covered in this Report
- Baker Hughes Company
- Mistras Group Inc.
- SGS SA
- Intertek Group plc
- Applus Services SA
- General Electric Company (GE Aviation NDT Solutions)
- Olympus Corporation
- Nikon Corporation
- Eddyfi Technologies Inc.
- Teledyne Technologies Incorporated
- Zetec Inc.
- Sonatest Ltd.
- TWI Ltd.
- Ashtead Technology Ltd.
- Vermont Ultrasonics Inc.
- YXLON International GmbH
- Hologic Inc. (SureScan)
- Waygate Technologies GmbH
- Magnaflux Corporation
- Fischer Technology Inc.
- Element Materials Technology Group Ltd.
- Collins Aerospace (UTAS NDT Lab)
- Lufthansa Technik AG (NDT Services)
- Airbus S.A.S (AIRTAC NDT)
- Spirit AeroSystems Holdings Inc. (NDT Centers)
- Bombardier Inc. (In-house NDT)

Market Opportunities and Future Outlook
A central whitespace is converting aerospace NDT from instrument-centric purchasing to audit-ready digital workflows that support traceability, cybersecurity controls, and repeatable interpretation across distributed sites. The FAA's July 2025 Advisory Circular AC 43.13-1C, which outlines certification pathways for AI-enabled NDT systems while retaining human review for critical parts, creates room for vendors that package AI assistance with validated procedures, records retention, and inspector qualification support rather than selling standalone algorithms.
Capacity expansion and accreditation-led specialization are also creating near-term pockets, particularly where composite and advanced materials testing capacity is constrained. Element Materials Technology invested more than USD 20 million in May 2026 to expand aerospace and defense materials testing capacity at its Charlotte, North Carolina facility, and MISTRAS Group expanded lab capabilities in Houston in June 2026, indicating active spend toward higher-throughput, higher-spec testing infrastructure aligned with OEM and MRO quality requirements. As robotics and autonomous inspection mature inside depot and OEM environments, opportunities concentrate on integrating NDT outputs into predictive maintenance platforms, delivering secure data pipelines, and building training and remote-verification offerings that help mitigate the documented shortage of Level III certified personnel.
Recent Industry Developments in Aerospace NDT Market
- June 2026: MISTRAS Group expanded its Houston, Texas in-house laboratory capabilities for aerospace and defense work, adding advanced inspection equipment such as digital radiography and ultrasonic systems. The upgrade increases local throughput for production-support and components work while supporting pathways to meet prime and OEM qualification requirements, including Nadcap-focused readiness.
- September 2025: Boeing introduced stricter ultrasonic inspections for 737 MAX wing-to-fuselage joints in response to FAA directives, adding inspection scope across a large in-service fleet. The action increased demand for high-throughput ultrasonic equipment and documentation-rich workflows at airline and MRO sites supporting continued airworthiness.
- July 2024: Wabtec announced its USD 1.78 billion acquisition of Evident, bringing a major NDT equipment portfolio under a broader industrial and analytics-oriented owner. The combination reshaped competitive dynamics for ultrasonic and imaging solutions and reinforced the push toward bundled hardware, software, and service offerings across regulated inspection markets including aerospace.


Aerospace NDT Market Report Scope and Research Methodology
Market Definition and Coverage
This market covers revenues generated from non-destructive testing used to inspect and verify aerospace and defense parts, assemblies, and structures without damaging them. It includes the key tools, software, and services that support inspection activities across manufacturing and maintenance.
Scope exclusions: We exclude destructive testing, routine mechanical metrology that is not an NDT method, and general QA services that do not involve an NDT technique.
Segments Covered in This Report
- By Component
- Equipment
- Software
- Services
- Consumables
- By Testing Method
- Ultrasonic Testing
- Radiographic Testing
- Magnetic Particle Testing
- Liquid Penetrant Testing
- Visual Inspection Testing
- Eddy-Current Testing
- Acoustic Emission Testing
- Thermography / Infrared Testing
- Computed Tomography Testing
- By Technique
- Traditional / Conventional
- AI-enabled
- By Geography
- North America
- United States
- Canada
- Mexico
- South America
- Brazil
- Argentina
- Rest of South America
- Europe
- Germany
- United Kingdom
- France
- Italy
- Spain
- Rest of Europe
- Asia Pacific
- China
- Japan
- India
- South Korea
- South-East Asia
- Rest of Asia Pacific
- Middle East
- Saudi Arabia
- United Arab Emirates
- Turkey
- Rest of Middle East
- Africa
- South Africa
- Nigeria
- Rest of Africa
- North America
Data Sources, Market Sizing, and Validation
Desk Research
Desk work starts by pinning down the real demand pool and the inspection intensity that typically follows it. We review public aircraft and defense platform activity, along with safety and inspection guidance, to understand where NDT is applied most often and how spending usually shows up.
Sources used include non-paywalled and official references such as FAA airworthiness directives and advisory circulars, EASA continuing airworthiness material, ICAO reference publications, US DoD budget documents, and IAEA resources on industrial radiography, along with peer-reviewed NDT journals and conference proceedings. We also review annual reports, investor presentations, and reputable press releases to map product scope, pricing direction, and the pace of technology shifts. When needed, paid subscriptions are used for company financial intelligence, news and financials screening, patent databases, and selective aerospace and aviation fleet and platform datapoints. The desk sources listed are not exhaustive, and many other public references were also checked for data collection, validation, and clarification.
Primary Interviews and Surveys
Primary work is used to pressure-test the desk assumptions that drive value, especially how much inspection is done per aircraft or program and how tool adoption is shifting. We spoke with a mix of equipment-focused participants, service providers, and end-user stakeholders across the main regions so pricing logic, utilization, and replacement cycles could be confirmed with real operating context.
Distribution of primary research fieldwork respondents
| Company type | Respondent position | Region |
|---|---|---|
| Top tier: 38% | CXOs: 13% | APAC: 41% |
| Mid tier: 44% | Functional/Unit leaders: 43% | EMEA: 36% |
| Smaller Players: 18% | Managers: 44% | Americas: 23% |
Market-Sizing & Forecasting
Sizing is built using a top-down, demand-linked approach where aircraft production and deliveries, active fleet levels, and MRO activity are used to reconstruct the inspection workload that NDT supports, and then spending is applied to that workload. To keep the totals realistic, we also run selective bottom-up approximations, such as sampled average selling price times unit volumes for core equipment categories and a reasonableness roll-up of service intensity for major maintenance events, which are then used to adjust outliers.
Key model inputs include aircraft build rates and defense platform maintenance cycles, the mix shift toward composite structures (which changes the method mix), method penetration by use case (for example ultrasonic versus radiography), utilization rates for equipment in shops versus field work, and pricing movement for equipment, software, and services. For the forecast, scenario analysis is used so the model can reflect different delivery cadence paths, MRO throughput, and technology adoption speed, and then the scenario weights are aligned to what primary respondents described as the most likely planning case. Where bottom-up coverage is incomplete for smaller geographies or niche methods, gaps are handled through ratios tied to fleet and production indicators, followed by a second check against typical spending per aircraft and per maintenance cycle.
Data Validation & Update Cycle
Validation is handled through several checks before the numbers are finalized. Model outputs are compared against independent signals like aircraft delivery trends, fleet utilization changes, and procurement and maintenance spending direction, and then unusual jumps are reviewed to confirm they are supported by an input change rather than a formula issue.
A second analyst review is used to re-check scope boundaries, unit conversions, and currency handling, and then targeted re-contacts are triggered if a major assumption moves beyond a normal range. The report is refreshed annually, and interim updates are made when material events occur, such as sharp shifts in aircraft production schedules or major regulatory changes affecting inspection frequency. Before delivery, the model is re-opened for a final pass so clients receive the latest updated view.
Mordor Intelligence's Aerospace Defense Non Destructive Testing Market Size Measured Against Other Published Estimates
Published market sizes for aerospace and defense NDT can differ even when the topic sounds identical, because the counted revenue streams and the timing of the base year are not always aligned. Differences also come from how each study treats services versus equipment, and whether software and adjacent inspection activities are pulled into the total.
Key gap drivers in this market usually come from scope boundaries and the way the demand pool is constructed. Some publishers lean heavily toward equipment-only totals, others add training or certification revenues, and some apply aggressive adoption curves for advanced methods without cross-checking them against fleet and MRO realities. Currency timing and update cadence also matter because aircraft deliveries and defense maintenance cycles can shift quickly and that changes the near-term run rate.
Benchmark comparison
| Source | Market Size | Gaps in Research Methodology |
|---|---|---|
| Mordor Intelligence | USD 1.3 B (2026) | |
| Global Report Publisher A | USD 2.59 B (2025) | This estimate uses a broader revenue basket that can include training and certification programs and counts additional service-linked goods within offerings, which expands totals beyond a tighter NDT equipment plus core services view. |
| Market Publisher B | USD 0.49 B (2024) | This estimate appears closer to an equipment-leaning scope with narrower product groupings, which can undercount service-heavy spending tied to recurring inspections and scheduled maintenance events. |
Aircraft deliveries, fleet size, and MRO throughput were the evidence checks used to keep Mordor Intelligence tied to inspection workload before value is applied, which limits over-counting when adjacent revenue items are bundled. Looking across the table, the spread is mainly explained by what each publisher counts around the core NDT activity and how wide the revenue boundary is drawn, so the most useful comparison is always scope first and then the year used.


Key Questions Answered in the Report
How large is the Aerospace NDT market in 2026?
The Aerospace NDT market size stands at USD 1.3 billion in 2026.
What CAGR is expected for Aerospace NDT through 2031?
Revenue is projected to rise at an 8.05% CAGR between 2026 and 2031.
Which component segment is expanding the fastest?
Software solutions are growing at a 9.15% CAGR as operators migrate to analytics-driven inspection workflows.
Why is Asia-Pacific the quickest-growing region?
Fleet expansion, domestic aircraft production, and new MRO facilities push Asia-Pacific demand at a 9.1% CAGR.
What is the main technological shift shaping inspection methods?
AI-enabled analytics are augmenting traditional techniques, cutting inspection time and improving defect detection accuracy.
Which testing method shows the highest growth rate?
Computed tomography leads with a projected 10.45% CAGR due to its 3D visualization capabilities for composite parts.
Page last updated on:


