
Power Generation NDT Market Size and Share
Market Overview
| Study Period | 2020 - 2031 |
|---|---|
| Market Size (2026) | USD 4.44 Billion |
| Market Size (2031) | USD 5.98 Billion |
| Growth Rate (2026 - 2031) | 6.16 % |
| Fastest Growing Market | Asia-Pacific |
| Largest Market | North America |
| Market Concentration | Medium |
Major Players *Disclaimer: Major Players sorted in no particular order Image © Mordor Intelligence. Reuse requires attribution under CC BY 4.0. | |
Power Generation NDT Market Analysis by Mordor Intelligence
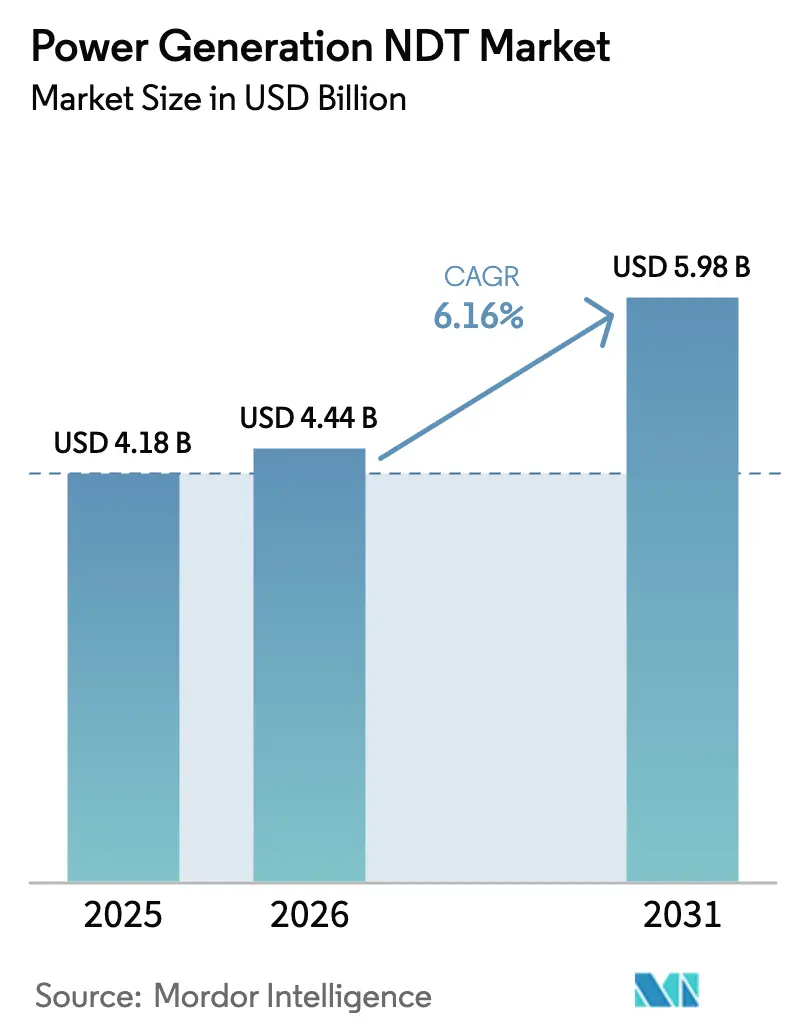
The power generation NDT market size is expected to grow from USD 4.18 billion in 2025 to USD 4.44 billion in 2026 and is forecast to reach USD 5.98 billion by 2031 at 6.16% CAGR over 2026-2031. Rising inspection workloads for aging coal- and gas-fired plants, nuclear license renewal programs, and the shift toward predictive maintenance platforms are steering procurement budgets toward advanced ultrasonic, radiographic, and computed tomography systems. Large utilities are standardizing inspection data formats to feed digital twins, which is encouraging bundled hardware-software deals and shortening replacement cycles. At the same time, tariff-driven localization of sensor supply chains is improving lead times for smaller operators, while the persistent shortage of certified ISO 9712 and ASNT Level III technicians continues to inflate labor costs. Service providers that can combine automated scanners, AI-assisted defect recognition, and cloud analytics are capturing multi-year framework agreements that lock in recurring revenue.
Key Report Takeaways
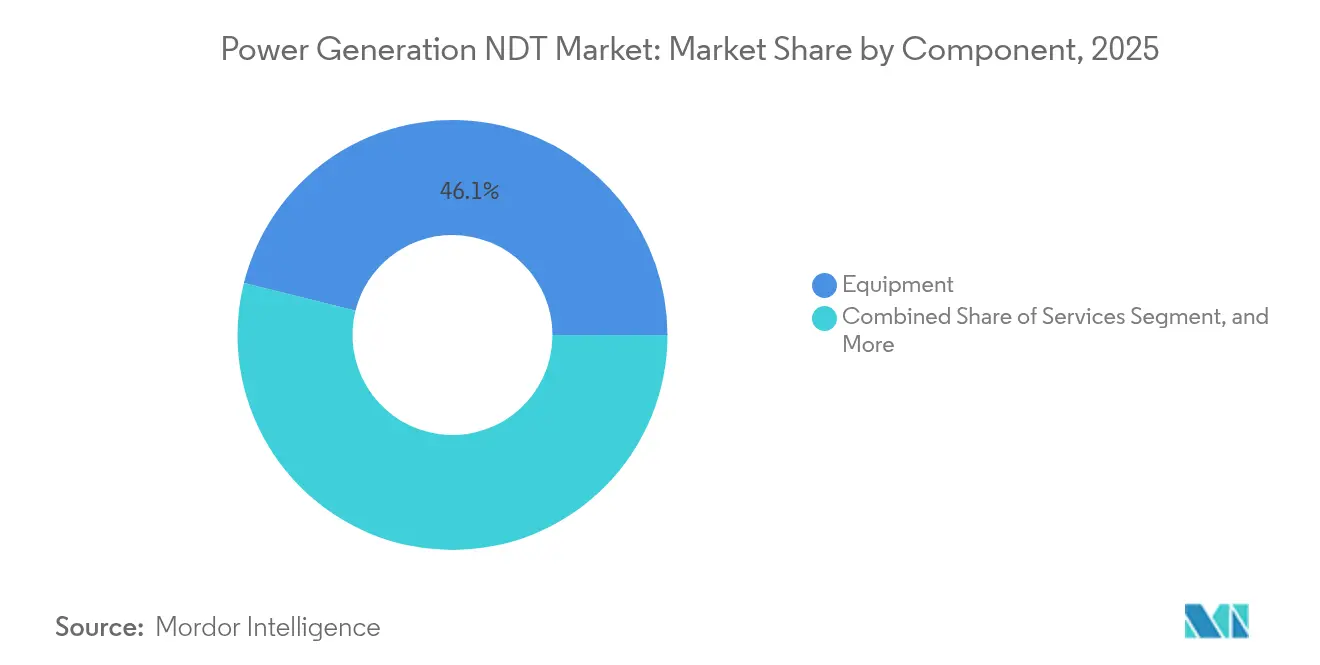
- By component, equipment led with a 46.12% share of the power generation NDT market in 2025; software is expected to advance at a 7.01% CAGR through 2031.
- By testing method, ultrasonic testing accounted for 34.15% of the power generation NDT market size in 2025, whereas computed tomography is projected to expand at an 7.62% CAGR to 2031.
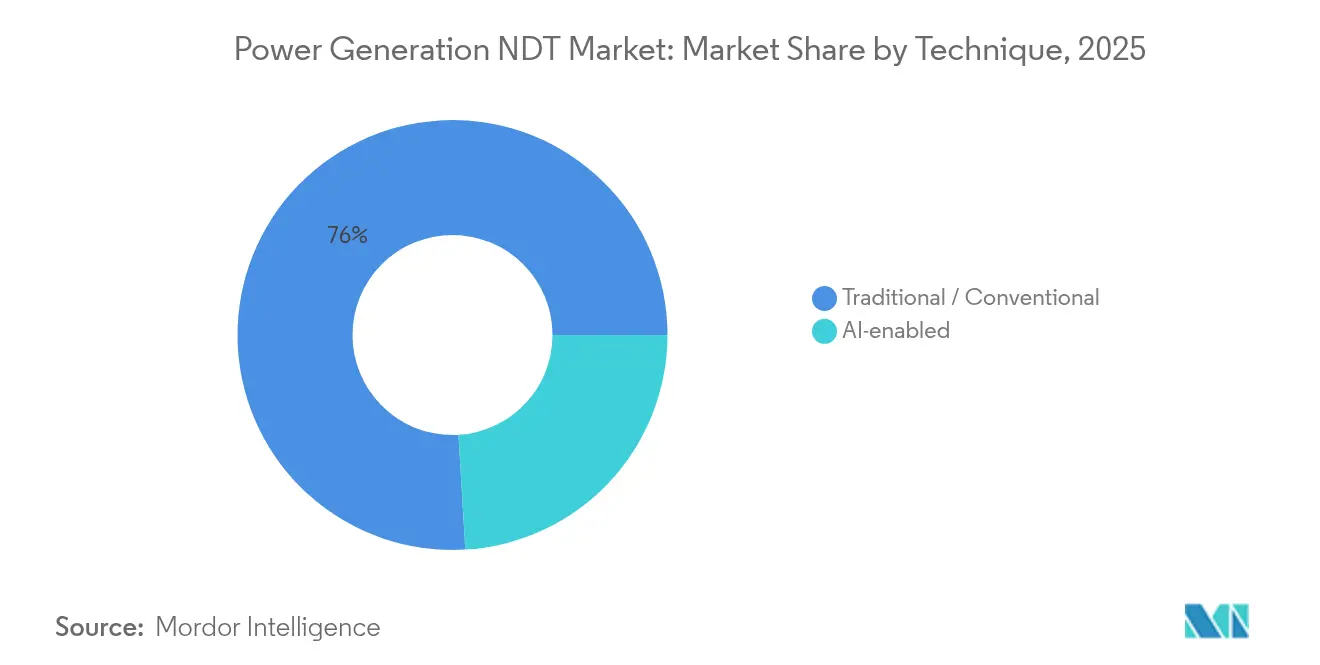
- By technique, traditional approaches held 75.95% of the power generation NDT market share in 2025, while AI-enabled methods are projected to grow at a 6.68% CAGR through 2031.
- By geography, North America accounted for 38.22% of the power generation NDT market size in 2025; the Asia-Pacific region is forecasted to grow at a 6.74% CAGR from 2025 to 2031.
Note: Market size and forecast figures in this report are generated using Mordor Intelligence’s proprietary estimation framework, updated with the latest available data and insights as of 2026.
Market Trends and Insights
Drivers Impact Analysis of Power Generation NDT Market*
| Driver | (~) % Impact on CAGR Forecast | Geographic Relevance | Impact Timeline |
|---|---|---|---|
| Aging thermal-fossil power fleet reaching end-of-life inspection cycles | +1.8% | Global, with concentration in North America and Europe | Medium term (2-4 years) |
| Nuclear life-extension mandates (ASME XI, IAEA periodic safety review) | +1.5% | North America, Europe, Asia-Pacific nuclear markets | Long term (≥ 4 years) |
| Predictive-maintenance programs integrating digital twins and NDT data lakes | +1.2% | Global, early adoption in North America and Europe | Short term (≤ 2 years) |
| Renewables boom driving blade-composite NDT protocols for on-shore/off-shore wind | +0.9% | Global, with emphasis on Europe, North America, and Asia-Pacific | Medium term (2-4 years) |
| Laser-ultrasonic adoption enabling in-service, non-contact boiler inspection | +0.6% | North America and Europe, expanding to Asia-Pacific | Medium term (2-4 years) |
| Tariff-driven regionalization of sensor supply chains improving local availability | +0.4% | Regional impact across all major markets | Short term (≤ 2 years) |
| Source: Mordor Intelligence | |||
Aging Thermal-Fossil Power Fleet Reaching End-of-Life Inspection Cycles
Plant owners in North America and Europe are extending the lives of coal and gas units beyond their original design, which amplifies demand for phased-array ultrasonics and computed tomography to detect creep and fatigue in boiler tubes, steam headers, and turbine casings.[1]U.S. Energy Information Administration, “Electric Power Monthly Report,” eia.gov Inspection intensity peaks during the final operating years, resulting in increased per-facility spending and accelerated equipment replacement. Utilities are opting for automated scanners that reduce outage durations and improve repeatability. Service providers with mobile CT capabilities are winning short-notice call-outs as regulators tighten safety audits. The power generation NDT market benefits because each incremental year of operation mandates deeper and more frequent examinations.
Nuclear Life-Extension Mandates
Regulators require license-renewal applicants to verify the integrity of their vessels, the condition of their steam generator tubes, and the health of their primary piping under ASME XI and IAEA periodic review rules.[2]International Atomic Energy Agency, “Periodic Safety Review for Nuclear Power Plants,” iaea.org ENIQ-qualified procedures cost USD 0.5–2 million each, which entrenches incumbent vendors that already possess validated techniques. Utilities allocate multiyear budgets for outage-specific ultrasonic, eddy-current, and acoustic-emission campaigns, sustaining a predictable revenue stream for certified suppliers. The nuclear segment, therefore, acts as a stability anchor for the power generation NDT market, cushioning cyclical swings in fossil-fired spending. Vendors that combine field robotics with AI-aided interpretation are shortening inspection windows and lowering collective radiation exposure.
Predictive-Maintenance Programs Integrating Digital Twins
Digital twins fuse physics-based models with real-time sensor feeds and historical NDT data, enabling condition-based maintenance plans that defer unnecessary inspections. Data lakes store high-resolution ultrasonic and radiographic files that machine-learning models use to identify degradation patterns, thereby improving failure predictions and spare-parts logistics. Software-as-a-service (SaaS) pricing is gaining traction, transforming one-time equipment sales into recurring revenue streams. Buyers are prioritizing open APIs so that inspection data flows seamlessly into plant information management systems. As early success stories spread, the power generation NDT market is shifting toward outcome-based contracts that reward uptime rather than the number of hours spent on site.
Renewables Boom Driving Blade-Composite NDT Protocols
Wind expansion is spawning a specialized demand niche for composite-blade inspection using drones, thermography, and advanced ultrasonics that can map internal delamination. Offshore wind farms magnify the challenge due to access constraints and harsh marine environments, pushing developers to pre-install robotic crawler tracks that support remote inspections. Seasonal maintenance windows concentrate service demand, prompting asset-light providers to adopt mobile teams equipped with ruggedized phased-array sets. Standards such as IEC 61400-1 are harmonizing inspection practices, encouraging multinational utilities to consolidate vendor panels. Consequently, the power generation NDT market is seeing fresh entrants that focus exclusively on rotor-blade health monitoring.
Restraints Impact Analysis of Power Generation NDT Market*
| Restraint | (~) % Impact on CAGR Forecast | Geographic Relevance | Impact Timeline |
|---|---|---|---|
| Shortage of certified ISO 9712 / ASNT Level III power-sector technicians | -1.4% | Global, most acute in North America and Europe | Long term (≥ 4 years) |
| High capex for phased-array, automated and CT systems | -0.8% | Global, affecting smaller service providers disproportionately | Medium term (2-4 years) |
| Data-overload bottlenecks for high-resolution inspection files | -0.6% | Global, concentrated in advanced NDT adopters | Short term (≤ 2 years) |
| Trade-tariff shocks on specialty piezo / opto components | -0.4% | Global supply chains, regional impact variations | Short term (≤ 2 years) |
| Source: Mordor Intelligence | |||
Shortage of Certified ISO 9712 / ASNT Level III Technicians
A retiree wave and stringent certification timelines have created a 25–30% talent gap that inflates wages and extends project lead times.[3]American Society for Nondestructive Testing, “NDT Personnel Shortage Report 2024,” asnt.org Nuclear projects feel the pinch most acutely because regulators cap crew overtime and mandate dual review of critical scans. Service companies are investing in virtual-reality training modules and AI-driven preliminary screening to ease interpreter workloads, yet field deployment still hinges on scarce senior personnel. Utilities are bundling multi-plant contracts to reserve technician rosters in advance, reducing flexibility for unscheduled outages. This constraint tempers growth in the power generation NDT market by limiting the volume of simultaneous campaigns that can be staffed.
High Capex for Phased-Array, Automated and CT Systems
State-of-the-art phased-array sets cost up to USD 1 million, while fully automated scanners with robotics and analytics software can double that figure. Smaller service providers often face balance-sheet pressure, resorting to rental pools or leasing arrangements that erode their margins. Equipment OEMs are countering with pay-per-scan models that bundle hardware, software, and maintenance under a single subscription, thereby shifting capital expenses to operating expenses. Nonetheless, the sticker shock remains a barrier for new entrants, reinforcing the moderate concentration that characterizes the power generation NDT market.
*Our forecasts treat driver/restraint impacts as directional, not additive. The impact forecasts reflect baseline growth, mix effects, and variable interactions.
Power Generation NDT Market Segment Analysis
By Component:
Equipment Sets the Baseline for Integrated SolutionsEquipment captured 46.12% of the 2025 power generation NDT market share thanks to strong demand for phased-array ultrasonic racks, automated scanners, and high-energy CT gantries. Nuclear license renewals and fossil-plant life-extension projects require multi-modality toolkits that include ultrasonic, eddy-current, and radiographic capabilities. As utilities adopt predictive maintenance, software revenues are climbing at a 7.01% CAGR through 2031, outpacing hardware but still building on a hardware foundation. Cloud-hosted analytics platforms monetize inspection data via subscription, reshaping vendor economics.
Consumables such as couplants, penetrants, and radiographic films deliver recurring revenue that locks customers into OEM ecosystems. Services remain a vital layer because complex codes and qualification regimes push plant operators to outsource rather than maintain in-house crews. The power generation NDT market size for services is projected to swell steadily as personnel shortages intensify. Vendors that bundle equipment leasing with long-term service contracts are achieving double-digit renewal rates. Internal rate-of-return models now weigh lifetime data analytics fees alongside hardware depreciation, refining price-discovery mechanisms.



By Testing Method:
Ultrasonic Retains Primacy While CT AcceleratesUltrasonic testing accounted for 34.15% of the power generation NDT market size in 2025, reflecting its versatility across various materials, including metals, composites, and welds. Phased-array configurations increase scan coverage without repositioning, improving outage productivity. Computed tomography, although niche, is advancing at an 7.62% CAGR as blade composites, additive-manufactured parts, and complex castings require volumetric visualization.
Radiographic testing remains mandated for certain pressure-part welds, particularly in nuclear primary circuits. Eddy-current arrays dominate steam generator tube inspections, where stress corrosion cracking often lurks beneath the inner diameters. Acoustic emission monitoring is gaining adoption as a real-time technique for monitoring rotating machinery, complementing periodic ultrasonic inspections. Thermography extends beyond motor control centers to mechanical insulation surveys, which pinpoint heat-loss hotspots. As workloads diversify, mixed-method work scopes are becoming the norm, encouraging OEMs to offer modular platforms. Cross-calibration routines accelerate job mobilization and reduce data-fusion errors, thereby strengthening the power generation NDT market proposition.
By Technique:
AI-Enabled Approaches Transform Interpretation WorkflowsTraditional methods still accounted for 75.95% of 2025 revenue, as regulators and insurers continue to cling to proven practices. Yet, AI-enabled workflows are projected to post a 6.68% CAGR through 2031, as deep-learning algorithms surpass human interpreters in repeatability and low-contrast defect recognition. Early use cases focus on automated weld assessment, where models trained on thousands of image slices can classify porosity, lack of fusion, and slag inclusions within seconds.
In blade composites, convolutional networks flag delamination zones that manifest only subtle phase shifts. OEMs embed accelerators directly in portable instruments, enabling edge inference without cloud latency. Validation remains the gating factor: utilities demand statistical evidence of false-alarm rates that align with code requirements. Hybrid reporting formats, where AI pre-labels indications and certified inspectors sign off, are emerging as the acceptable compromise. Over time, accumulated training data will shrink the confidence interval, driving deeper AI penetration and reshaping the cost curve of the power generation NDT market.
Geography Analysis
North America Power Generation NDT Market
North America accounted for 38.22% of 2025 revenue in the power generation NDT market, driven by over 90 U.S. reactor license renewals and a backlog of coal-plant end-of-life inspections. Canada’s CANDU refurbishments and Mexico’s grid-modernization projects add further momentum. Well-defined regulatory frameworks ease equipment qualification, while deep service supply chains enable multi-crew deployments during condensed outage windows.
APAC Power Generation NDT Market
The Asia-Pacific region is the fastest-growing region, with a 6.74% CAGR to 2031, driven by Chinese reactor buildouts, Indian coal fleet modernization, and Southeast Asian renewable energy targets. Local OEMs are scaling phased-array production, compressing lead times and lowering acquisition costs. Regional governments offer tax credits for AI-enabled inspection systems, accelerating digital adoption. Training academies in China and Singapore are expanding ISO 9712 capacity, gradually narrowing the technician gap.
Europe Power Generation NDT Market
Europe maintains steady growth, underpinned by stringent nuclear directives from ENSREG that require periodic safety reviews encompassing ultrasonic, radiographic, and eddy-current methods. Germany’s nuclear phase-out still needs intensive decommissioning scans, while France’s fleet life-extension hinges on ENIQ-qualified procedures. Offshore wind expansion across the North Sea is spawning specialized composite-blade inspection demand. Harmonized EN ISO standards encourage cross-border service contracts, making Europe a competitive yet accessible arena within the wider power generation NDT market.


Regulatory Landscape
Regulation for power generation NDT is anchored in code-based in-service inspection, particularly in nuclear, where ASME BPVC Section V (Nondestructive Examination) and ASME Section XI frameworks shape technique qualification, documentation, and personnel competency requirements. In the United States, the Nuclear Regulatory Commission (NRC) continues to update the compliance environment through guidance and rulemaking, including NUREG-1482, Revision 4 (issued October 2025) for in-service testing programs and a Federal Register final rule (February 2026) that permits use of specified ASME code cases as voluntary alternatives for NDE personnel qualification, including acceptance of a five-year recertification interval.
Internationally, the International Atomic Energy Agency (IAEA) supports harmonization through technical guidance for in-service inspection programs and capacity building. Coordination mechanisms such as the April 2025 Practical Arrangements signed between the IAEA and the International Committee for Non-Destructive Testing (ICNDT) reinforce alignment on training and certification practices across jurisdictions. Together, national regulator requirements (including NRC) and internationally recognized frameworks increase the need for traceable, auditable inspection records and validated procedures, especially for license renewal, periodic safety review, and life-extension work scopes.
Value Chain Analysis
The power generation NDT value chain starts with component suppliers for probes, sensors, imaging chains, and radiographic sources, then moves to equipment OEMs that build ultrasonic, radiographic, and CT platforms and embed analytics software. Service providers follow, mobilizing certified crews to deliver code-compliant inspection and reporting. Utilities, OEMs, and EPC contractors set acceptance criteria and inspection workflows through specifications and purchasing requirements; for example, GE Vernova has published NDT and NDE requirements for suppliers (EC-SRC-0003), reinforcing standardized processes that flow down to subcontractors and inspection partners.
Service delivery and qualification are major choke points, driven by the shortage of ISO 9712 and ASNT Level III personnel and constraints around specialized inputs such as radiographic isotopes (including Iridium-192) for certain radiography use cases. Qualification ecosystems under ASME BPVC, as well as EPRI programs such as PDI and industry guidance including MRP-227, Rev. 2-A, increase switching costs and favor vendors that can supply validated procedures, field robotics, and secure data handling. Technique qualification activity, such as Framatome qualifying an ultrasonic weld inspection technique for pressurized water reactor core barrels in the United States (March 2026), shows how procedure validation sits between OEM capability and service execution, shaping which providers can bid on high-criticality nuclear scopes.
Competitive Landscape
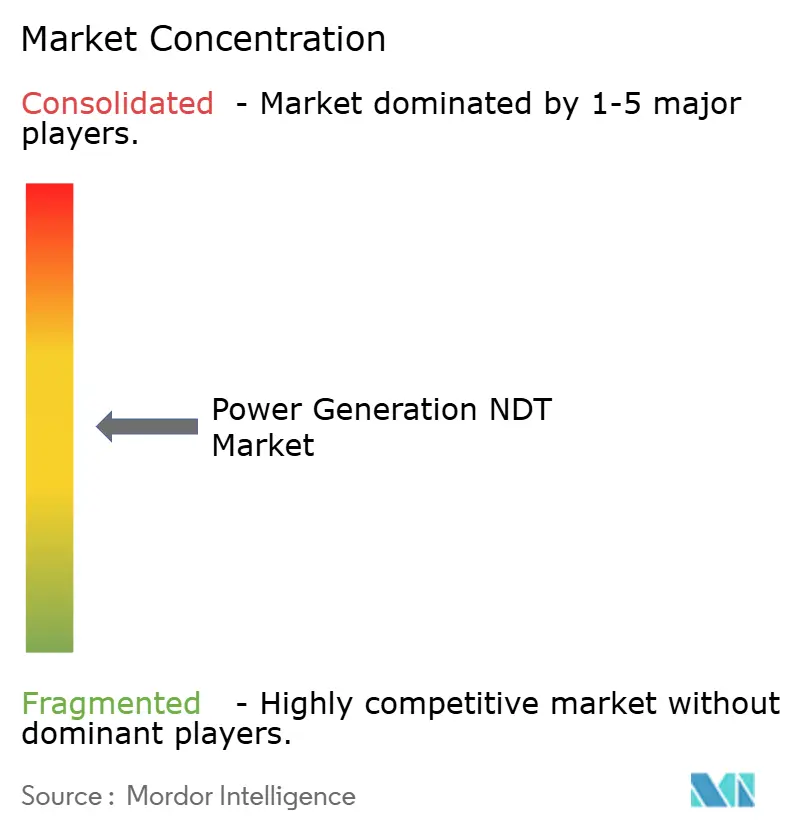
The power generation NDT market exhibits moderate concentration, as validated nuclear procedures, global service hubs, and proprietary analytics platforms create defensible moats. Baker Hughes’ Waygate Technologies division anchors its leadership through a cradle-to-grave equipment line, field robotics, and AI libraries tuned for reactor environments. Olympus, rebranded as Evident, continues to command a significant share of the ultrasonic system market despite divesting non-core assets, leveraging ergonomic, portable sets that reduce technician fatigue.[4]Olympus Corporation, “Consolidated Financial Results FY 2025,” olympus-global.com
MISTRAS Group posted USD 36.5 million in 2024 power-sector revenue, pairing asset-light ultrasonic crews with cloud dashboards that benchmark wall-thickness trends across fleets. Eddyfi Technologies is scaling through targeted acquisitions that add composite expertise for wind applications, while Screening Eagle Technologies utilizes fresh venture funding to accelerate the development of inspection robotics. Competition increasingly hinges on data analytics sophistication rather than probe sensitivity alone.
OEMs and service firms are forming joint ventures to create integrated teams that can bid on turnkey scopes encompassing equipment rental, data acquisition, and analytics. Framework agreements spanning multiple plants are common, locking in vendor panels for five-year horizons. Across the board, investment priorities center on AI model validation, automated scanner mobility, and secure data pipelines that comply with nuclear cybersecurity mandates. These moves collectively intensify rivalry but also expand the addressable power generation NDT market.
Power Generation NDT Industry Leaders
Baker Hughes Company
Mistras Group Inc.
SGS S.A.
Intertek Group plc
Applus Services S.A.
- *Disclaimer: Major Players sorted in no particular order
Power Generation NDT Market Companies Covered in this Report
- Baker Hughes Company
- Mistras Group Inc.
- SGS S.A.
- Intertek Group plc
- Applus Services S.A.
- Bureau Veritas S.A.
- Olympus Corporation (Evident)
- Eddyfi Technologies
- TEAM Inc.
- Acuren Group Inc.
- TÜV Rheinland AG
- DEKRA SE
- Element Materials Technology
- Zetec Inc.
- Sonatest Ltd.
- Screening Eagle Technologies AG
- YXLON International GmbH
- Karl Deutsch Prüf- und Messgerätebau GmbH
- Cygnus Instruments Ltd.
- NOVO Test Ltd.
- Sonotron NDT
- Vibra-tion NDT Services Pvt. Ltd.
- Industrial Inspection and Analysis Inc.
- Premier NDT Services Inc.
- Ether NDE Ltd.
- Toshiba Energy Systems and Solutions Corp.
- Buffalo Inspection Services

Market Opportunities and Future Outlook
Robotics-based inspection is opening capacity by reducing outage time and access constraints for assets that typically require extensive disassembly. The generator inspection robot jointly developed by The Hong Kong Polytechnic University and CLP Power (April 2026) targets the air gap between generator rotor and stator for visual inspection and related assessments without removing the rotor. Deployments like this support service models that combine specialized hardware with repeatable digital workflows, aligning with utility efforts to standardize inspection data for digital twins.
There is also room to expand autonomous data capture for renewable and electrical infrastructure assets, feeding inspection data lakes and analytics platforms. In July 2026, vHive introduced an autonomous multi-drone platform for utility-scale solar inspections that integrates thermal imaging, RGB mapping, and digital twin creation, reducing dependence on specialized pilots for large-site surveys. Formal benchmarking work, including EPRI virtual round robin testing in 2026 for AI-assisted NDE performance (targeting ultrasonic inspection of dissimilar metal welds in nuclear applications), supports the qualification-driven pathway for wider operational use of AI-enabled interpretation. This, in turn, can accelerate adoption of integrated software, data governance, and interoperable reporting architectures.
Recent Industry Developments in Power Generation NDT Market
- July 2026: Baker Hughes signed a multi-year strategic agreement with Kodiak Gas Services to provide gas turbines and BRUSH Power Generation equipment supporting 1 GW of power generation capacity by 2030. The program expands the installed base of rotating equipment that requires recurring inspection and integrity programs, supporting demand for advanced NDT across generators, turbines, and associated balance-of-plant assets.
- December 2025: MISTRAS Group was awarded an NDT services contract by Bechtel for Woodside's USD 17.5 billion Louisiana LNG terminal. Large multi-year energy infrastructure scopes typically increase demand for qualified field inspection teams and can drive greater use of bundled NDT services and digital execution platforms to manage documentation and compliance.
- December 2024: Screening Eagle Technologies raised USD 15 million in Series B funding to develop inspection robotics and cloud analytics for power-sector clients. The financing supports product development in automation and data-driven inspection workflows that reduce manual labor intensity and improve repeatability for utility and power plant inspection programs.


Power Generation NDT Market Report Scope and Research Methodology
Market Definition and Coverage
This market covers revenue generated from non-destructive testing used to inspect and monitor power generation assets, including testing equipment, related software, and associated inspection services used at plant and component level.
Scope exclusions: It does not count destructive testing, general OEM maintenance labor that is not inspection-led, or monitoring that is purely operational without an NDT inspection outcome.
Segments Covered in This Report
- By Component
- Equipment
- Software
- Services
- Consumables
- By Testing Method
- Ultrasonic Testing
- Radiographic Testing
- Magnetic Particle Testing
- Liquid Penetrant Testing
- Visual Inspection Testing
- Eddy-Current Testing
- Acoustic Emission Testing
- Thermography / Infrared Testing
- Computed Tomography Testing
- By Technique
- Traditional / Conventional
- AI-enabled
- By Geography
- North America
- United States
- Canada
- Mexico
- South America
- Brazil
- Argentina
- Rest of South America
- Europe
- Germany
- United Kingdom
- France
- Italy
- Spain
- Rest of Europe
- Asia-Pacific
- China
- Japan
- India
- South Korea
- South-East Asia
- Rest of Asia-Pacific
- Middle East
- Saudi Arabia
- United Arab Emirates
- Turkey
- Rest of Middle East
- Africa
- South Africa
- Nigeria
- Rest of Africa
- North America
Data Sources, Market Sizing, and Validation
Desk Research
We started by building a practical picture of the installed base of power assets and the inspection cadence that typically follows major codes and reliability programs. Public sources were used to anchor this, including U.S. Energy Information Administration generation and capacity data, U.S. Nuclear Regulatory Commission inspection and outage related publications, Eurostat energy statistics, International Energy Agency power sector indicators, and International Renewable Energy Agency capacity additions.
Next, we reviewed technical adoption signals for common NDT methods across turbines, boilers, piping, and balance-of-plant, using sources such as ASTM and ASME code references, selected peer-reviewed papers, and safety guidance published by regulators. Company filings, investor presentations, and reputable press were used to understand product mix changes such as digital radiography, phased array ultrasonic testing, and software attachments. We also used paid subscriptions for company financials and intelligence, patent lookups, and shipment-level import and export checks to validate cross-border equipment movement. The desk sources listed here are illustrative, and other public documents and datasets were also used for data collection, validation, and clarification.
Primary Interviews and Surveys
To reduce gaps left by published data, we relied on interviews and short surveys with inspection service providers, plant operators, equipment makers, and channel partners that sell or rent NDT instruments. Coverage was balanced across large utilities and independent generators, and it was extended across APAC, EMEA, and the Americas so assumptions on outage cycles, method mix, and pricing behavior could be checked by region.
Distribution of primary research fieldwork respondents
| Company type | Respondent position | Region |
|---|---|---|
| Top tier: 30% | CXOs: 12% | APAC: 39% |
| Mid tier: 56% | Functional/Unit leaders: 41% | EMEA: 34% |
| Smaller Players: 14% | Managers: 47% | Americas: 27% |
Market-Sizing & Forecasting
The core sizing used a top-down build that reconstructs the demand pool from power generation capacity by fuel type, typical inspection frequency around planned outages, and the share of assets that require higher-value methods for critical components. These totals were then corroborated with selective bottom-up checks, including sampled instrument shipments multiplied by realistic average selling prices, and service revenue roll-ups built from interviewed provider throughput and day-rate norms.
Key model inputs included the installed base of thermal and nuclear units, outage and turnaround cycles, typical inspection scope for boilers, piping, and turbines, method mix shifts toward ultrasonic and digital radiography, and regional labor and compliance intensity that changes service content. Where direct values were missing for smaller countries, ratios were applied from comparable fleets and then adjusted using expert feedback on local contracting and inspection coverage.
Forecasting leaned on scenario analysis tied to capacity additions and retirements, life-extension programs, and policy-driven reliability spending, followed by smoothing to avoid overreacting to one-time outage spikes. Assumptions on pricing and method substitution were refreshed using primary feedback so the final growth path stayed consistent with what buyers and providers expect to see in contracts.
Data Validation & Update Cycle
We validated outputs by comparing implied spend per MW and spend per outage cycle against independently observable signals, including public capacity trends and the pace of major maintenance events reported by utilities. If any country or region showed unusual jumps, the input drivers were rechecked, and follow-up calls were triggered to confirm whether it was a real change or a modeling artifact.
Before sign-off, the model goes through multi-step analyst reviews where assumptions, unit conversions, and currency handling are re-verified. Totals are then reconciled back to component and method shares. Reports are refreshed annually, and interim updates are made when material events occur, such as major regulatory shifts or sudden capacity changes. Before delivery, a final pass is completed so clients receive the most current view available at that time.
Mordor Intelligence's Power Generation Non Destructive Testing Market Size Compared With Other Published Estimates
Published market numbers for power generation NDT often differ because the scope lines are drawn differently, and because each publisher uses its own way to blend equipment, software, and service revenues across regions. We also see gaps when currency timing, base year selection, and the assumed inspection intensity for aging fleets are handled differently.
In practice, the largest splits usually come from whether the estimate includes only power generation sites or also adds adjacent industrial inspections, and whether the model counts software and data layers that are bundled with hardware. Some studies assume a slower shift in method mix, which changes the implied average selling price and service content per outage, and others extend forecast windows where fewer real-world checkpoints exist. By keeping the total tied to power-plant driven inspection cycles and counting equipment plus software only when it is directly sold into generation inspection workflows, the spread versus broader TIC-style totals becomes easier to explain, which is how it is treated here by Mordor Intelligence.
Benchmark comparison
| Source | Market Size | Gaps in Research Methodology |
|---|---|---|
| Mordor Intelligence | USD 4.44 B (2026) | |
| Trade Publisher A | USD 5.73 B (2025) | Uses an earlier base year and a longer forecast window, and it appears to blend services and equipment across a wider set of power-related end uses, which can lift the total versus a plant inspection-only demand pool. |
| Industry Analytics B | USD 4.18 B (2022) | Anchors sizing to an older historical point, and the stated segmentation suggests a narrower mix of digital software attachments and newer methods, which can keep the value lower versus a more updated method-mix and pricing path. |
Overall, the comparison shows that the biggest drivers of dispersion are timing (base year), what gets counted as power-generation-specific activity, and how method mix and software attachments are priced into the total. When those items are clarified and checked with operator and provider feedback, the market size becomes more traceable to real inspection cycles and repeatable calculations.


Key Questions Answered in the Report
How large is the power generation NDT market in 2026?
The power generation NDT market size is USD 4.44 billion in 2026 and is projected to grow to USD 5.98 billion by 2031 at a 6.16% CAGR.
Which component segment is growing fastest?
Software is the fastest-expanding component, posting a 7.01% CAGR as AI-enabled analytics platforms gain traction among utilities.
What factor drives the strongest near-term demand?
Aging coal and gas units undergoing end-of-life assessments are triggering intensive ultrasonic and CT inspection campaigns, especially in North America and Europe.
Why is ultrasonic testing still dominant?
Ultrasonic testing balances depth penetration, portability, and regulatory acceptance, allowing it to handle thick steel sections in reactors and turbines while meeting code requirements.
How are digital twins influencing NDT purchasing?
Digital twins need structured inspection data, prompting buyers to select integrated hardware-software suites that automatically feed cloud analytics and enable condition-based maintenance.
What is constraining market growth?
A global shortage of certified ISO 9712 and ASNT Level III technicians limits the number of concurrent projects that can be staffed, slowing service rollout despite strong demand.
Page last updated on:





