Visual Inspection (VT) Market Size and Share
Market Overview
| Study Period | 2019 - 2030 |
|---|---|
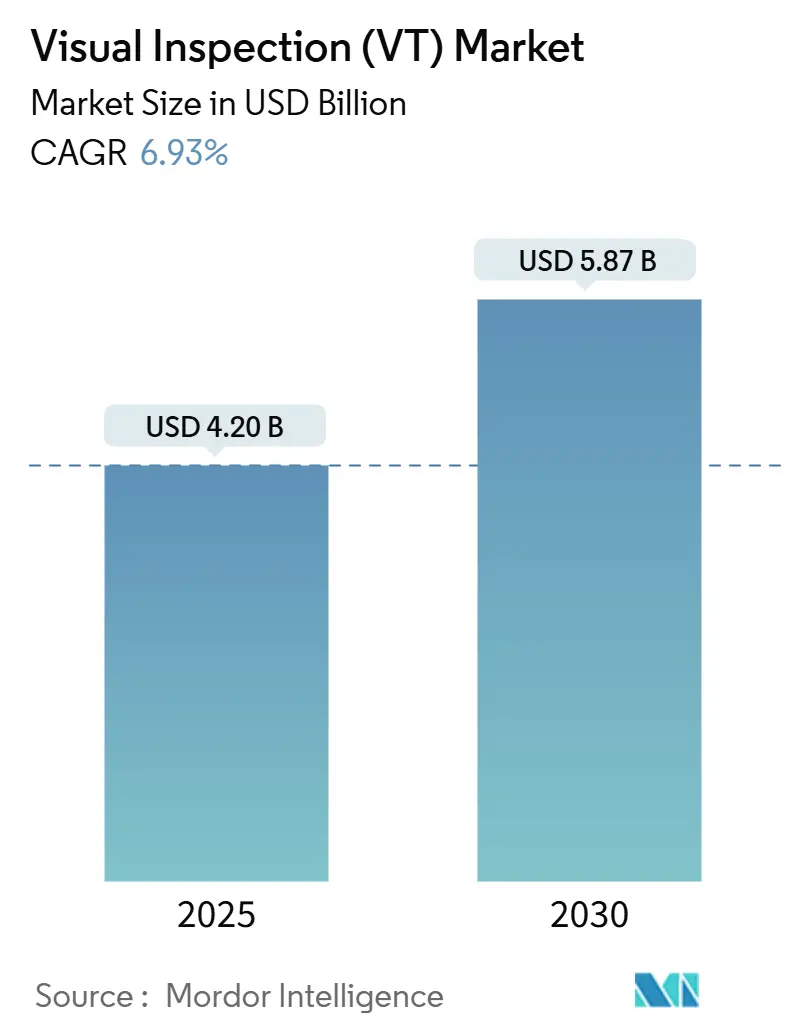
| Market Size (2025) | USD 4.20 Billion |
| Market Size (2030) | USD 5.87 Billion |
| Growth Rate (2025 - 2030) | 6.93% CAGR |
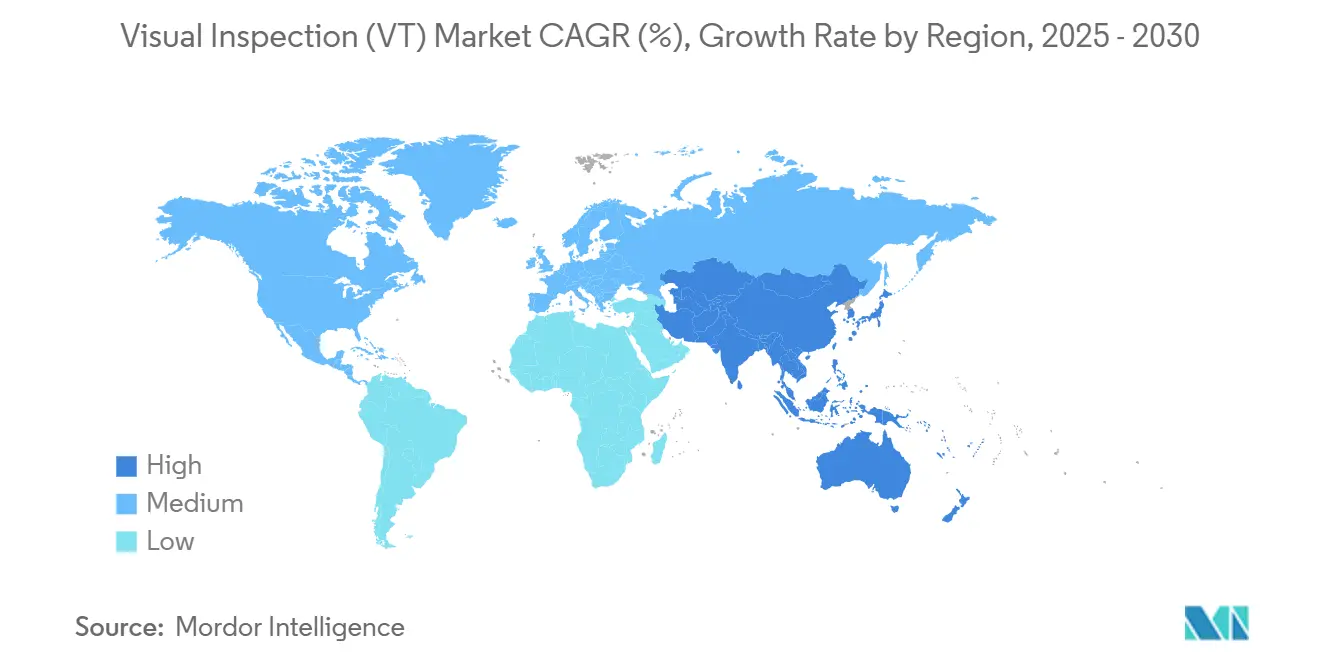
| Fastest Growing Market | Asia Pacific |
| Largest Market | Asia Pacific |
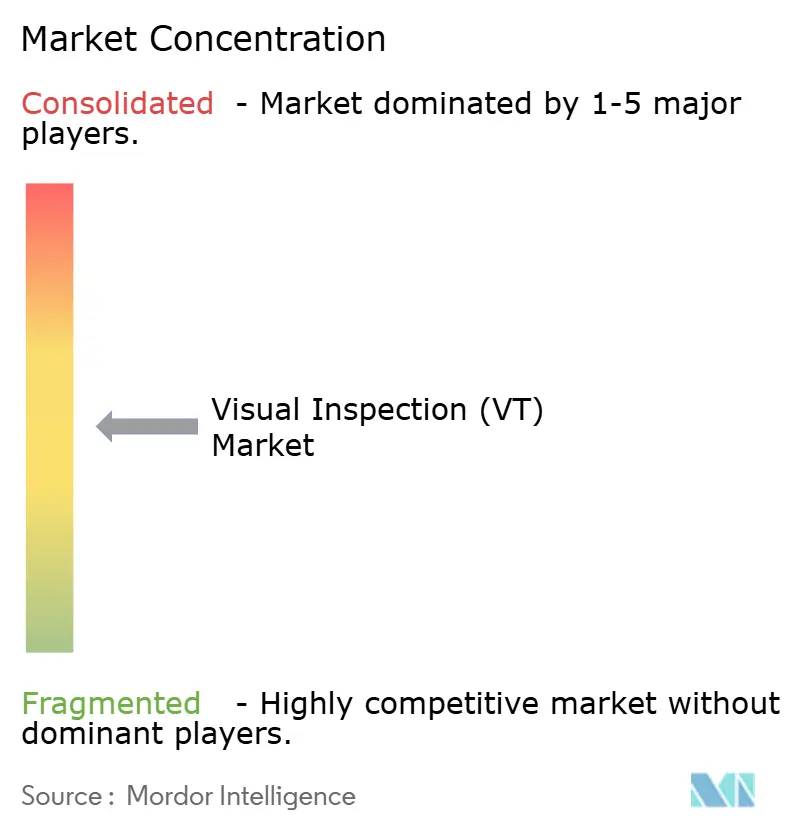
| Market Concentration | Medium |
Major Players *Disclaimer: Major Players sorted in no particular order Image © Mordor Intelligence. Reuse requires attribution under CC BY 4.0. | |
Visual Inspection (VT) Market Analysis by Mordor Intelligence
The visual inspection market size reached USD 4.20 billion in 2025 and is forecast to climb to USD 5.87 billion by 2030, registering a 6.93% CAGR. The continued integration of artificial intelligence into non-destructive testing drives this expansion by enhancing defect detection accuracy, reducing inspection cycles, and enabling predictive maintenance. Demand is reinforced by mandatory quality regulations in the aerospace and defense sectors, rising investments in infrastructure rehabilitation, and the manufacturing industry’s push to automate labor-intensive tasks. As inspection tasks migrate from manual methods to AI-guided vision systems, vendors compete on software intelligence, connectivity, and the ability to deliver complete workflow solutions. The visual inspection market further benefits from the expansion of renewable-energy assets and tightening environmental, social, and governance (ESG) audit requirements, which favor continuous, data-rich inspection approaches.
Key Report Takeaways
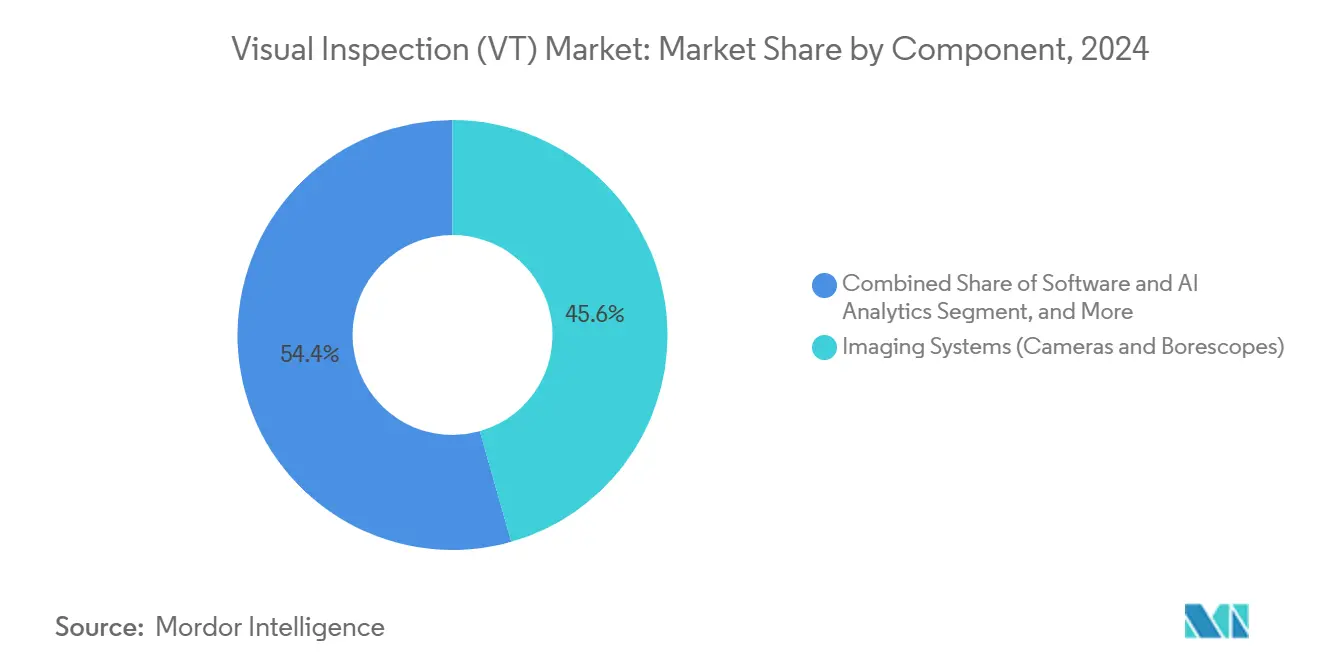
- By component, imaging systems held 45.6% of the visual inspection market share in 2024, while software and AI analytics are projected to record an 11.3% CAGR through 2030.
- By portability, portable and handheld equipment commanded 46.1% of the visual inspection market size in 2024; meanwhile, automated and robotic solutions are projected to advance at a 13.7% CAGR through 2030.
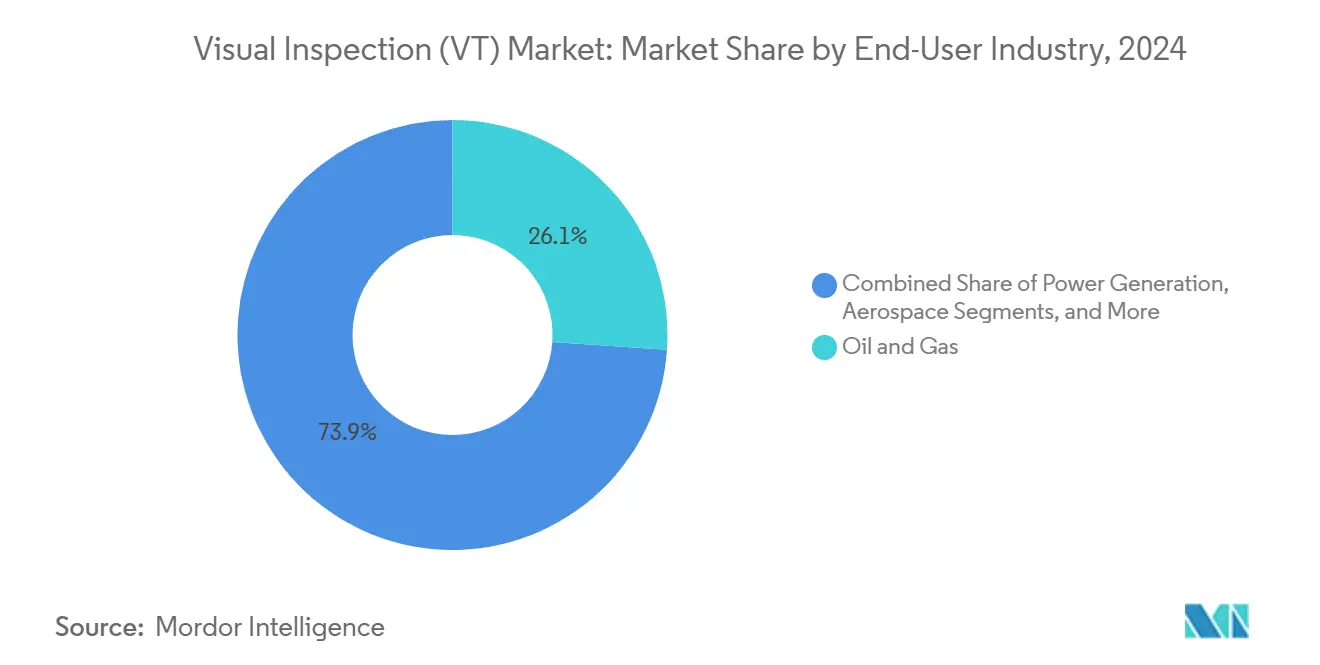
- By end-user industry, the oil and gas sector led with a 26.1% revenue share in 2024, whereas the automotive and transportation sector is forecast to expand at a 10.5% CAGR through 2030.
- By geography, the Asia-Pacific region captured 36.2% of 2024 revenues and is projected to grow at an 8.4% CAGR through 2030.
Global Visual Inspection (VT) Market Trends and Insights
Drivers Impact Analysis*
| Driver | (~) % Impact on CAGR Forecast | Geographic Relevance | Impact Timeline |
|---|---|---|---|
| Rising adoption of NDT standards in oil and gas | +1.2% | Global – Middle East, North America | Medium term (2-4 years) |
| Stringent safety and quality regulations in aerospace and defense | +1.8% | North America, Europe, and emerging Asia-Pacific | Long term (≥ 4 years) |
| Demand for automated inspection to reduce labor costs | +2.1% | Global – Asia-Pacific, North America | Short term (≤ 2 years) |
| Aging infrastructure maintenance spending | +1.4% | North America, Europe, Asia-Pacific | Long term (≥ 4 years) |
| AI-powered defect recognition in micro-electronics | +1.7% | Asia-Pacific core, spill-over North America | Medium term (2-4 years) |
| ESG audits of solar and wind farms | +0.9% | Europe, North America, Global | Medium term (2-4 years) |
| Source: Mordor Intelligence | |||
Rising Adoption of NDT Standards in Oil and Gas
API RP 574 and comparable guidelines now prescribe enhanced visual inspection for pressure vessels and pipelines, prompting energy operators to invest in drone-supported cameras, crawler robots, and AI-enabled analytics that reduce offshore inspection costs by up to 60%.[1]American Petroleum Institute, “API RP 574 – Inspection Practices for Piping System Components,” api.org Adoption is strongest in regions with extensive pipeline mileage, where real-time image analytics mitigate leak risk during live operations. Automated platforms withstand hazardous atmospheres and eliminate rope-access exposure, aligning with operator safety benchmarks. As digital radiography and visual mapping converge, maintenance teams can prioritize repairs during tight shutdown windows, ensuring regulatory compliance while minimizing supply disruptions.
Stringent Safety and Quality Regulations in Aerospace and Defense
Federal Aviation Administration rules and allied defense standards now demand defect-detection thresholds that exceed human capability for composite wings, additive-manufactured brackets, and high-temperature turbine parts. Automated vision systems integrated with AI increase flaw identification accuracy by 40% and decrease false rejects, directly fueling throughput in aircraft assembly lines. Contractors achieving NADCAP approval benefit from complete traceability and statistical process control, which in turn reduces certification cycles. The resulting datasets feed predictive models that alert maintenance crews to crack initiation well before scheduled checks, boosting aircraft availability and cutting unscheduled downtime costs.
Demand for Automated Inspection to Reduce Labor Cost
Thirty percent of certified visual testing specialists are older than 55, creating a global talent gap that incentivizes the use of automation.[2]American Society for Nondestructive Testing, “NDT Workforce Development and Certification Standards,” asnt.org Entry-level automated cells, priced from USD 30,000, achieve an 18-24 month payback through reduced shift staffing and consistent pass/fail decisions. High-volume electronics and automotive producers report round-the-clock operation without the fatigue-related errors inherent to human inspectors. Cloud-linked systems populate enterprise dashboards with first-pass yield metrics, empowering plant managers to correct process drift at its earliest sign and avoid costly scrap.
Aging Infrastructure Maintenance Spending
The American Society of Civil Engineers estimates USD 2.6 trillion in U.S. infrastructure investment through 2029, a portion of which targets advanced inspection for bridges, tunnels, and power assets. AI-guided vision rigs mounted on autonomous crawlers now detect concrete spalls and corrosion pits with millimeter precision, supporting data-driven asset life extension programs. Utilities employ similar systems to scan turbine blades and transformers, preventing catastrophic failures and enhancing grid resilience. When paired with IoT gateways, these platforms enable continuous structural health monitoring, transforming budgeting from reactive repairs to proactive upkeep.
Restraints Impact Analysis*
| Restraint | (~) % Impact on CAGR Forecast | Geographic Relevance | Impact Timeline |
|---|---|---|---|
| Shortage of certified visual testing technicians | -0.8% | Global – North America, Europe | Short term (≤ 2 years) |
| High cost of robotic inspection systems | -1.1% | Global – emerging markets | Medium term (2-4 years) |
| Data-liability concerns for cloud-connected devices | -0.6% | Global – varies by regulation | Short term (≤ 2 years) |
| Image-sensor supply chain volatility | -0.9% | Global – Asia-Pacific hubs | Short term (≤ 2 years) |
| Source: Mordor Intelligence | |||
Shortage of Certified Visual Testing Technicians
Two-thirds of Level III inspectors approach retirement within ten years, outpacing graduate inflow and inflating wage bills for the remaining talent. Complex weld verification still requires expert judgment, meaning service providers must strike a balance between human oversight and automation. Recruitment lags prolong project schedules, and some mid-sized contractors decline tenders due to insufficient staffing. Expanded training pipeline funding and remote-mentor programs have begun, but near-term labor scarcity persists.
High Cost of Robotic Inspection Systems
Turnkey robotic vision workcells cost USD 100,000-750,000 before software licensing and line integration, a hurdle for small manufacturers.[3]Cognex Corporation, “Manufacturing Automation ROI Analysis and Case Studies,” cognex.com The total cost of ownership roughly doubles over five years once maintenance contracts, spare parts, and operator retraining are factored in. Semiconductor shortages have lengthened delivery lead times, forcing buyers to postpone capital expenditures. Where product mix varies, operators hesitate because redeploying hard-tooled robotics requires external engineering support, which further delays the return on investment.
*Our forecasts treat driver/restraint impacts as directional, not additive. The impact forecasts reflect baseline growth, mix effects, and variable interactions.
Segment Analysis
By Component – Software Intelligence Drives Hardware Evolution
Software and AI analytics are projected to grow at a 11.3% CAGR by 2030, whereas imaging hardware is expected to retain the largest share in 2024 at 45.6%. The visual inspection market relies on convolutional neural networks that self-learn defect classes, allowing manufacturers to reconfigure inspection rules without coding downtime. Lighting upgrades using high-output LEDs enhance edge detection in low-contrast materials. Accessory and consumable demand remains stable as lenses, cables, and calibration targets require periodic replacement. Services that bundle system rental, data analysis, and operator upskilling deliver subscription revenue, offsetting capital barriers for cost-sensitive buyers.
GE Aviation reduced turbine-blade inspection time from 45 minutes to 3 minutes by utilizing an AI vision platform, achieving a 99.8% detection accuracy. Cloud-hosted analytics distributes model updates to multiple plants overnight, standardizing quality metrics worldwide. Such capabilities enable the visual inspection market size for software subscriptions to outpace hardware revenue beyond 2028. Vendors differentiate through open APIs that integrate with manufacturing execution systems and industrial IoT stacks, ensuring data portability and enterprise-level cybersecurity.


By Portability – Automation Transforms Inspection Economics
Portable and handheld devices accounted for 46.1% of 2024 revenue as field crews rely on lightweight cameras, borescopes, and tablets. Nonetheless, automated and robotic stations are projected to expand at a 13.7% CAGR through 2030. Robotics eliminates safety hazards in nuclear, petrochemical, and confined-space environments, enabling 24-hour operations without fatigue. Voliro’s aerial robots, deployed through partnerships with the three largest U.S. NDT service providers, finish flare-stack and storage-tank surveys up to ten times faster than rope-access teams.
Stationary benchtop machines excel in electronics and medical device assembly, where positional repeatability surpasses that of human dexterity. Automated cells are increasingly combining optical, ultrasonic, and thermal sensors to generate multimodal datasets in a single scan. Handheld units evolve through 5G links that offload imagery to edge servers for near-real-time AI analysis, blending portability with enterprise-wide data visibility.
By End-User Industry – Automotive Electrification Accelerates Demand
Oil and gas accounted for 26.1% of 2024 revenue, but automotive and transportation are expected to post the fastest growth rate of 10.5% through 2030. Battery and electric-motor production introduce microscopic defect criteria that autonomous vision consistently meets. BMW’s Spartanburg plant retrained AI models for new EV components within 48 hours, compared to six weeks under rule-based systems, demonstrating the agility critical to flexible manufacturing.
Aerospace, defense, and power generation sustain above-average spending due to safety mandates. Electronics fabrication requires sub-micron resolution optics paired with AI algorithms that surpass the capabilities of human inspectors for detecting chip-level faults. Marine and shipbuilding shift to drone inspection to limit dry-dock downtime, while mining seeks ruggedized portable cameras for ore-conveyor integrity.
Geography Analysis
Asia-Pacific captured 36.2% of 2024 revenue and is forecast to grow at 8.4% CAGR through 2030. China’s drive to mitigate rising labor costs accelerates the adoption of fully automated cells in electronics and appliance lines. Japan leverages precision robotics in automotive and semiconductor plants, spurring domestic suppliers to pioneer advanced optics and lighting modules. India’s industrial corridors are investing in AI-assisted vision to meet export-quality mandates and overcome technician shortages.
North America ranks second, powered by aerospace certification demands and shale energy infrastructure that relies on pipeline integrity mapping. The visual inspection market size within the region benefits from defense R&D funding directed to autonomous swarm drones for large-area survey. Europe emphasizes ESG compliance, deploying AI vision across wind-turbine blades and solar farms to document sustainability metrics. The Middle East and Africa are expanding their oil-export capacity and erecting utility-scale photovoltaics, necessitating remote vision in harsh desert environments. South America is gradually modernizing its mining railways and offshore platforms, importing turnkey robotic inspection skids that can withstand corrosive marine climates.

Competitive Landscape
The visual inspection market remains moderately fragmented, with top players commanding mid-teens shares, while niche specialists thrive through software innovation. Olympus and Baker Hughes are pushing multisensor platforms that pair visual, ultrasonic, and eddy-current modules for aerospace certifications. Cognex integrates deep-learning software into smart cameras that adapt to variable lighting on high-mix assembly lines. Wabtec’s USD 300 million acquisition of Evident’s Inspection Technologies doubled its addressable digital-inspection revenue and broadened access to rail and mining clients.[4]Wabtec Corporation, “Acquisition of Evident’s Inspection Technologies Division,” wabtec.com
Start-ups focus on cloud-native analytics, zero-code model training, and subscription pricing that lowers entry thresholds. Partnerships proliferate: legacy NDT equipment makers license AI intellectual property to accelerate roadmap delivery, while AI firms seek hardware allies to validate real-time inference on-device. Suppliers differentiate themselves by offering open-architecture designs, allowing end-users to easily bolt on third-party algorithms and avoid vendor lock-in. As compliance bodies refine the ISO 9712 and ASNT SNT-TC-1A standards, vendors must certify both equipment and data governance protocols to secure enterprise contracts.
Visual Inspection (VT) Industry Leaders
Olympus Corporation
Baker Hughes Company (Waygate Technologies)
Eddyfi Technologies Inc.
MISTRAS Group Inc.
Zetec Inc.
- *Disclaimer: Major Players sorted in no particular order

Recent Industry Developments
- July 2025: Wabtec Corporation completed the USD 300 million acquisition of Evident’s Inspection Technologies division, expanding digital-intelligence capabilities across rail and mining assets.
- June 2025: Nordic Inspekt Group agreed to purchase NDT Inspection and Consulting Oy and Ropetech Oy for EUR 10 million (USD 11.3 million), strengthening Nordic testing capacity.
- April 2025: MISTRAS Group launched MISTRAS Data Solutions, unifying software platforms PCMS® and New Century Software under one digital-services umbrella.
- March 2025: Testia completed the integration of InFactory Solutions, adding automated inspection to its production-automation portfolio.


Global Visual Inspection (VT) Market Report Scope
| Imaging Systems (Cameras and Borescopes) |
| Lighting and Optics |
| Software and AI Analytics |
| Accessories and Consumables |
| Services (Inspection, Rental, Training) |
| Portable / Handheld |
| Stationary / Benchtop |
| Automated / Robotic |
| Oil and Gas |
| Power Generation |
| Aerospace |
| Defense |
| Automotive and Transportation |
| Manufacturing and Heavy Engineering |
| Construction and Infrastructure |
| Chemical and Petrochemical |
| Marine and Ship Building |
| Electronics and Semiconductor |
| Mining |
| Medical Devices |
| Others |
| North America | United States |
| Canada | |
| Mexico | |
| South America | Brazil |
| Argentina | |
| Rest of South America | |
| Europe | Germany |
| United Kingdom | |
| France | |
| Italy | |
| Spain | |
| Rest of Europe | |
| Asia Pacific | China |
| Japan | |
| India | |
| South Korea | |
| South-East Asia | |
| Rest of Asia Pacific | |
| Middle East | Saudi Arabia |
| United Arab Emirates | |
| Turkey | |
| Rest of Middle East | |
| Africa | South Africa |
| Nigeria | |
| Rest of Africa |
| By Component | Imaging Systems (Cameras and Borescopes) | |
| Lighting and Optics | ||
| Software and AI Analytics | ||
| Accessories and Consumables | ||
| Services (Inspection, Rental, Training) | ||
| By Portability | Portable / Handheld | |
| Stationary / Benchtop | ||
| Automated / Robotic | ||
| By End-user Industry | Oil and Gas | |
| Power Generation | ||
| Aerospace | ||
| Defense | ||
| Automotive and Transportation | ||
| Manufacturing and Heavy Engineering | ||
| Construction and Infrastructure | ||
| Chemical and Petrochemical | ||
| Marine and Ship Building | ||
| Electronics and Semiconductor | ||
| Mining | ||
| Medical Devices | ||
| Others | ||
| By Geography | North America | United States |
| Canada | ||
| Mexico | ||
| South America | Brazil | |
| Argentina | ||
| Rest of South America | ||
| Europe | Germany | |
| United Kingdom | ||
| France | ||
| Italy | ||
| Spain | ||
| Rest of Europe | ||
| Asia Pacific | China | |
| Japan | ||
| India | ||
| South Korea | ||
| South-East Asia | ||
| Rest of Asia Pacific | ||
| Middle East | Saudi Arabia | |
| United Arab Emirates | ||
| Turkey | ||
| Rest of Middle East | ||
| Africa | South Africa | |
| Nigeria | ||
| Rest of Africa | ||


Key Questions Answered in the Report
What is the forecast CAGR for the visual inspection market through 2030?
The market is projected to expand at a 6.93% CAGR from 2025 to 2030.
Which component category is growing fastest?
Software and AI analytics lead growth, advancing at an 11.3% CAGR through 2030 as manufacturers prioritize intelligent defect recognition.
Why is Asia-Pacific the leading regional market?
Electronics density, rapid automation adoption, and infrastructure build-out propel the Asia-Pacific region to a 36.2% revenue share in 2024, with the region growing at an 8.4% CAGR.
How does automation reduce visual inspection labor costs?
Entry-level automated cells offer an 18-24 month payback by eliminating manual shifts and delivering consistent, round-the-clock pass/fail decisions.
Which end-user sector will expand the fastest?
The automotive and transportation sector is forecast to post a 10.5% CAGR due to stringent quality demands for battery and autonomous-vehicle component production.
Page last updated on:


