Non-Destructive Testing (NDT) Market Size and Share
Market Overview
| Study Period | 2020 - 2031 |
|---|---|
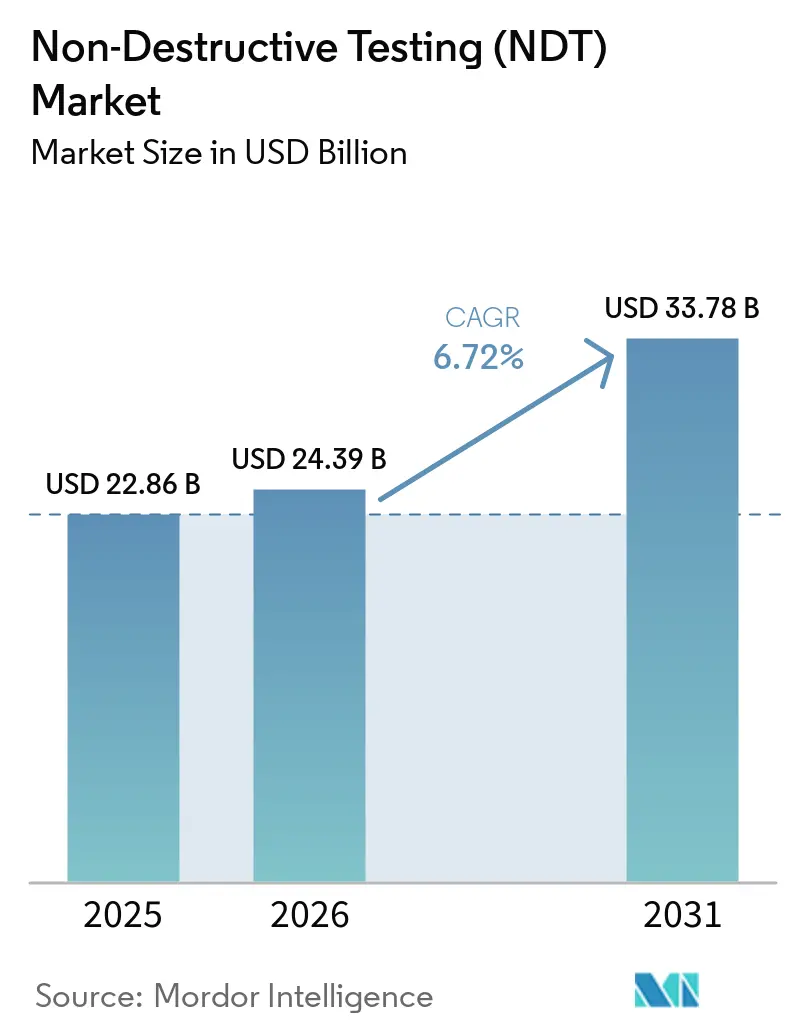
| Market Size (2026) | USD 24.39 Billion |
| Market Size (2031) | USD 33.78 Billion |
| Growth Rate (2026 - 2031) | 6.72% CAGR |
| Fastest Growing Market | Asia Pacific |
| Largest Market | North America |
| Market Concentration | Medium |
Major Players *Disclaimer: Major Players sorted in no particular order Image © Mordor Intelligence. Reuse requires attribution under CC BY 4.0. | |
Non-Destructive Testing (NDT) Market Analysis by Mordor Intelligence
The non-destructive testing market size was valued at USD 22.86 billion in 2025 and estimated to grow from USD 24.39 billion in 2026 to reach USD 33.78 billion by 2031, at a CAGR of 6.72% during the forecast period (2026-2031). Heightened global safety rules, the accelerating replacement of aging assets, and the rapid adoption of AI-enabled diagnostic platforms are shifting non-destructive evaluation from reactive fault finding toward predictive asset management. Regulatory agencies in North America and Europe now mandate more frequent inspections for pressure vessels, pipelines, aircraft structures, and nuclear reactors, anchoring a steady demand floor. Meanwhile, AI-driven analytics shorten inspection cycles, slash data-processing time, and create new subscription revenue streams for software vendors. Service providers are responding by pairing portable phased-array and digital radiography equipment with cloud analytics, raising productivity and lowering total inspection costs. Consolidation through mergers and acquisitions is intensifying, as integrated players seek to bundle hardware, software, and certified labor into turnkey offerings that simplify compliance for end users.
Key Report Takeaways
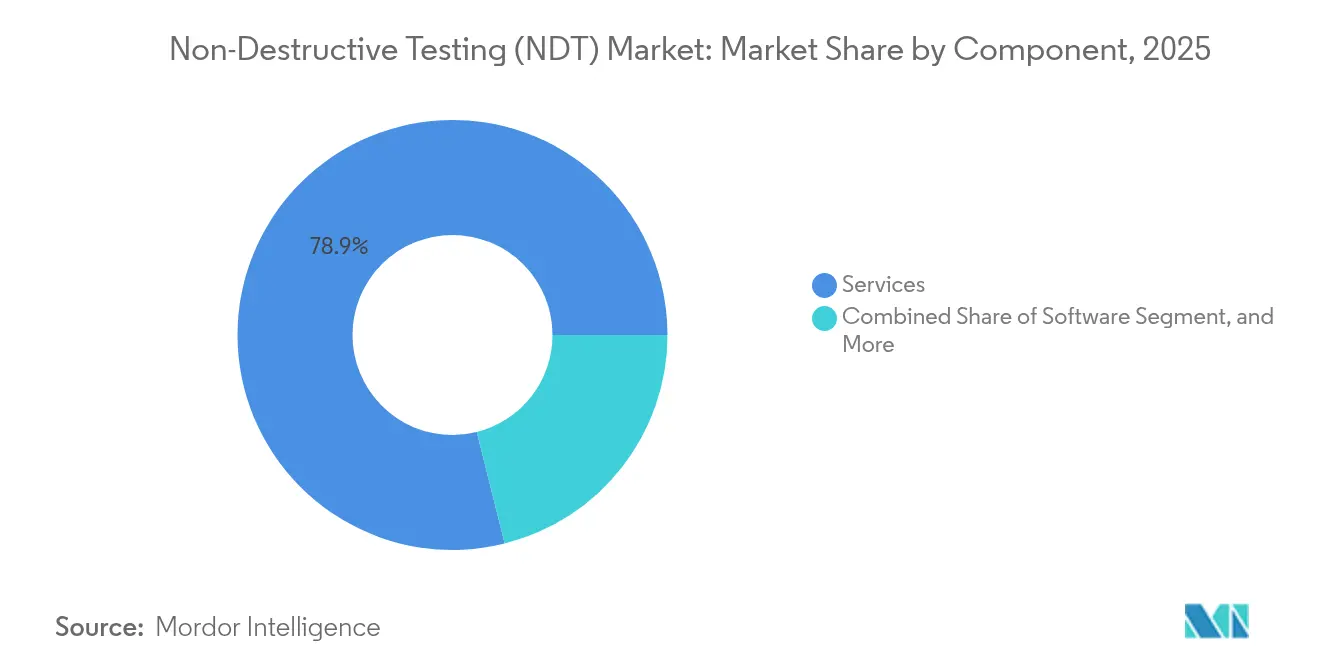
- By component, services led with 78.90% revenue share of the non-destructive testing market in 2025, while software is projected to expand at a 11.71% CAGR through 2031.
- By testing method, ultrasonic testing captured 27.95% of the non-destructive testing market share in 2025; eddy-current testing is forecast to grow at the fastest rate, with a 9.07% CAGR, to 2031.
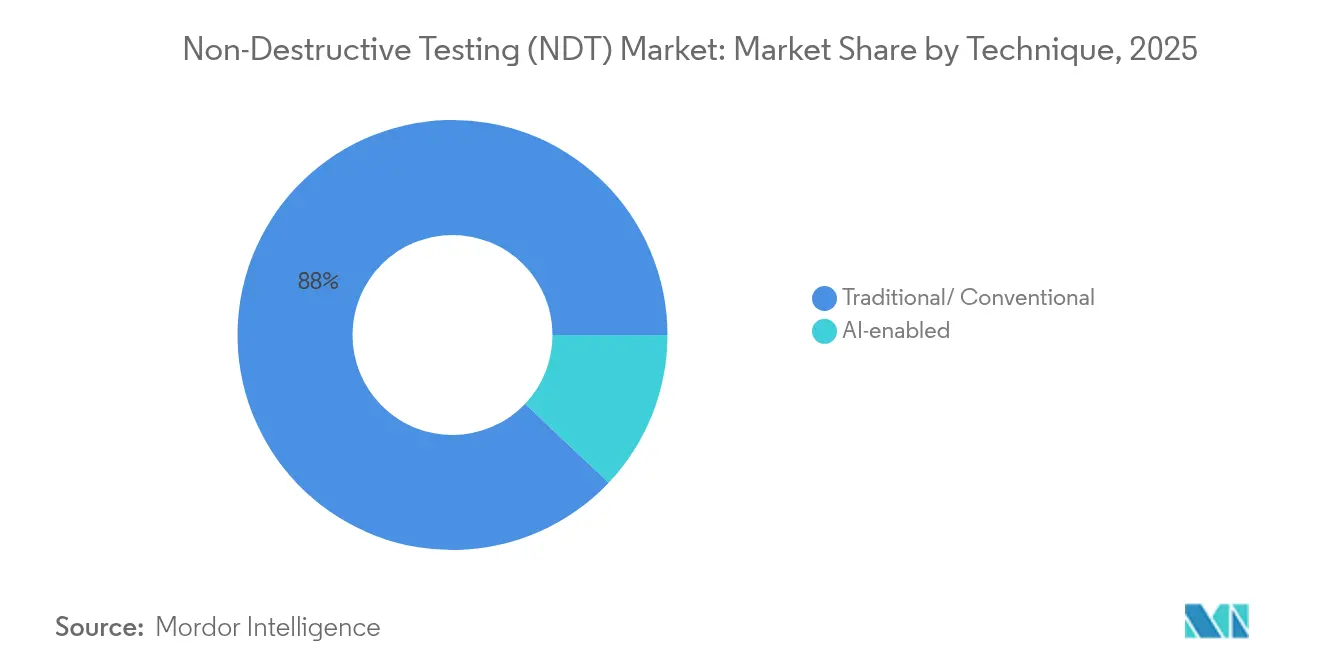
- By technique, traditional/conventional captured 87.95% of the non-destructive testing market share in 2025; the AI-enabled technique is forecast to grow at the fastest rate, with a 14.38% CAGR, through 2031.
- By end-user industry, the oil and gas sector held a 25.50% share of the non-destructive testing market size in 2025, while the automotive and transportation sectors are projected to advance at a 8.92% CAGR through 2031.
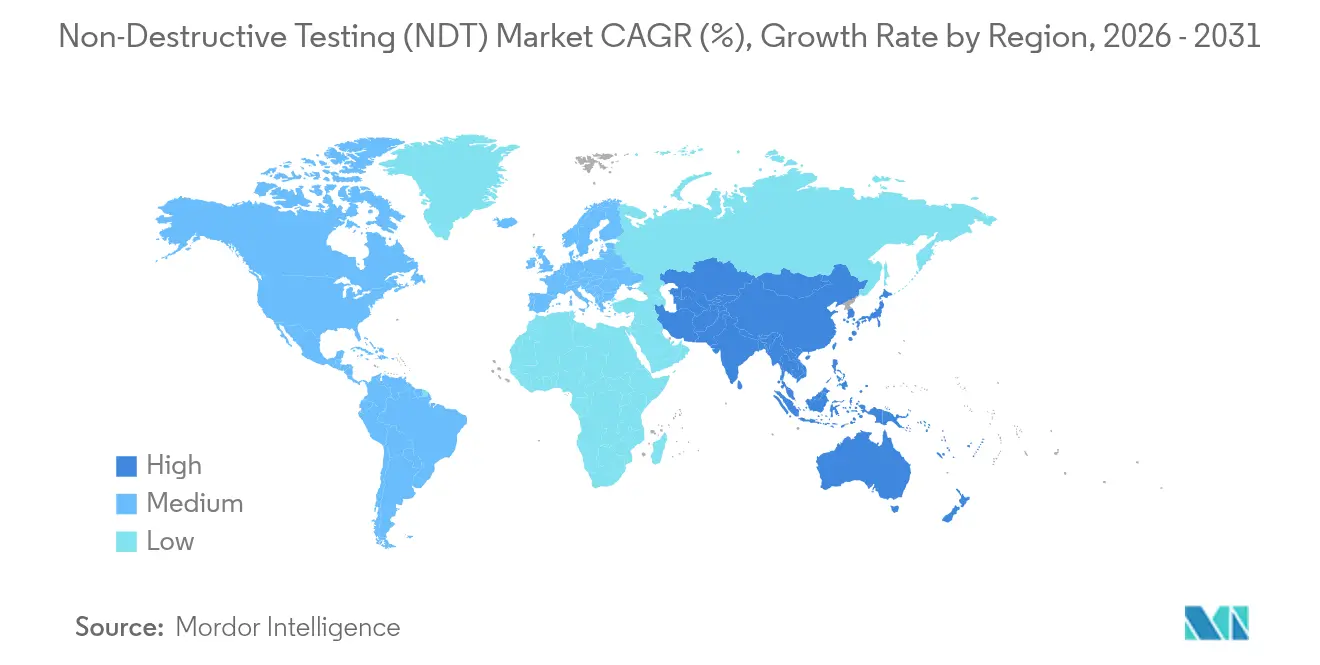
- By geography, North America commanded a 36.30% share of the non-destructive testing market in 2025, whereas the Asia-Pacific is expected to post the highest regional CAGR of 7.61% from 2025 to 2031.
Note: Market size and forecast figures in this report are generated using Mordor Intelligence’s proprietary estimation framework, updated with the latest available data and insights as of 2026.
Global Non-Destructive Testing (NDT) Market Trends and Insights
Drivers Impact Analysis*
| Driver | (~) % Impact on CAGR Forecast | Geographic Relevance | Impact Timeline |
|---|---|---|---|
| Stricter safety and quality regulations | +1.8% | Global, with the strongest impact in North America and Europe | Medium term (2-4 years) |
| Aging infrastructure replacement cycle | +1.5% | North America and Europe core, expanding to Asia-Pacific | Long term (≥ 4 years) |
| Expansion of offshore oil and gas projects | +1.2% | Middle East and Africa, North Sea, Gulf of Mexico | Medium term (2-4 years) |
| Portable phased-array and DR equipment uptake | +1.0% | Global, with early adoption in developed markets | Short term (≤ 2 years) |
| AI-powered defect analytics platforms | +0.9% | North America and Europe are early adoption, and Asia-Pacific follows | Medium term (2-4 years) |
| Additive-manufacturing QA requirements | +0.7% | North America and Europe's aerospace hubs, expanding globally | Long term (≥ 4 years) |
| Source: Mordor Intelligence | |||


Stricter Safety And Quality Regulations Drive Compliance-Led Growth
Regulatory bodies, such as the American Society of Mechanical Engineers, the Nuclear Regulatory Commission, and the Federal Aviation Administration, updated their codes in 2024, which now require more frequent and comprehensive non-destructive examinations of pressure vessels, reactor components, and composite aircraft parts.[1]Federal Aviation Administration, “Aircraft Maintenance Protocol Updates for Composite Materials,” faa.gov These tighter rules have shifted purchasing decisions from discretionary spending to mandatory compliance, guaranteeing baseline demand even in downturns. The mandatory use of phased-array ultrasonics for high-temperature pressure vessels, combined with digital record-keeping rules, is prompting asset owners to modernize their equipment fleets. Service providers benefit from multiyear inspection contracts that improve revenue predictability. Equipment vendors win through accelerated replacement sales and recurring software subscriptions tied to code compliance updates. As additional jurisdictions align with U.S. and European standards, the driver’s influence broadens, reinforcing a long-term growth thrust for the non-destructive testing market.
Aging Infrastructure Replacement Cycle Accelerates Inspection Demand
More than 40% of North American bridges now exceed design life, while pipelines installed during the 1960s are approaching critical inspection intervals. Life-extension programs for nuclear plants commissioned in the 1970s require extensive ultrasonic vessel scans to be performed before license renewal. The resulting inspection backlog fuels record demand for high-throughput testing services, intelligent pigging tools, and automated data analytics. Because infrastructure failures carry high social and economic costs, regulators enforce strict inspection calendars that asset owners cannot defer. This secular trend secures long-term visibility for non-destructive testing service revenue and spurs investment in portable equipment that improves site productivity. As Asia-Pacific utilities embark on similar upgrade cycles, global demand curves continue to steepen.
Expansion Of Offshore Oil And Gas Projects Drives Subsea NDT Innovation
Deepwater developments in the Gulf of Mexico, the North Sea, and offshore Africa require inspection systems that can operate at depths beyond 3,000 meters under extreme pressures. Companies such as Oceaneering deploy remotely operated vehicles equipped with ultrasonic, eddy current, and acoustic emission sensors, enabling continuous monitoring of pipelines and risers without the need for costly production shutdowns.[2]Oceaneering International, “Annual Report 2024,” oceaneering.com Floating production platforms introduce dynamic fatigue stresses that require real-time structural health monitoring, pushing the frontier of sensor fusion and data telemetry. These challenging environments carry premium service rates that elevate segment profitability. Suppliers investing in subsea-qualified hardware and AI-driven image analytics secure first-mover advantages as global offshore capex rebounds.
Portable Phased-Array And Digital-Radiography Equipment Uptake Transforms Field Operations
Advances in battery life, detector sensitivity, and wireless connectivity have made hand-held phased-array and digital radiography units viable for remote job sites. Exposure times have decreased by up to 90%, allowing technicians to scan more welds per shift while maintaining lower radiation safety boundaries. Real-time cloud uploads enable central experts to verify results instantly, significantly reducing project turnaround times and minimizing the need for rework. Portable gear also broadens access in emerging regions where fixed labs are scarce, thereby expanding the addressable non-destructive testing market. Equipment vendors utilize subscription analytics and calibration services to generate ongoing revenue, while asset owners benefit from faster decision-making cycles and reduced downtime.
Restraints Impact Analysis*
| Restraint | (~) % Impact on CAGR Forecast | Geographic Relevance | Impact Timeline |
|---|---|---|---|
| High cost of automated NDT systems | -1.2% | Global, with the strongest impact in emerging markets | Medium term (2-4 years) |
| Shortage of certified technicians | -1.0% | North America and Europe most affected, spreading globally | Long term (≥ 4 years) |
| Cybersecurity and data-sovereignty barriers | -0.8% | Global, with regulatory variations by region | Short term (≤ 2 years) |
| ESG pushback on radiography waste | -0.5% | Europe and North America are leading, expanding globally | Medium term (2-4 years) |
| Source: Mordor Intelligence | |||
High Cost Of Automated NDT Systems Limits Adoption In Price-Sensitive Markets
Fully automated phased-array scanners can cost USD 200,000–500,000, a price point that strains the budgets of small and mid-sized service firms. Annual calibration, software licensing, and training double the lifetime ownership cost, extending breakeven periods. In emerging markets with lower labor costs, operators often favor manual inspection despite longer cycle times, which slows the penetration of high-margin automated solutions. Smaller vendors lacking capital scale struggle to compete, accelerating market consolidation. Until financing tools or equipment leasing models mature, this restraint will continue to dampen uptake, especially outside high-value energy and aerospace segments.
Shortage Of Certified Technicians Constrains Market Growth Potential
The American Society for Nondestructive Testing reported a 15% decline in new Level II certifications in 2024, despite an 8% rise in industry demand, which widened the labor gap.[3]American Society for Nondestructive Testing, “ASNT Certification Statistics Annual Report,” asnt.org With roughly 30% of the current workforce set to retire within a decade, service capacity risks falling short of project needs. Two-year training cycles for advanced techniques, such as computed tomography, mean the shortfall cannot be closed quickly. The scarcity drives wage inflation that erodes service-provider margins and lengthens lead times for asset owners. While AI-enabled defect recognition reduces interpretation workload, certified human oversight remains mandatory for code compliance, limiting how far automation can offset the constraint in the near term.
*Our forecasts treat driver/restraint impacts as directional, not additive. The impact forecasts reflect baseline growth, mix effects, and variable interactions.
Segment Analysis
By Component: Software Disrupts a Services-Centered Structure
Services held 78.90% of 2025 revenue, yet the software slice is forecast to expand at 11.71% CAGR, setting a new value-creation arc for the non-destructive testing market. AI-driven image-recognition engines convert terabytes of scan data into actionable maintenance insights within minutes, reshaping service economics from hourly billing toward outcome-based pricing. Equipment vendors now bundle cloud analytics with hardware, embedding annual subscriptions that stretch revenue beyond the initial sale. The surge in edge-computing modules enables real-time analytics at inspection sites, easing data sovereignty concerns and reducing bandwidth costs.
Software’s rise does not eclipse field labor but redefines task allocation. Technicians capture higher-quality data more quickly, while centralized analysts validate AI-generated flags and produce compliance-ready reports. The model trims field overtime, increases fleet utilization, and creates new recurring revenue for platform providers. As regulatory bodies accept digitally signed reports, the non-destructive testing industry gains both speed and auditability, underscoring the pivotal role of software in modern inspection workflows.


By Testing Method: Ultrasonic Dominance Meets Eddy-Current Momentum
Ultrasonic methods accounted for 27.95% of the 2025 non-destructive testing market share, owing to their versatility in inspections of welds, forgings, and composites. Advanced phased-array configurations enable rapid corrosion mapping and volumetric flaw sizing without the need for dismantling equipment. Yet, eddy-current testing is expected to grow at a 9.07% CAGR through 2031, driven by its ability to detect micro-cracks in conductive materials used in aerospace composites and additive-manufactured parts.
Improved probe design and multi-frequency arrays now deliver deeper penetration and faster scanning, challenging ultrasonics’ historical stronghold in thin-wall inspections. Meanwhile, digital radiography continues to play a critical role in pipeline weld validation, and magnetic particle testing remains indispensable for detecting surface flaws in ferromagnetic components. Together, these complementary methods ensure that asset owners deploy a balanced toolbox that blends speed, sensitivity, and regulatory acceptance, depending on the defect type and material.
By Technique: AI-Enabled Platforms Challenge Conventional Workflows
Traditional approaches still account for 87.95% of current applications, but AI-enabled techniques are advancing at a projected 14.38% CAGR, marking the steepest uptick in the non-destructive testing market. Machine-learning models trained on millions of annotated flaw images now reach or surpass human probability-of-detection levels in lab conditions. Predictive analytics platforms correlate historical inspection data with operating parameters to forecast failure probabilities, enabling condition-based maintenance. Edge processors embedded in portable instruments execute algorithms locally, eliminating latency and safeguarding sensitive data.
Adoption accelerates in volume-intensive contexts such as electric-vehicle battery welds, where thousands of joints per car must be scanned. Regulatory frameworks still require human signoff, but labor hours shift from defect hunting toward validation, boosting throughput. Early adopters report cost reductions of up to 30% in inspections and a decrease in unplanned downtime, reinforcing AI’s disruptive potential across the non-destructive testing market.
By End-User Industry: Automotive Upswing Challenges Oil And Gas Preeminence
Oil and gas sustained a 25.50% revenue contribution in 2025, supported by mandated pipeline and pressure-vessel inspections further strengthening Oil and Gas TIC requirements. However, the automotive and transportation sectors are growing at the fastest rate, with a 8.92% CAGR, driven by electric-vehicle battery pack welding, lightweight composite chassis, and advanced high-strength steel applications. Each battery module contains hundreds of laser welds requiring ultrasonic or X-ray validation to ensure electrical continuity and crashworthiness. In parallel, the detection of hydrogen-induced cracking in high-strength steels necessitates higher-frequency eddy-current probes.
The aerospace, defense, and renewable energy segments are also expanding their inspection footprints, reflecting the need for complex composite structures and additive-manufactured parts that require micron-scale resolution. Manufacturing and heavy engineering plants adopt in-line NDT sensors for real-time quality control, integrating inspection directly into production lines and further expanding the non-destructive testing market size.
Geography Analysis
North America retained a 36.30% share in 2025, driven by mature regulatory oversight, aging infrastructure, and early adoption of AI. The region’s large installed base of pressure vessels, pipelines, and aircraft structures ensures steady inspection volumes, while oil and gas operators fund advanced robotic pigging to extend the life of their assets. Government grants supporting nuclear plant life-extension programs also sustain demand for volumetric ultrasonic scanning.
Europe trails slightly, yet benefits from rigorous safety directives and the European Union's push for renewable energy projects under the Green Deal. Wind-turbine blade inspections, composite rotor defect monitoring, and hydrogen pipeline pilots collectively bolster the regional non-destructive testing market. Ongoing upgrades to nuclear reactors in France and the United Kingdom are driving the addition of long-term inspection contracts, while ESG concerns are accelerating the shift from film to digital radiography to reduce hazardous-waste volumes.
The Asia-Pacific region is delivering the strongest forward momentum, with a 7.61% CAGR, driven by massive infrastructure projects in China and India, as well as expanding aerospace and semiconductor manufacturing. Governments in Japan and South Korea align local codes with ASME and IEC standards, thereby raising the rigor of inspections. Emerging Southeast Asian economies often rely on international certifiers for compliance, presenting opportunities for service to global firms. Belt and Road pipeline networks drive demand for intelligent pigging, while new shipyards across the region require magnetic particle and phased-array inspections of large hull welds.
The Middle East and Africa gain from offshore oil and gas investments and petrochemical plant expansions. Subsea projects in the Red Sea and offshore West Africa call for deepwater-qualified inspection technologies. Political instability in certain countries can delay projects, injecting volatility into regional forecasts but also producing premium margins when projects advance under compressed timelines. Latin America records moderate growth, centered on Brazilian pre-salt developments and Mexican refinery upgrades, both of which require high-specification non-destructive examinations.

Competitive Landscape
The non-destructive testing market remains moderately fragmented, with regional specialists coexisting alongside diversified multinationals. Scale advantages drive a wave of mergers as firms seek to bundle hardware, software, and certified labor in turnkey packages. Eddyfi Technologies’ January 2025 acquisition of NDT Global created a combined pipeline-integrity powerhouse now offering ultrasonic, eddy-current, and acoustic emission solutions across five continents. Acuren and NV5 merged in December 2024, forming a USD 2 billion revenue platform that integrates inspection with engineering consulting to bid on large infrastructure rehabilitation contracts.[4]Acuren Inspection, “NV5 Global Merger Completion,” acuren.com
Technology leadership hinges on AI analytics and automation. Baker Hughes introduced its predictive pipeline analytics suite in October 2024, leveraging machine learning to calculate remaining life and optimize maintenance intervals. Sonatest’s portable phased-array unit with embedded defect recognition exemplifies the fusion of hardware and software, which slashes interpretation time in the field. Subsea specialists, such as Oceaneering, grow their capabilities through targeted acquisitions, adding deepwater robot fleets and high-bandwidth data links to serve ultra-deepwater projects.
Competition also migrates toward life-cycle partnerships rather than one-off jobs. Asset owners request integrated inspection, data analytics, and regulatory reporting on multi-year frameworks. Suppliers able to deploy certified technicians quickly, deliver AI-enhanced analytics, and guarantee compliance command pricing power. Barriers to entry rise with every new code revision, favoring incumbents that can afford accreditation audits and continuous workforce training. Nonetheless, innovative startups focused on cloud analytics or miniature sensors still carve niches by licensing technology to larger integrators.
Non-Destructive Testing (NDT) Industry Leaders
Baker Hughes Company
MISTRAS Group, Inc.
SGS SA
Intertek Group plc
Applus+ Services, S.A.
- *Disclaimer: Major Players sorted in no particular order


Recent Industry Developments
- January 2025: Eddyfi Technologies completed its acquisition of NDT Global GmbH, creating a combined entity with enhanced pipeline inspection capabilities and broader geographic reach across Europe and the Middle East.
- December 2024: Acuren Inspection announced its merger with NV5 Global to form a USD 2 billion combined-revenue inspection and engineering services organization.
- November 2024: Oceaneering International acquired GDi Group’s subsea inspection division for USD 45 million, expanding deepwater nondestructive testing capabilities.
- October 2024: Baker Hughes launched an AI-powered pipeline inspection analytics platform that predicts failure probabilities and optimizes maintenance scheduling.


Global Non-Destructive Testing (NDT) Market Report Scope
Non-destructive testing (NDT) assesses material, component, or system properties without causing harm. It is pivotal in the aerospace, automotive, construction, and manufacturing industries. NDT primarily detects flaws like cracks, voids, and inclusions and can gauge material thickness, metal hardness, and composite properties. The study monitors the revenue generated by the sales of the Non-destructive testing market globally.
The Non-destructive Testing market is segmented by type (equipment, service), by technology (radiography testing, ultrasonic testing, magnetic particle testing, liquid penetrant testing, visual inspection testing, and eddy current testing, other testing technologies), by end-user industry (oil and gas, power and energy, construction, automotive and transportation, aerospace, defense, other end-user industries), and by geography (North America [United States, Canada], Europe [Germany, United Kingdom, France, Rest of Europe], Asia-Pacific [China, Japan, India, Rest of Asia Pacific], Latin America [Brazil, Argentina, Mexico, Rest of Latin America], Middle East and Africa [United Arab Emirates, Saudi Arabia, South Africa, Rest of the Middle East and Africa]). The report offers market forecasts and size in value (USD) for all the above segments.
| Equipment |
| Software |
| Services |
| Consumables |
| Ultrasonic Testing |
| Radiographic Testing |
| Magnetic Particle Testing |
| Liquid Penetrant Testing |
| Visual Inspection Testing |
| Eddy-Current Testing |
| Acoustic Emission Testing |
| Thermography / Infrared Testing |
| Computed Tomography Testing |
| Traditional/ Conventional |
| AI-enabled |
| Oil and Gas |
| Power Generation |
| Aerospace |
| Defense |
| Automotive and Transportation |
| Manufacturing and Heavy Engineering |
| Construction and Infrastructure |
| Chemical and Petrochemical |
| Marine and Ship Building |
| Electronics and semiconductor |
| Mining |
| Medical Devices |
| Other End-user Industries |
| North America | United States | |
| Canada | ||
| Mexico | ||
| South America | Brazil | |
| Argentina | ||
| Rest of South America | ||
| Europe | Germany | |
| United Kingdom | ||
| France | ||
| Italy | ||
| Spain | ||
| Rest of Europe | ||
| Asia-Pacific | China | |
| Japan | ||
| India | ||
| South Korea | ||
| South-East Asia | ||
| Rest of Asia-Pacific | ||
| Middle East and Africa | Middle East | Saudi Arabia |
| United Arab Emirates | ||
| Turkey | ||
| Rest of Middle East | ||
| Africa | South Africa | |
| Nigeria | ||
| Rest of Africa | ||
| By Component | Equipment | ||
| Software | |||
| Services | |||
| Consumables | |||
| By Testing Method | Ultrasonic Testing | ||
| Radiographic Testing | |||
| Magnetic Particle Testing | |||
| Liquid Penetrant Testing | |||
| Visual Inspection Testing | |||
| Eddy-Current Testing | |||
| Acoustic Emission Testing | |||
| Thermography / Infrared Testing | |||
| Computed Tomography Testing | |||
| By Technique | Traditional/ Conventional | ||
| AI-enabled | |||
| By End-user Industry | Oil and Gas | ||
| Power Generation | |||
| Aerospace | |||
| Defense | |||
| Automotive and Transportation | |||
| Manufacturing and Heavy Engineering | |||
| Construction and Infrastructure | |||
| Chemical and Petrochemical | |||
| Marine and Ship Building | |||
| Electronics and semiconductor | |||
| Mining | |||
| Medical Devices | |||
| Other End-user Industries | |||
| By Geography | North America | United States | |
| Canada | |||
| Mexico | |||
| South America | Brazil | ||
| Argentina | |||
| Rest of South America | |||
| Europe | Germany | ||
| United Kingdom | |||
| France | |||
| Italy | |||
| Spain | |||
| Rest of Europe | |||
| Asia-Pacific | China | ||
| Japan | |||
| India | |||
| South Korea | |||
| South-East Asia | |||
| Rest of Asia-Pacific | |||
| Middle East and Africa | Middle East | Saudi Arabia | |
| United Arab Emirates | |||
| Turkey | |||
| Rest of Middle East | |||
| Africa | South Africa | ||
| Nigeria | |||
| Rest of Africa | |||


Key Questions Answered in the Report
What is the projected value of the non-destructive testing market by 2031?
The market is forecast to reach USD 33.78 billion by 2031.
Which component segment is growing the fastest in non-destructive testing?
Software is growing at a 11.71% CAGR as AI analytics gain traction.
Why is Asia-Pacific attracting attention from NDT suppliers?
Massive infrastructure programs in China and India are lifting demand, driving a 7.61% regional CAGR.
How are AI platforms changing inspection economics?
Machine learning cuts data-analysis time, enabling predictive maintenance and lowering overall inspection costs.
Which testing method currently holds the largest share?
Ultrasonic testing leads with 27.95% of 2025 revenue.
What major restraint could slow technology adoption?
The high capital cost of automated systems limits uptake among smaller service providers, especially in emerging markets.
Page last updated on:


