Non-Destructive Testing Equipment And Consumables Market Size and Share
Market Overview
| Study Period | 2019 - 2030 |
|---|---|
| Market Size (2025) | USD 4.69 Billion |
| Market Size (2030) | USD 7.39 Billion |
| Growth Rate (2025 - 2030) | 9.51% CAGR |
| Fastest Growing Market | Asia Pacific |
| Largest Market | Asia Pacific |
| Market Concentration | Medium |
Major Players *Disclaimer: Major Players sorted in no particular order Image © Mordor Intelligence. Reuse requires attribution under CC BY 4.0. | |

Non-Destructive Testing Equipment And Consumables Market Analysis by Mordor Intelligence
The non-destructive testing equipment and consumables market size is estimated at USD 4.69 billion in 2025 and is projected to reach USD 7.39 billion by 2030, representing a 9.51% CAGR for the forecast period. The current growth path reflects regulatory inspection mandates, modernization cycles for aging energy infrastructure, and steadily rising adoption of Industry 4.0 real-time inspection platforms. Equipment sales account for 84.2% of 2024 revenue, underscoring the capital-intensive nature of high-precision ultrasonic, radiographic, and eddy-current systems, while consumables represent the fastest-growing revenue stream as inspection frequency accelerates. The Asia-Pacific region leads the non-destructive testing (NDT) equipment and consumables market, with a 34.6% share, and exhibits the strongest growth momentum, at a 10.4% CAGR, driven by large-scale infrastructure buildouts, electric vehicle manufacturing investments, and government-backed automation programs.[1]American Society for Nondestructive Testing, “Industry Snapshot 2025,” asnt.org Competitive positioning now favors suppliers that pair traditional instrumentation with artificial intelligence, robotic mobility, and cloud analytics, driving a steady shift from standalone tools toward integrated inspection platforms.
Key Report Takeaways
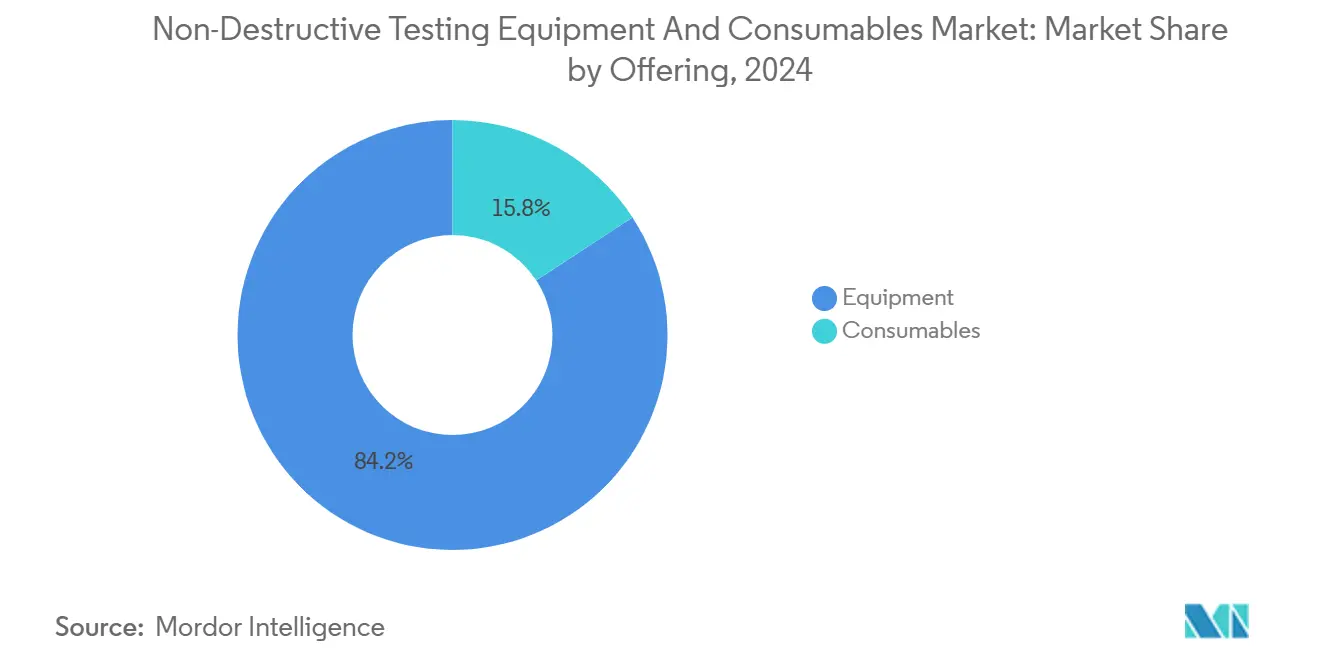
- By offering, equipment captured 84.2% of 2024 revenue, while consumables are projected to advance at an 11.3% CAGR through 2030.
- By testing method, ultrasonic testing accounted for 31.2% of the NDT equipment and consumables market share in 2024, whereas eddy-current testing is forecast to record an 11.1% CAGR through 2030.
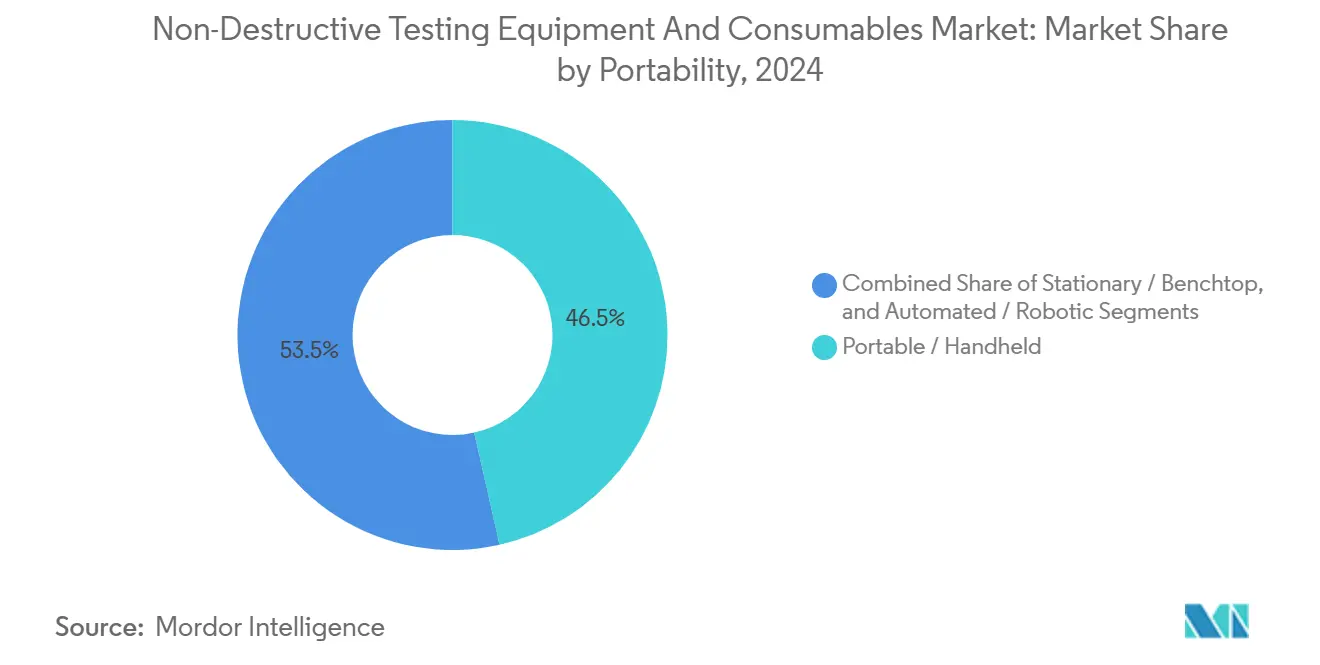
- By portability, portable and handheld devices held a 46.5% revenue share in 2024, and automated and robotic systems are projected to grow at a 14.5% CAGR through 2030.
- By end-user industry, the oil and gas sector led with a 26.2% revenue share in 2024, while the automotive and transportation sector is set to expand at a 12.8% CAGR through 2030.
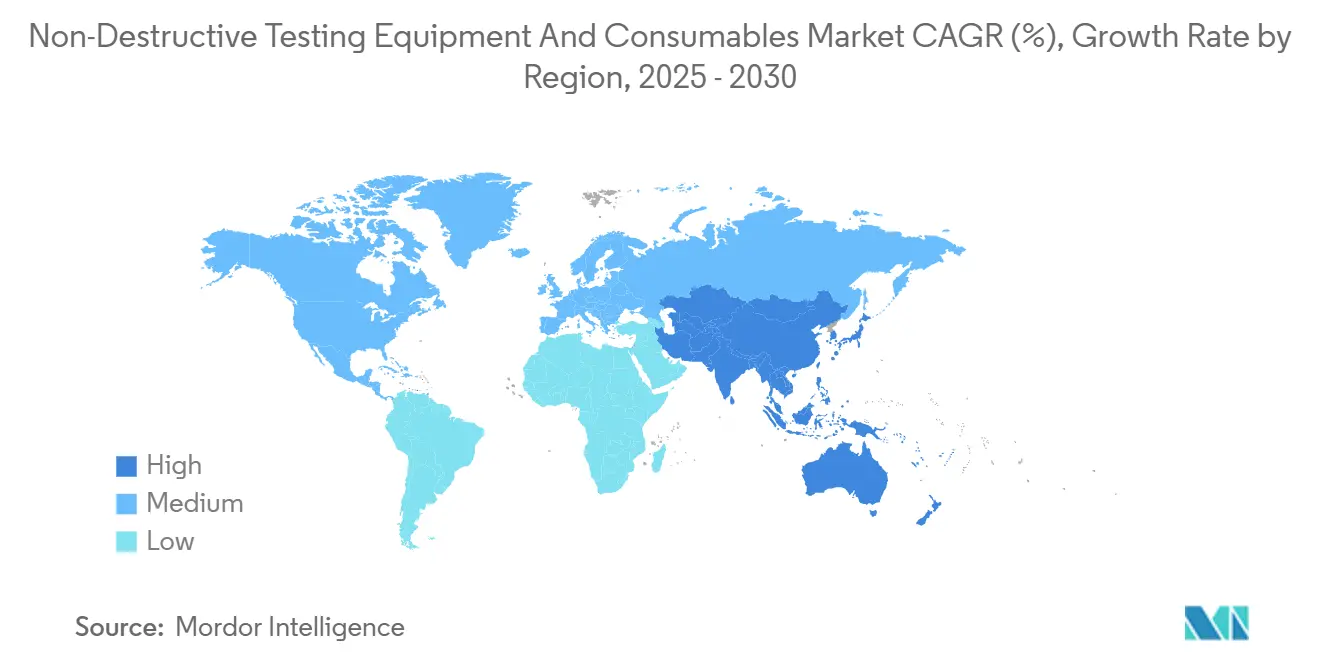
- By geography, the Asia-Pacific region dominated with a 34.6% revenue share in 2024 and is expected to post a 10.4% CAGR through 2030.
Global Non-Destructive Testing Equipment And Consumables Market Trends and Insights
Drivers Impact Analysis*
| Driver | (~) % Impact on CAGR Forecast | Geographic Relevance | Impact Timeline |
|---|---|---|---|
| Regulatory-driven inspection mandates | +2.1% | Global, with early implementation in North America and Europe | Medium term (2-4 years) |
| Aging infrastructure in the oil and gas and power sectors | +1.8% | North America and Europe core, expanding to Asia-Pacific | Long term (≥ 4 years) |
| Digitalization and Industry 4.0-enabled real-time NDT | +2.3% | Global, led by Asia-Pacific manufacturing hubs | Short term (≤ 2 years) |
| Insurance-linked preventive-maintenance incentives | +1.2% | North America and Europe, with selective adoption in developed APAC markets | Medium term (2-4 years) |
| Hydrogen-economy composite-tank inspection needs | +1.4% | Europe and North America are leading, with Japan and South Korea following. | Long term (≥ 4 years) |
| Autonomous drone/robot-based offshore asset NDT | +1.7% | Global offshore regions, particularly the North Sea, the Gulf of Mexico, and the Asia-Pacific waters | Medium term (2-4 years) |
| Source: Mordor Intelligence | |||
Regulatory-Driven Inspection Mandates
Regulators have tightened integrity-management rules across energy, aerospace, and chemical facilities, prompting asset owners to adopt continuous monitoring and maintain traceable inspection records. The American Petroleum Institute’s updated pipeline integrity standards and the Federal Aviation Administration’s aging-aircraft directives require more detailed ultrasonic thickness readings, phased-array scans, and digital-radiography documentation, workflows that manual visual inspection cannot support.[2]The Energy Robotics Blog, “Inspection Mandates Reshape Integrity Management,” energy-robotics.comIn Europe, the Seveso III Directive enforces inspection cycles for high-hazard installations, while insurers now link premium discounts to the use of certified NDT procedures. Demand therefore focuses on portable phased-array ultrasonic units, computed radiography systems, and cloud-enabled reporting software that demonstrate compliance and streamline the auditing process. Suppliers who can certify their solutions under the ASNT Level II and PCN frameworks gain a significant competitive edge.
Aging Infrastructure in Oil and Gas and Power Sectors
Energy assets installed during the 1970s and 1980s are nearing the end of their design life. North American pipelines span more than 3 million kilometers, with 55% built before 1970. Operators now deploy guided-wave ultrasonic crawlers and acoustic-emission sensors to detect crack growth without interrupting the flow of materials. In the power grid, distribution transformers exceeding 40 years require dissolved-gas analysis and infrared thermography to pre-empt catastrophic failures, a driver behind the USD 66 billion invested in European grids during 2023. The shift from corrective repair to predictive maintenance pushes asset owners to install permanently mounted monitoring transducers and connect their data to analytics dashboards, boosting recurring software revenue within the NDT equipment and consumables market.
Digitalization and Industry 4.0-Enabled Real-Time NDT
Manufacturing plants are embedding inspection sensors directly onto production lines, enabling defects to be flagged within seconds and minimizing scrap. Phased-array systems equipped with machine-learning algorithms cut false positives by 40% and accelerate weld-quality decisions.[3]OnestopNDT, “Phased-Array Systems Cut False Positives by 40%,” onestopndt.com Eddy-current coils integrated into robotic arms now inspect every aluminum auto-body panel before painting. Cloud connectivity enables aggregated defect data to feed digital twins, creating a feedback loop that refines process parameters and schedules maintenance only when degradation models predict threshold breach. This interoperability between inspection, manufacturing execution, and asset-management systems underpins the most dynamic revenue opportunities for the NDT equipment and consumables market.
Hydrogen-Economy Composite-Tank Inspection Needs
Hydrogen infrastructure relies on carbon-fiber composite vessels pressurized to 700 bar, materials that mask subsurface cracks from traditional visual cues. Ultrasonic resonance, acoustic-emission arrays, and high-resolution thermography now form a multi-modal toolkit capable of detecting fiber breakage and permeability shifts before catastrophic rupture. European safety codes mandate periodic inspection of mobile hydrogen tanks, driving demand for new calibration blocks, hydrogen-compatible couplants, and specialty probes. Equipment vendors who can certify transducers for hydrogen exposure while providing portable systems suitable for refueling-station environments are positioned to capture outsized growth within the NDT equipment and consumables industry.
Restraints Impact Analysis*
| Restraint | (~) % Impact on CAGR Forecast | Geographic Relevance | Impact Timeline |
|---|---|---|---|
| High upfront cost of advanced equipment | -1.5% | Global, particularly affecting small and medium enterprises | Short term (≤ 2 years) |
| Scarcity of certified NDT technicians | -1.8% | North America and Europe primarily, expanding to the Asia-Pacific | Medium term (2-4 years) |
| Radiation safety and compliance issues in RT | -0.9% | Global, with stricter enforcement in developed markets | Long term (≥ 4 years) |
| Supply-chain risk for specialty transducers | -1.2% | Global, with an impact on high-frequency and specialized applications | Short term (≤ 2 years) |
| Source: Mordor Intelligence | |||
High Upfront Cost of Advanced Equipment
Top-tier phased-array platforms bundled with automated scanners list between USD 200,000 and USD 500,000, while subsea robotic crawlers exceed USD 2 million. Small inspection service providers struggle to finance such upgrades and often extend the life of legacy thickness gauges. The total cost of ownership rises further once operator certification, maintenance contracts, and proprietary consumables are factored in. Leasing and rental models are gaining traction, but high capital intensity still limits technology diffusion and tempers the overall CAGR of the NDT equipment and consumables market.
Scarcity of Certified NDT Technicians
The Bureau of Labor Statistics projects 6,000 average annual openings for technicians through 2033, yet training capacity remains constrained. Level II wages increased to a USD 50,000–109,000 range in 2025, and Level III salaries already exceed USD 123,000 in some regions.[4]American Society for Nondestructive Testing, “Salary and Certification Trends 2025,” asnt.org Standard revisions under ISO 9712:2022 impose additional practical hours requirements that prolong certification timelines. Companies facing workforce gaps are accelerating their investment in automated defect-recognition software and robotic inspection to mitigate human-resource bottlenecks; however, the shortage still hinders near-term market penetration for complex systems.
*Our forecasts treat driver/restraint impacts as directional, not additive. The impact forecasts reflect baseline growth, mix effects, and variable interactions.
Segment Analysis
By Offering: Equipment Dominance Drives Market Value
Equipment secured USD 3.95 billion in 2024, accounting for 84.2% of revenue, affirming that cutting-edge instrumentation remains the primary value generator for the non-destructive testing equipment and consumables market. Capital spending centers on multi-channel phased-array units, portable digital radiography rigs, and robotic crawlers engineered for hazardous environments. Modular platforms that support plug-and-play probes across multiple testing methods lower lifetime ownership costs and deepen customer lock-in. Digital upgrades, such as automated defect recognition and cloud dashboards, command premium pricing and underpin recurring software revenue layers.
Consumables outpace equipment growth at an 11.3% CAGR, thanks to stricter inspection cycles that require the use of penetrants, magnetic particles, couplants, and reference standards. Specialized hydrogen-compatible couplants and environmentally benign penetrants illustrate how regulatory and application-specific needs stimulate innovation on the consumables side. As inspection frequency escalates with predictive-maintenance programs, recurring consumable replenishment stabilizes revenue and moderates cyclicality for suppliers active in both categories.


By Testing Method: Ultrasonic Leadership Meets Eddy-Current Innovation
Ultrasonic testing generated USD 1.46 billion in 2024, translating to a 31.2% share of the non-destructive testing equipment and consumables market size. Its appeal lies in its versatility, encompassing thickness measurement, weld-flaw detection, and composite inspection across virtually every industrial sector. The transition from conventional angle-beam probes to phased-array and full-matrix capture systems elevates resolution and accelerates scan speed, reinforcing ultrasonics’ leadership.
Eddy-current testing, although having a smaller base, is projected to grow at a 11.1% CAGR through 2030, the fastest among all methods. Non-contact coils integrated into robotic arms and automated surface scanners excel at high-throughput detection of microcracks in conductive materials, which is crucial for electric-vehicle battery housings and aerospace fastener holes. Radiographic testing remains relevant for inspecting complex geometries, although digital conversion mitigates radiation safety concerns. Magnetic particle and liquid-penetrant testing continue to play niche roles in surface defect detection, whereas thermography is gaining traction as predictive maintenance becomes more favored. Acoustic emission monitoring steadily migrates from research to commercial deployment in continuous structural health monitoring nodes.
By Portability: Handheld Convenience Versus Automated Precision
Portable and handheld devices accounted for USD 2.18 billion, or 46.5% of the revenue share in 2024, driven by field-ready thickness gauges, flaw detectors, and videoscopes. Lithium-ion battery improvements and miniaturized electronics enable full-featured phased-array units that weigh less than 2 kg and connect wirelessly to enterprise databases. Portability remains essential for upstream oil and gas, aviation line maintenance, and remote infrastructure sites, ensuring continued dominance.
Automated and robotic platforms are expanding at a 14.5% CAGR, driven by safety gains and repeatability. Autonomous underwater vehicles conduct pipeline surveys while capturing sub-millimeter imagery, and magnetic crawler robots traverse storage tank walls without requiring human entry. Stationary and benchtop systems keep a loyal user base in high-volume manufacturing cells that demand sub-micron precision and full integration with programmable logic controllers. The interplay of portability and automation demonstrates that different use cases continue to coexist within the non-destructive testing equipment and consumables industry.

By End-User Industry: Oil and Gas Maturity Contrasts Automotive Innovation
Oil and gas contributed 26.2% of 2024 revenue, or approximately USD 1.23 billion of the non-destructive testing equipment and consumables market size, driven by integrity management programs for pipelines, pressure vessels, and subsea infrastructure. Inline inspection tools with enhanced crack-sizing algorithms extend inspection intervals yet increase data-processing complexity, positioning software analytics as a growth lever.
The automotive and transportation sector, although currently smaller, is expected to accelerate at a 12.8% CAGR. Laser-ultrasonic and eddy-current systems monitor weld quality on high-speed stamping lines, while battery cell manufacturers deploy high-frequency phased-array probes to detect internal delamination. The power generation, aerospace, and defense sectors collectively maintain steady demand, thanks to aging equipment cycles and strict safety regulations. The manufacturing and heavy engineering segment share strengthens as in-process inspection is embedded into Industry 4.0 production flows, making quality an inline rather than post-production activity.
Geography Analysis
The Asia-Pacific region held USD 1.62 billion, equivalent to 34.6% of the revenue in 2024, and remains the fastest-growing region, with a 10.4% CAGR projected through 2030. China’s Belt and Road pipeline projects and high-speed rail expansion require thousands of ultrasonic flaw detectors and phased-array scanners annually. Japan invests in robotic NDT to manage workforce demographics and extend the life of nuclear reactors, while India’s Production-Linked Incentive (PLI) scheme attracts electronics and aerospace manufacturing that mandates the use of automated inspection cells.
North America remains a technology-upgrade market. Transmission pipeline replacement programs and aviation aging aircraft mandates fuel demand for advanced eddy-current and digital radiography systems. The adoption of cloud analytics outpaces other regions as service providers integrate inspection data with enterprise asset management platforms, reinforcing software subscription revenue within the non-destructive testing equipment and consumables market.
Europe balances sustainability goals with asset extension. Investments in wind-turbine blade inspection, ester-fluid transformer upgrades, and hydrogen-storage trials drive the purchase of specialized ultrasonic, acoustic-emission, and thermography equipment. The Middle East and Africa are progressing with refinery revamps, LNG expansion, and desalination projects that necessitate corrosion-resistant inspection equipment. South America focuses on deep-water oilfield exploration and the monitoring of heavy equipment, generating selective but high-value procurement.

Competitive Landscape
Market concentration is moderate, with the top five suppliers accounting for a significant share of the 2024 revenue. Olympus, Waygate Technologies, and MISTRAS Group retain broad method portfolios, bolstered by global service networks. Eddyfi Technologies gains scale from its NDT Global acquisition, pairing inline inspection know-how with advanced eddy-current technology. SPIE’s purchase of GIE HORUS enhances regional service depth in France, mirroring a broader trend toward turnkey inspection offerings that bundle equipment, certified personnel, and data analytics.
Product differentiation now hinges on software. Evident’s AI-assisted defect recognition reduces technician interpretation variance, while Waygate’s cloud platform automates compliance reports. Robotic innovators, such as Saipem, deploy autonomous drones for subsea asset monitoring, claiming a 50% reduction in time and emissions compared to vessel-based methods.
Start-ups focusing on hydrogen-compatible sensors or edge AI analytics target whitespace niches unaddressed by incumbents. Certification barriers, such as ATEX Zone 1 and ISO 9712 personnel standards, provide defensible positions for established players and elevate acquisition multiples for specialty firms that hold credentials in emerging sectors.
Non-Destructive Testing Equipment And Consumables Industry Leaders
Olympus Corporation
Waygate Technologies (Baker Hughes Company)
MISTRAS Group Inc.
Eddyfi Technologies
Zetec Inc.
- *Disclaimer: Major Players sorted in no particular order

Recent Industry Developments
- July 2025: Atlas Copco acquired National Tank and Equipment LLC for USD 218 million, expanding U.S. fluid-transfer inspection rentals.
- May 2025: Fiberscope.net unveiled the NANORAY X35 micro videoscope with 1 mm probes for micro-component inspection.
- March 2025: Creaform (AMETEK) added laser projection to its inspection suite, enabling scan-analyze-project workflows.
- March 2025: 3D Infotech introduced an AI-powered robotic metrology system integrated with cobots.


Global Non-Destructive Testing Equipment And Consumables Market Report Scope
Non-destructive testing (NDT) instruments are used to scan, inspect, and quantify flaws, corrosions, and other material conditions without permanently damaging or altering the examined product or part. NDT equipment encompasses a broad set of equipment, such as flaw detectors, thickness gages, material condition testers, visual inspection devices, acoustic emission testers, eddy current instruments, and devices that measure resistivity, conductivity, and corrosion.
The non-destructive testing equipment and consumables market report is segmented by offering (equipment, and consumables), testing method (ultrasonic testing, radiographic testing, magnetic particle testing, liquid penetrant testing, visual inspection testing, eddy-current testing, acoustic emission testing, thermography / infrared testing, computed tomography testing), portability (portable/handheld, stationary / benchtop, automated / robotic), end-user industry (oil and gas, power generation, automotive and transportation, manufacturing and heavy engineering, construction and infrastructure, chemical and petrochemical, marine and ship building, electronics and semiconductor, mining, medical devices), and geography. The market forecasts are provided in terms of value (USD).
| Equipment |
| Consumables |
| Ultrasonic Testing |
| Radiographic Testing |
| Magnetic Particle Testing |
| Liquid Penetrant Testing |
| Visual Inspection Testing |
| Eddy-Current Testing |
| Acoustic Emission Testing |
| Thermography / Infrared Testing |
| Computed Tomography Testing |
| Portable / Handheld |
| Stationary / Benchtop |
| Automated / Robotic |
| Oil and Gas |
| Power Generation |
| Aerospace |
| Defense |
| Automotive and Transportation |
| Manufacturing and Heavy Engineering |
| Construction and Infrastructure |
| Chemical and Petrochemical |
| Marine and Ship Building |
| Electronics and semiconductor |
| Mining |
| Medical Devices |
| Other End-user Industries |
| North America | United States | |
| Canada | ||
| Mexico | ||
| South America | Brazil | |
| Argentina | ||
| Rest of South America | ||
| Europe | Germany | |
| United Kingdom | ||
| France | ||
| Italy | ||
| Spain | ||
| Rest of Europe | ||
| Asia Pacific | China | |
| Japan | ||
| India | ||
| South Korea | ||
| South East Asia | ||
| Rest of Asia Pacific | ||
| Middle East and Africa | Middle East | Saudi Arabia |
| United Arab Emirates | ||
| Turkey | ||
| Rest of Middle East | ||
| Africa | South Africa | |
| Nigeria | ||
| Rest of Africa | ||
| By Offering | Equipment | ||
| Consumables | |||
| By Testing Method | Ultrasonic Testing | ||
| Radiographic Testing | |||
| Magnetic Particle Testing | |||
| Liquid Penetrant Testing | |||
| Visual Inspection Testing | |||
| Eddy-Current Testing | |||
| Acoustic Emission Testing | |||
| Thermography / Infrared Testing | |||
| Computed Tomography Testing | |||
| By Portability | Portable / Handheld | ||
| Stationary / Benchtop | |||
| Automated / Robotic | |||
| By End-user Industry | Oil and Gas | ||
| Power Generation | |||
| Aerospace | |||
| Defense | |||
| Automotive and Transportation | |||
| Manufacturing and Heavy Engineering | |||
| Construction and Infrastructure | |||
| Chemical and Petrochemical | |||
| Marine and Ship Building | |||
| Electronics and semiconductor | |||
| Mining | |||
| Medical Devices | |||
| Other End-user Industries | |||
| By Geography | North America | United States | |
| Canada | |||
| Mexico | |||
| South America | Brazil | ||
| Argentina | |||
| Rest of South America | |||
| Europe | Germany | ||
| United Kingdom | |||
| France | |||
| Italy | |||
| Spain | |||
| Rest of Europe | |||
| Asia Pacific | China | ||
| Japan | |||
| India | |||
| South Korea | |||
| South East Asia | |||
| Rest of Asia Pacific | |||
| Middle East and Africa | Middle East | Saudi Arabia | |
| United Arab Emirates | |||
| Turkey | |||
| Rest of Middle East | |||
| Africa | South Africa | ||
| Nigeria | |||
| Rest of Africa | |||


Key Questions Answered in the Report
What is the 2025 value of the non-destructive testing equipment and consumables market?
The non-destructive testing equipment and consumables market size is USD 4.69 billion in 2025.
Which region leads sales of inspection equipment?
The Asia-Pacific region holds 34.6% of the revenue and exhibits the highest growth trajectory, with a 10.4% CAGR.
Which testing method dominates current demand?
Ultrasonic testing leads with a 31.2% share of 2024 revenue.
Why are consumables growing faster than equipment?
Regulators mandate more frequent inspections, so penetrants, magnetic particles, and couplants are replenished continuously, driving an 11.3% CAGR for consumables.
How is automation influencing technician shortages?
Robotic crawlers and AI defect-recognition software offset limited certified labor, improving safety and inspection throughput.
Which industry will grow fastest through 2030?
The automotive and transportation sector is projected to expand at a 12.8% CAGR, driven by the need for inspection of electric-vehicle batteries and lightweight materials.
Page last updated on:


