Wealth Tech Solution Market Size and Share
Market Overview
| Study Period | 2020 - 2031 |
|---|---|
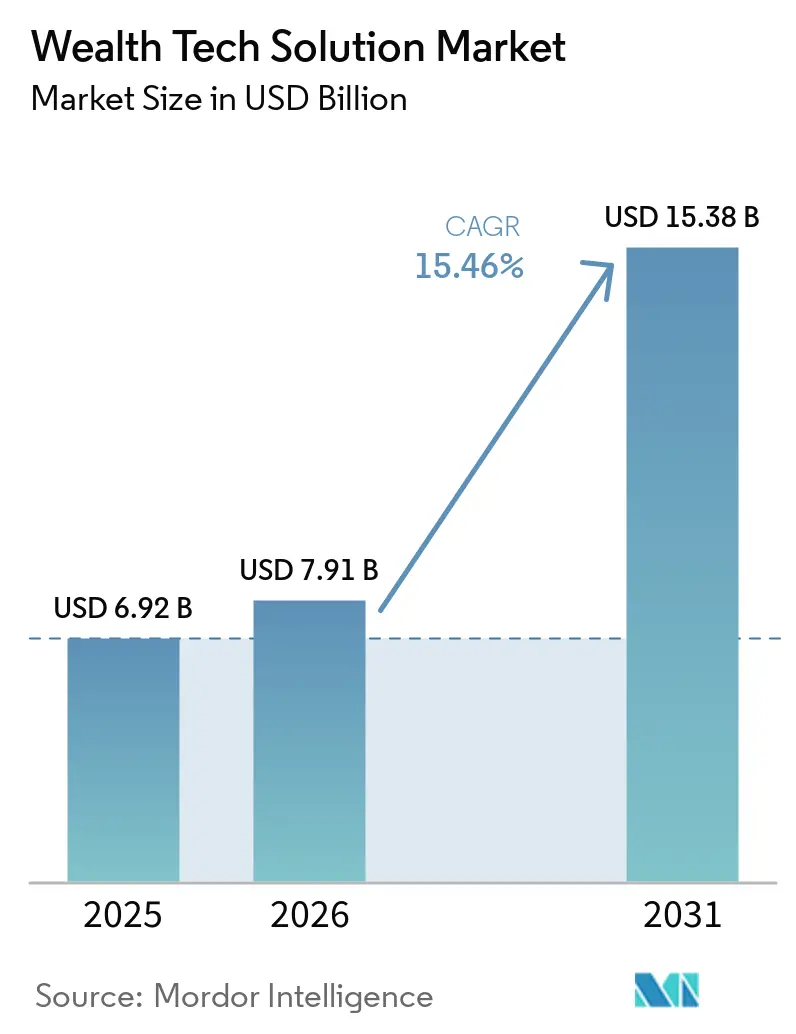
| Market Size (2026) | USD 7.91 Billion |
| Market Size (2031) | USD 15.38 Billion |
| Growth Rate (2026 - 2031) | 15.46% CAGR |
| Fastest Growing Market | Asia Pacific |
| Largest Market | North America |
| Market Concentration | Low |
Major Players *Disclaimer: Major Players sorted in no particular order Image © Mordor Intelligence. Reuse requires attribution under CC BY 4.0. | |
Wealth Tech Solution Market Analysis by Mordor Intelligence
The wealth tech solution market size was valued at USD 6.92 billion in 2025 and estimated to grow from USD 7.91 billion in 2026 to reach USD 15.38 billion by 2031, at a CAGR of 15.46% during the forecast period (2026-2031). The expansion reflects early regulatory tailwinds, notably the European Union’s Digital Operational Resilience Act and the United States Consumer Financial Protection Bureau’s Section 1033 rule, which are forcing incumbents to modernize data-sharing pipelines and adopt open-finance standards. At the same time, banks and registered investment advisors are shifting toward application-programming-interface-first architectures that compress portfolio rebalancing cycles from days to minutes, widening the addressable base of Gen Z and millennial investors who demand real-time insights. Demand is also buoyed by the rapid consumerization of artificial-intelligence tooling that delivers life-event-driven nudges, and by the growing popularity of white-label wealth modules that payroll providers, neobanks, and employee-benefit portals embed directly into existing user journeys. Collectively, these forces are creating a network effect that pulls small and medium-sized enterprises into the digital wealth ecosystem, lowering historical barriers tied to high license fees and protracted implementation timelines.
Key Report Takeaways
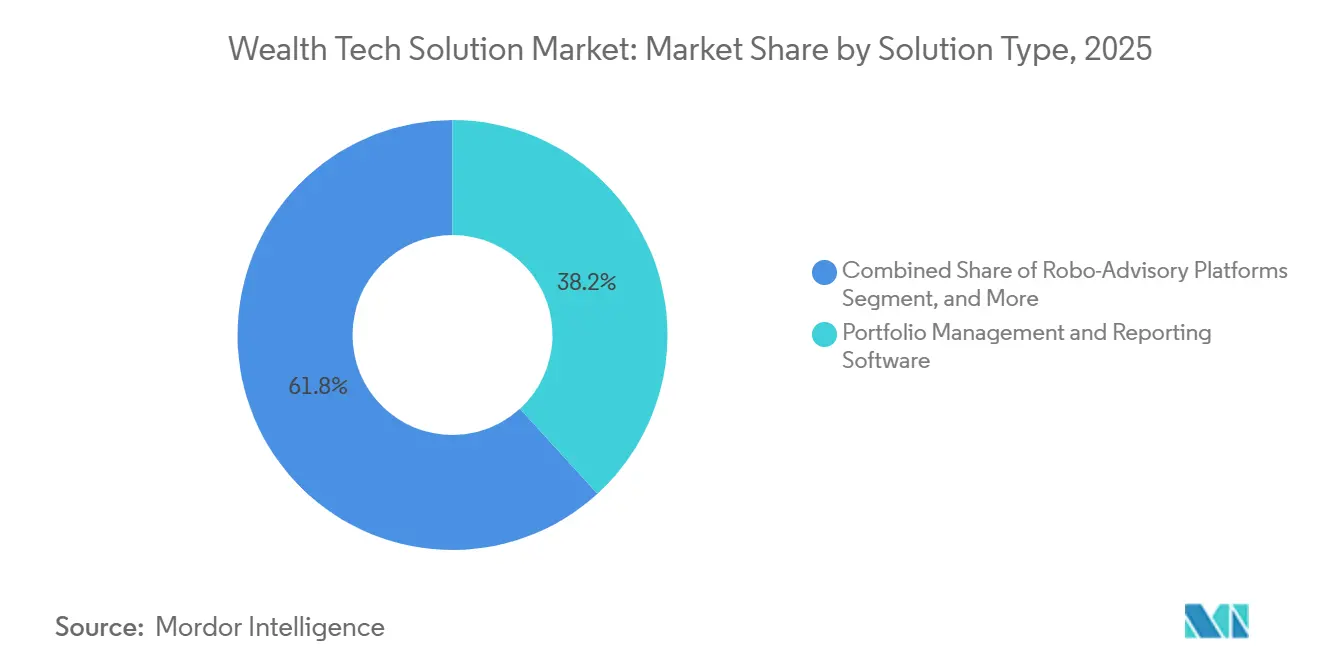
- By solution type, portfolio management and reporting software led the wealth tech solution market with 38.21% market share in 2025, while API, integration, and wealth-as-a-service infrastructure are projected to expand at a 16.66% CAGR through 2031.
- By deployment mode, cloud accounted for 61.81% of the wealth tech solution market size in 2025, whereas hybrid models are advancing at a 16.05% CAGR to 2031.
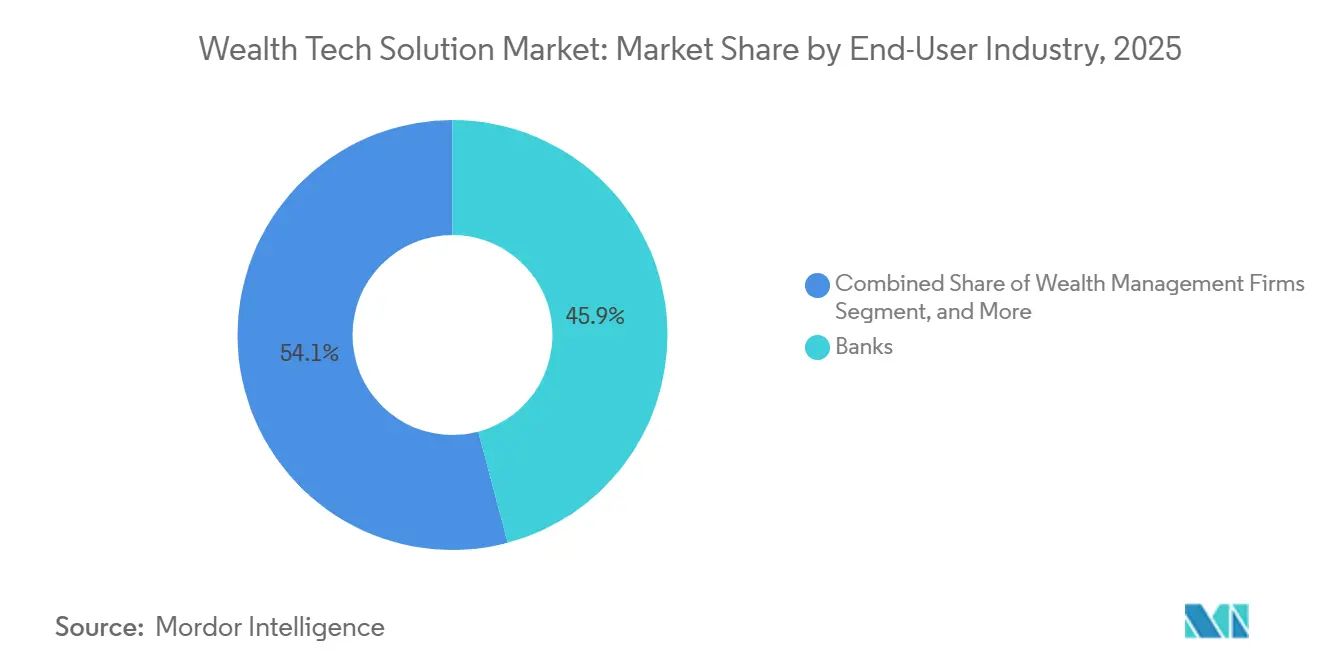
- By end-user industry, banks held 45.87% of the wealth tech solution market share in 2025, but fintech platforms and neobanks are forecast to grow at a 16.46% CAGR across the same horizon.
- By enterprise size, large enterprises accounted for 56.17% of spending in 2025, yet small and medium-sized enterprises are set to grow at a 15.96% CAGR as consumption-based pricing gains traction.
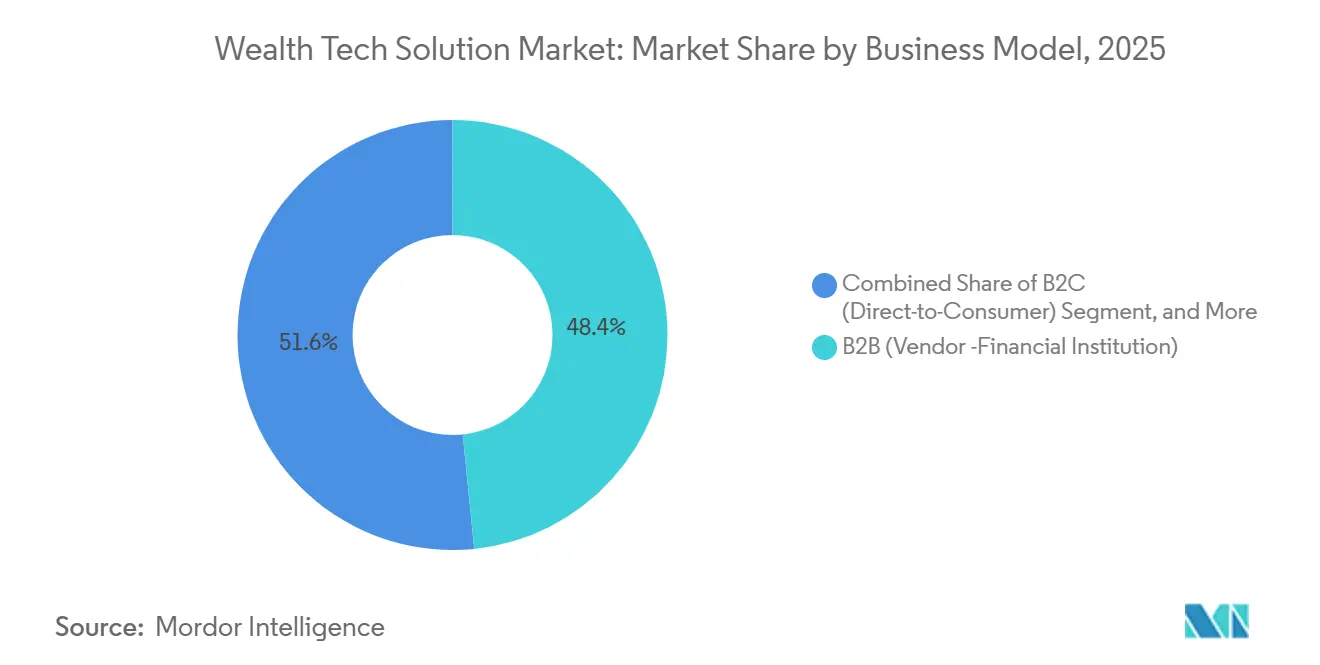
- By business model, business-to-business sales delivered 48.38% of 2025 revenue, while business-to-business-to-consumer and white-label platforms are on pace for a 16.06% CAGR to 2031.
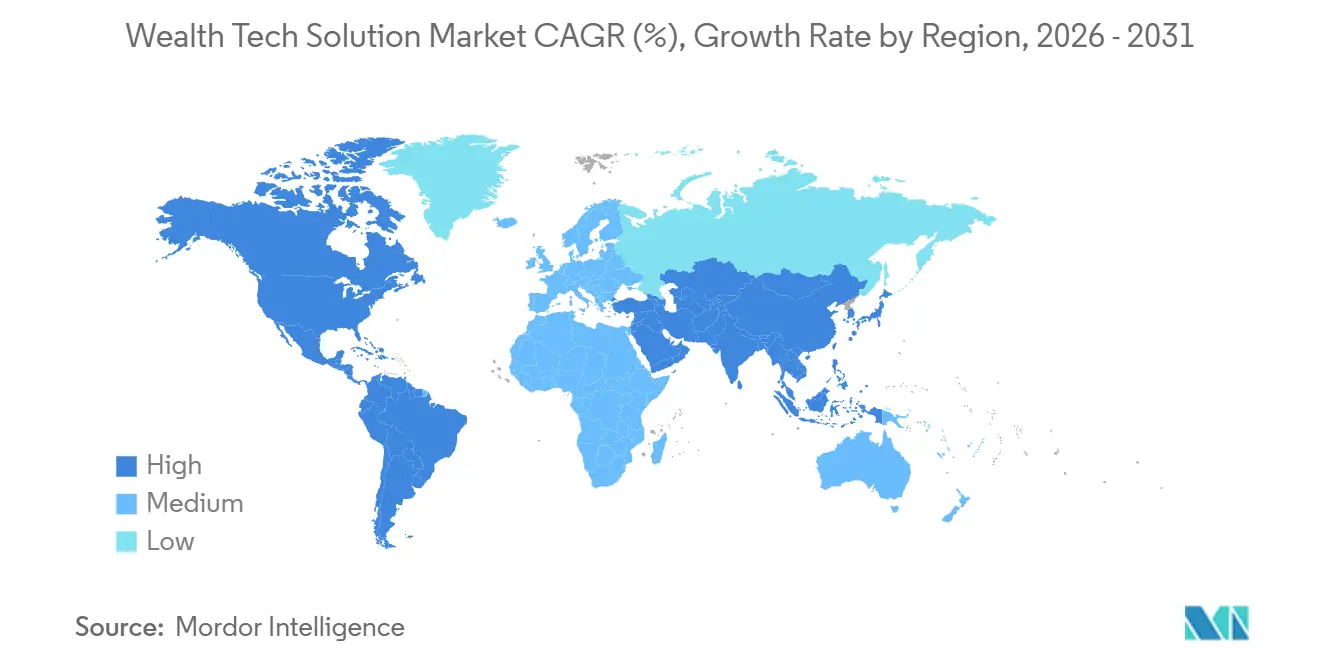
- By geography, North America accounted for 39.91% of global revenue in 2025, while Asia-Pacific is projected to post the fastest regional CAGR of 16.68% through 2031.
Note: Market size and forecast figures in this report are generated using Mordor Intelligence’s proprietary estimation framework, updated with the latest available data and insights as of January 2026.
Global Wealth Tech Solution Market Trends and Insights
Drivers Impact Analysis*
| Driver | (~) % Impact on CAGR Forecast | Geographic Relevance | Impact Timeline |
|---|---|---|---|
| Mainstream Digital-Banking Adoption Accelerates Wealth-Tech Uptake | +3.2% | Global, concentrated in North America and Europe | Short term (≤ 2 years) |
| Regulatory Push Toward Open-Finance APIs | +2.8% | Europe and North America, spillover to Asia-Pacific | Medium term (2-4 years) |
| Rising Gen Z and Millennial Demand For Self-Directed and Hybrid Advisory Tools | +2.5% | Global, early adoption in North America and Asia-Pacific urban centers | Medium term (2-4 years) |
| AI-Driven Hyper-Personalization Improves Conversion and Retention | +2.3% | Global, led by North America and select Asia-Pacific markets | Short term (≤ 2 years) |
| Embedded Wealth Features Inside Payroll Platforms Unlock SME Channel | +1.9% | North America and Europe, emerging in Asia-Pacific | Long term (≥ 4 years) |
| Quantum-Secure Encryption Mandates Spur Refresh Of Wealth-Core Architectures | +1.5% | Europe, North America, spillover to Asia-Pacific | Long term (≥ 4 years) |
| Source: Mordor Intelligence | |||
Mainstream Digital-Banking Adoption Accelerates Wealth-Tech Uptake
Rapid migration to mobile banking gives financial institutions a ready-made channel for cross-selling investment products. In 2025, 68% of United States community banks and credit unions signaled plans to embed robo-advisory tools into their apps by 2026, up from 42% in 2024.[1]Alkami Technology, “Digital Banking Survey 2025,” alkami.com Younger cohorts reinforce this shift, with 62% of Gen Z and millennials preferring to invest through the same application they use for daily payments. Citi Sky’s rollout illustrates the upside, the feature lifted digitally active assets under management by 34% within six months. As banking apps normalize wealth features, standalone robo-advisors face margin pressure unless they cultivate white-label partnerships, and core-banking vendors must decide whether to build or buy wealth capabilities.
Regulatory Push Toward Open-Finance APIs
Open-data mandates are dismantling proprietary data silos, enabling best-of-breed modules to interoperate across custodians. The CFPB’s Section 1033 rule obliges depository institutions to provide machine-readable account data, enabling advisors to consolidate positions under a single view. In Europe, the Payment Services Directive 3 extends similar rights to investment accounts, while the Digital Operational Resilience Act tightens oversight of critical third-party providers. Although compliance can exceed USD 5 million for systemically important banks, first movers stand to win mandates from institutions that would rather outsource resilient infrastructure than retrofit legacy codebases.
Rising Gen Z and Millennial Demand for Self-Directed and Hybrid Advisory Tools
Investors under 40 expect to toggle seamlessly between algorithmic guidance and on-demand human support. Seventy-one percent of this cohort value hybrid access to certified planners, versus 48% of investors over 50. The preference extends to thematic and fractional portfolios, 43% of Wealthfront’s 2025 sign-ups chose socially responsible strategies. Advisors that layer real-time education and performance tracking onto mobile experiences recorded 22% higher retention than peers issuing quarterly PDFs. Platforms that offer tiered service levels within a unified stack avert operational silos and align with diverse wallet sizes.
AI-Driven Hyper-Personalization Improves Conversion and Retention
Artificial intelligence engines are evolving client engagement from static questionnaires to dynamic nudges that respond to life events. Advisory firms deploying predictive analytics registered 19% higher client retention and shaved onboarding times by 27%. Large language models further streamline reporting, Addepar’s narrative generator trims quarterly report preparation by 40%. Conversational interfaces such as Denali AI cut meeting prep in half by allowing advisors to query portfolios in plain language. In a market where user expectations mirror consumer-tech benchmarks, laggards risk brand erosion.
Restraints Impact Analysis*
| Restraint | (~) % Impact on CAGR Forecast | Geographic Relevance | Impact Timeline |
|---|---|---|---|
| Data-Privacy and Cloud-Sovereignty Regulations Raise Compliance Cost | -1.8% | Europe, Asia-Pacific, North America | Medium term (2-4 years) |
| Integration Debt With Legacy Core-Banking Systems | -1.5% | Global, concentrated in Europe and North America | Long term (≥ 4 years) |
| Digital-Identity Fraud Forces Multi-Factor Authentication Friction | -0.9% | Global | Short term (≤ 2 years) |
| Wealth-Tech Vendor Consolidation Triggers Client Disruption | -0.7% | North America and Europe | Short term (≤ 2 years) |
| Source: Mordor Intelligence | |||
Data-Privacy and Cloud-Sovereignty Regulations Raise Compliance Cost
Fines under Europe’s General Data Protection Regulation reached EUR 1.15 billion (USD 1.33 billion) in 2024, with financial services absorbing 28%.[2]European Data Protection Board, “GDPR Fines Report 2025,” edpb.europa.eu DORA compounds costs by mandating annual penetration tests and exit plans that allow institutions to replace cloud vendors on short notice, totaling USD 5 million for the largest banks. Similar localization mandates in China and India prevent vendors from hosting client data in a single region, prompting a pivot to sovereign clouds that carry a 15%-25% price premium. Vendors must balance resilience with cost discipline to remain competitive.
Integration Debt With Legacy Core-Banking Systems
Monolithic architectures built before 2015 rely on batch workflows and proprietary data formats that are incompatible with modern APIs. Chief technology officers estimate that 20%-40% of their technology budgets go to stitching together spaghetti integrations. Technical debt not only diverts funds from innovation but also hampers the deployment of machine-learning models, as 55% of institutions cite siloed data as a barrier to deployment. Firms choosing incremental over wholesale modernization risk operating dual stacks that inflate operational risk and extend payback timelines.
*Our forecasts treat driver/restraint impacts as directional, not additive. The impact forecasts reflect baseline growth, mix effects, and variable interactions.
Segment Analysis
By Solution Type: API Infrastructure Outpaces Monolithic Suites
Portfolio management and reporting software held 38.21% of the wealth-tech solutions market share in 2025, underscoring its role as the operational backbone for registered investment advisors. Yet API infrastructure is advancing at a 16.66% CAGR, signaling a pivot toward composable modules that institutions can embed into payroll systems and neobank apps. The wealth tech solution market size for API-centric offerings is projected to grow as white-label platforms compress launch cycles from 18 months to under 90 days.
Demand for robo-advisory remains robust, evidenced by Betterment’s USD 65 billion assets under management, but differentiation is drifting toward client engagement. Vendors such as Fidelity combine algorithmic allocation with certified-planner support, achieving engagement 4 times that of legacy portals. Risk, compliance, and RegTech modules enjoy steady tailwinds from DORA and Section 1033 reporting mandates, while data and AI engines have shifted from nice-to-have add-ons to core buying criteria.


By Deployment Mode: Hybrid Models Balance Sovereignty and Scale
Cloud is projected to account for 61.81% of spending in 2025, highlighting its dominant role in the market. However, hybrid configurations are experiencing significant growth, with an annual growth rate of 16.05%, as organizations strive to balance sovereignty mandates with the flexibility and scalability offered by elastic compute. This trend is driving the expansion of the wealth tech solution market size associated with hybrid deployments. For instance, European banks are increasingly adopting hybrid models to ensure client data remains within sovereign regions while leveraging public clouds for computationally intensive tasks, such as running Monte Carlo simulations.
Wealth-tech solutions market. On-premise solutions continue to hold a strong position, particularly among ultra-high-net-worth family offices and in jurisdictions that prioritize minimizing third-party risks. The implementation of the Digital Operational Resilience Act (DORA), which mandates that data must be portable across providers, adds complexity to migration timelines. However, advancements in secure access service edge (SASE) frameworks are facilitating this transition. By integrating network security and cloud connectivity into a unified policy engine, SASE frameworks are helping organizations streamline their migration processes while maintaining robust security measures.
By End-User Industry: Neobanks Challenge Incumbents
Banks retained 45.87% of the wealth tech solution market share in 2025, but fintech platforms and neobanks are expanding at a 16.46% compound annual growth rate (CAGR) as they unbundle advisory services from traditional checking relationships. This shift is driven by the increasing demand for digital-first solutions that offer convenience, transparency, and cost efficiency. Robinhood’s USD 26.5 billion in retirement assets and BoursoBank’s EUR 1 billion (USD 1.13 billion) first-year robo inflows validate the growing digital momentum in the wealth tech market, highlighting the appeal of automated and user-friendly platforms among younger and tech-savvy investors.
Registered investment advisors are increasingly adopting enterprise platforms to address fee compression challenges, which are becoming more pronounced as competition intensifies and clients demand more value for their money. At the same time, insurers, pension funds, and corporate treasuries are opting for modular technology stacks that align with sector-specific regulatory requirements, ensuring compliance while maintaining operational flexibility. Vendors offering multi-tenant architectures are well-positioned to serve a wide range of use cases without code forks, enabling them to efficiently cater to diverse client needs while safeguarding their profit margins as their client bases diversify and expand. This adaptability is critical in a market where customization and scalability are key differentiators for long-term success.
By Enterprise Size: SMEs Adopt Consumption-Based Pricing
Large enterprises accounted for 56.17% of 2025 deployments, yet small and medium-sized enterprises are scaling at a 15.96% CAGR as vendors unbundle compliance modules and launch subscription tiers starting at USD 500 per month. This trend is enabling smaller firms to access advanced tools and services that were previously out of reach, effectively shrinking time-to-value for advisors managing under USD 100 million in assets. By offering cost-effective solutions, vendors are empowering SMEs to compete more effectively in the market.
Multi-currency robo platforms aimed at community banks in Southeast Asia highlight how vertically aligned templates reduce localization overhead. These platforms are designed to address the unique needs of specific markets, reducing the complexity and cost of adapting solutions for regional requirements. To win the SME segment, vendors must maintain strict data isolation while allowing role-based configuration that can flex from a 10-user firm to a 500-advisor network. This flexibility ensures that solutions can scale alongside the growth of the businesses they serve, providing long-term value and adaptability.
By Business Model: White-Label Platforms Preserve Client Relationships
Business-to-business deals accounted for 48.38% of revenue in 2025. However, business-to-business-to-consumer frameworks are experiencing significant growth, with a CAGR of 16.06%, as they enable financial institutions to outsource code development while maintaining their brand visibility. This approach allows institutions to leverage external expertise without compromising their market presence. The wealth tech solution market size for white-label APIs is projected to surpass that of direct licenses, especially if client acquisition costs for stand-alone robo-advisors continue to exceed USD 300 per account. This trend highlights the growing preference for flexible and scalable solutions in the market.
Acquirers such as JPMorgan are using modular platforms like WealthOS to seamlessly integrate complex rebalancing engines into widely used mobile applications without overhauling their core systems. This strategy not only enhances operational efficiency but also ensures a smoother user experience. Meanwhile, direct-to-consumer players are adopting a hedging strategy by embedding their services within employer ecosystems. For instance, Stash’s strategic pivot in 2025 demonstrates a shift toward convergence rather than outright channel displacement, reflecting the evolving dynamics of the wealth tech landscape.
Geography Analysis
North America generated 39.91% of 2025 revenue, propelled by more than 15,000 registered investment advisors and the earliest adoption of robo-advisory among mass-affluent households. The compulsory rollout of Section 1033 is boosting aggregation demand, while Vanguard Digital Advisor’s minimum investment cut to USD 100 broadened access for first-time investors. Canada’s market revolves around five dominant banks, making integration partnerships critical, whereas Mexico’s regulatory reforms are sparking interest from United States-based platforms seeking fresh growth corridors.
Asia-Pacific is the fastest-growing region, registering a 16.68% CAGR through 2031. Hong Kong clients show high readiness for AI-based portfolio management, and Singapore continues to position itself as a wealth hub for Southeast Asia. Avaloq’s April 2026 expansion into Japan and Australia underscores vendor interest in countries where aging populations and historically low yields are pushing savers toward equities. India’s mutual-fund assets more than doubled between 2020 and 2024, catalyzing demand for digital distribution that bypasses legacy broker networks.
Europe’s outlook hinges on the phased enforcement of PSD3, the Payment Services Regulation, and DORA, all of which converge by 2027. While the Nordics embrace public-cloud deployments, Germany emphasizes private clouds, and the United Kingdom refines suitability rules for robo-advisors, signaling persistent fragmentation.[3]Financial Conduct Authority, “Robo-Advisor Suitability Guidance 2025,” fca.org.uk South America’s momentum centers on Brazil, where instant payments and open banking rails invite embedded investment in use cases. In the Middle East and Africa, the United Arab Emirates and Saudi Arabia lead pilot programs within regulatory sandboxes, whereas South Africa integrates wealth management modules into established banking apps to expand access among the region’s growing middle class.

Competitive Landscape
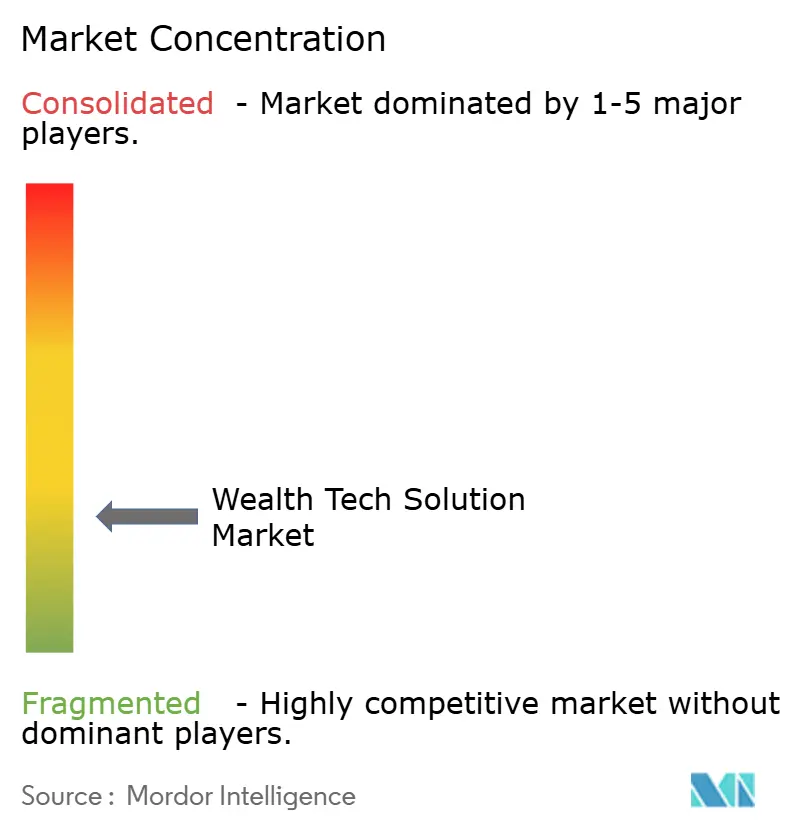
The wealth tech solution market is moderately fragmented, with the top 10 vendors accounting for roughly 45%-50% of global revenue, and no single player commands more than 12%. Consolidation is accelerating as incumbents close capability gaps via acquisition. Charles Schwab’s USD 660 million purchase of Forge Global adds private-market trading, and JPMorgan’s WealthOS deal inserts modular wealth-as-a-service components into the Chase ecosystem.[4]Charles Schwab, “Forge Global Acquisition 2026,” schwab.com White-space opportunities remain in embedded finance and in servicing registered investment advisors with under USD 500 million in assets, a demographic underserved by legacy enterprise platforms.
Artificial-intelligence functionality is the current differentiator. Envestnet’s predictive cash-flow analytics and Addepar’s language-model reporting move AI from peripheral pilot to core workflow. Smaller platforms respond by targeting regulatory niches or geographic segments. Valuefy focuses on Indian family offices, InvestSuite supports European banks with consumption-based fees, and Bambu caters to Southeast Asian community banks. DORA’s stringent oversight demands, including annual penetration testing, push smaller vendors to seek ISO 27001 and SOC 2 credentials earlier, indirectly nudging market share toward capitalized providers.
Advisory firms are increasingly evaluating vendors based on their ability to integrate seamlessly with existing systems and their readiness to meet compliance requirements. Orion Advisor Tech’s Denali AI highlights the growing trend toward conversational data exploration, which significantly reduces the time required to prepare for client meetings. Vendors that are slow to adopt AI capabilities risk having their offerings perceived as outdated, even if their core accounting functionalities remain robust. This shift is driven by evolving user expectations, which are increasingly influenced by advancements in retail technology rather than traditional financial tools.
Wealth Tech Solution Industry Leaders
InvestCloud LLC
Avaloq Group AG
FNZ Group Ltd.
Envestnet Inc.
Temenos AG
- *Disclaimer: Major Players sorted in no particular order

Recent Industry Developments
- April 2026: Avaloq expanded operations in Japan and Australia, extending coverage to more than 20 institutional clients.
- April 2026: Betterment rolled out upgraded tax-loss harvesting and goal-based planning interfaces.
- March 2026: Charles Schwab closed its USD 660 million acquisition of Forge Global, adding private-market capabilities.
- February 2026: Envestnet released predictive cash-flow analytics and automated tax-loss alerts in its Q1 2026 platform update.


Global Wealth Tech Solution Market Report Scope
The Wealth Tech Solution Market refers to the global ecosystem of digital platforms, software, and infrastructure that enable financial institutions and advisory firms to deliver, manage, and scale wealth management services through technology. This market encompasses solutions such as robo-advisory platforms, portfolio management and reporting systems, client engagement and digital advisory tools, risk and compliance (RegTech) modules, data analytics and AI-driven engines, and API-based integration and wealth-as-a-service infrastructure.
The Wealth Tech Solution Market Report is Segmented by Solution Type (Robo-Advisory Platforms, Portfolio Management and Reporting Software, Client Engagement and Digital Advisory Tools, Risk, Compliance and RegTech Modules, Data, Analytics and AI Engines, and API / Integration and Wealth-as-a-Service Infrastructure), Deployment Mode (Cloud, On-Premise, and Hybrid), End-User Industry (Banks, Wealth Management Firms, Registered Investment Advisors (RIAs), FinTech Platforms and Neobanks, and Rest of End-User Industries), Enterprise Size (Large Enterprises and Small and Medium-sized Enterprises), Business Model (B2C (Direct-to-Consumer), B2B (Vendor -Financial Institution), and B2B2C / White-Label Platforms), and Geography (North America, South America, Europe, Asia-Pacific, and Middle East and Africa). The Market Forecasts are Provided in Terms of Value (USD).
| Robo-Advisory Platforms |
| Portfolio Management and Reporting Software |
| Client Engagement and Digital Advisory Tools |
| Risk, Compliance and RegTech Modules |
| Data, Analytics and AI Engines |
| API / Integration and Wealth-as-a-Service Infrastructure |
| Cloud |
| On-Premise |
| Hybrid |
| Banks |
| Wealth Management Firms |
| Registered Investment Advisors (RIAs) |
| FinTech Platforms and Neobanks |
| Rest of End-User Industries |
| Large Enterprises |
| Small and Medium-sized Enterprises |
| B2C (Direct-to-Consumer) |
| B2B (Vendor -Financial Institution) |
| B2B2C / White-Label Platforms |
| North America | United States | |
| Canada | ||
| Mexico | ||
| South America | Brazil | |
| Argentina | ||
| Rest of South America | ||
| Europe | United Kingdom | |
| Germany | ||
| France | ||
| Italy | ||
| Spain | ||
| Rest of Europe | ||
| Asia-Pacific | China | |
| Japan | ||
| India | ||
| South Korea | ||
| Rest of Asia-Pacific | ||
| Middle East and Africa | Middle East | United Arab Emirates |
| Saudi Arabia | ||
| Rest of Middle East | ||
| Africa | South Africa | |
| Egypt | ||
| Rest of Africa | ||
| By Solution Type | Robo-Advisory Platforms | ||
| Portfolio Management and Reporting Software | |||
| Client Engagement and Digital Advisory Tools | |||
| Risk, Compliance and RegTech Modules | |||
| Data, Analytics and AI Engines | |||
| API / Integration and Wealth-as-a-Service Infrastructure | |||
| By Deployment Mode | Cloud | ||
| On-Premise | |||
| Hybrid | |||
| By End-User Industry | Banks | ||
| Wealth Management Firms | |||
| Registered Investment Advisors (RIAs) | |||
| FinTech Platforms and Neobanks | |||
| Rest of End-User Industries | |||
| By Enterprise Size | Large Enterprises | ||
| Small and Medium-sized Enterprises | |||
| By Business Model | B2C (Direct-to-Consumer) | ||
| B2B (Vendor -Financial Institution) | |||
| B2B2C / White-Label Platforms | |||
| By Geography | North America | United States | |
| Canada | |||
| Mexico | |||
| South America | Brazil | ||
| Argentina | |||
| Rest of South America | |||
| Europe | United Kingdom | ||
| Germany | |||
| France | |||
| Italy | |||
| Spain | |||
| Rest of Europe | |||
| Asia-Pacific | China | ||
| Japan | |||
| India | |||
| South Korea | |||
| Rest of Asia-Pacific | |||
| Middle East and Africa | Middle East | United Arab Emirates | |
| Saudi Arabia | |||
| Rest of Middle East | |||
| Africa | South Africa | ||
| Egypt | |||
| Rest of Africa | |||


Key Questions Answered in the Report
How large is the wealth tech solution market today and how fast is it growing?
The wealth tech solution market size reached USD 7.91 billion in 2026 and is projected to climb to USD 15.38 billion by 2031 at a 15.46% CAGR.
Which solution type currently leads spending?
Portfolio management and reporting software held the largest wealth tech solution market share at 38.21% in 2025, well ahead of other categories.
What is the fastest-growing deployment model?
Hybrid deployment is the fastest-growing approach, rising at a 16.05% CAGR as firms blend sovereign data residency with public-cloud scalability.
Which region will add the most incremental revenue by 2031?
Asia-Pacific is set to contribute the greatest incremental gains, expanding at a 16.68% CAGR on the back of regulatory liberalization and wealth creation.
How are small and medium-sized enterprises influencing vendor strategies?
SMEs are adopting consumption-based pricing that removes hefty upfront fees, prompting vendors to launch modular, multi-tenant architectures tailored to lower entry budgets.
What competitive moves are shaping the landscape?
Large incumbents are buying specialized fintechs, evidenced by Charles Schwab acquiring Forge Global and JPMorgan purchasing WealthOS, to accelerate time-to-market for new capabilities.
Page last updated on:


