Wealth Management Platform Market Size and Share
Market Overview
| Study Period | 2020 - 2031 |
|---|---|
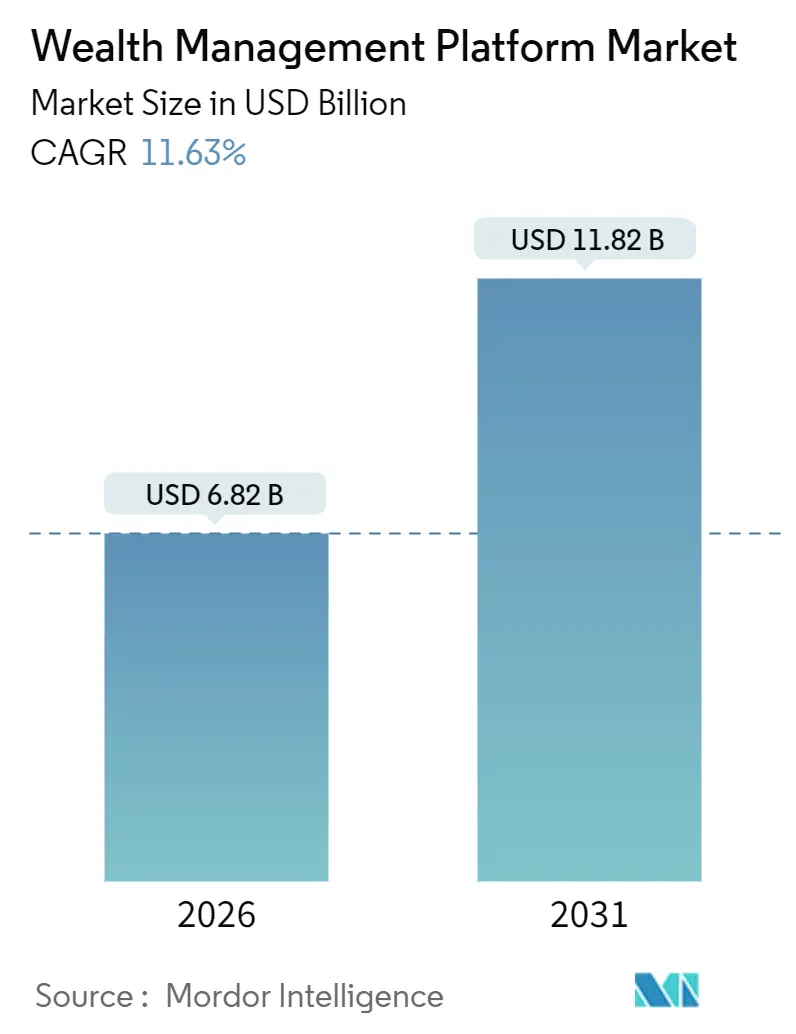
| Market Size (2026) | USD 6.82 Billion |
| Market Size (2031) | USD 11.82 Billion |
| Growth Rate (2026 - 2031) | 11.63% CAGR |
| Fastest Growing Market | Asia Pacific |
| Largest Market | North America |
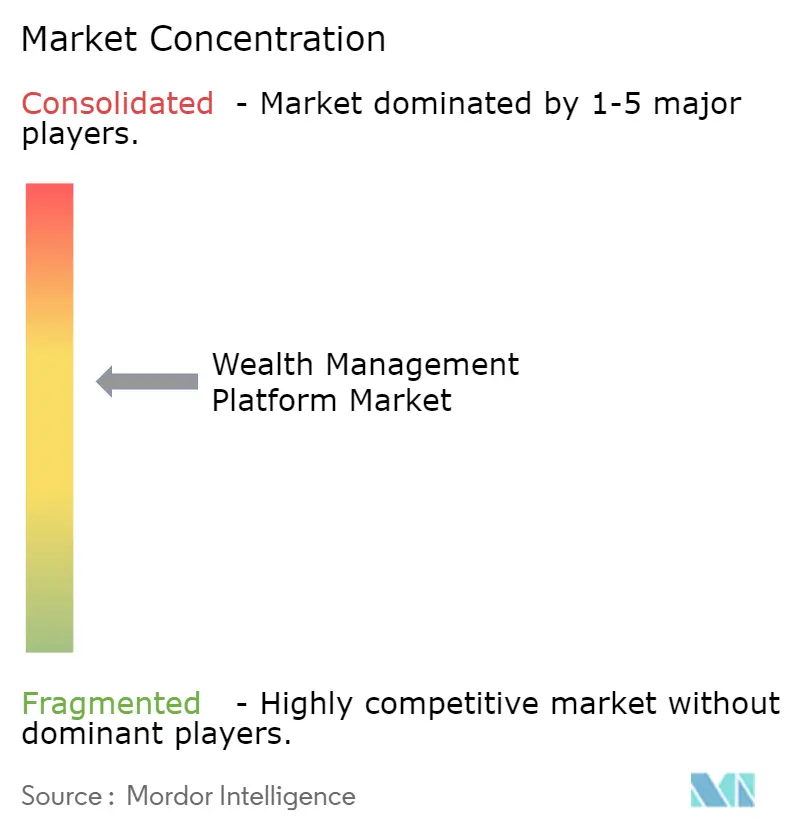
| Market Concentration | Medium |
Major Players *Disclaimer: Major Players sorted in no particular order Image © Mordor Intelligence. Reuse requires attribution under CC BY 4.0. | |
Wealth Management Platform Market Analysis by Mordor Intelligence
The wealth management platform market size reached USD 6.82 billion in 2026 and is projected to climb to USD 11.82 billion by 2031, reflecting an 11.63% CAGR. Growth is being propelled by cloud-first architectures that eliminate manual reconciliation, regulatory shifts that favor fee-based advisory, and data-rich engines that now ingest alternative datasets, tokenized-asset registries, and behavioral signals in real time. Large banks still anchor overall spending, yet family offices and registered investment advisors (RIAs) are scaling fastest as they trade spreadsheets for institutional-grade analytics. Competitive pressure from neobank-embedded wealth modules is compressing pricing, while Europe’s Digital Operational Resilience Act (DORA) is forcing vendors to redirect cash from product innovation to third-party risk controls. Generative AI copilots, ESG analytics, and embedded compliance workflows together promise to reset advisor productivity economics, widening the addressable pool of affluent and mass-affluent investors.
Key Report Takeaways
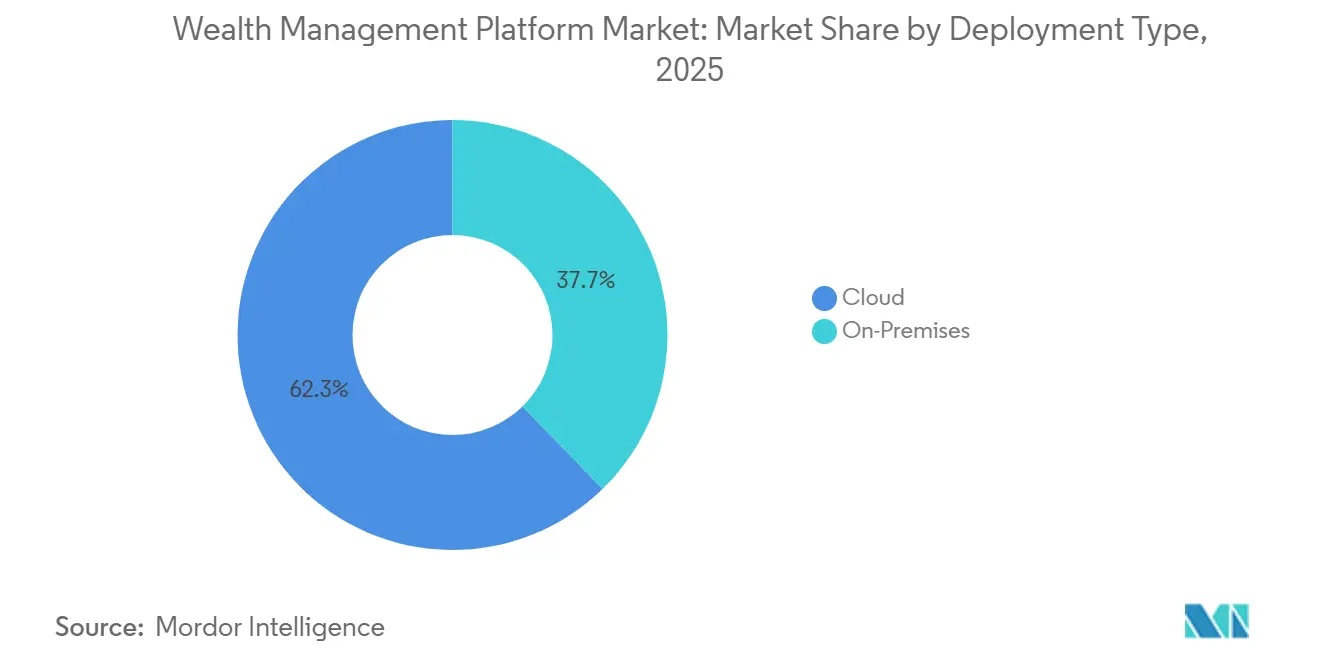
- By deployment type, cloud solutions captured 62.32% of the wealth management platform market share in 2025 and are projected to expand at a 12.18% CAGR through 2031.
- By end-user industry, family offices and RIAs are advancing at a 13.36% CAGR to 2031 while banks held a 38.13% revenue share in 2025.
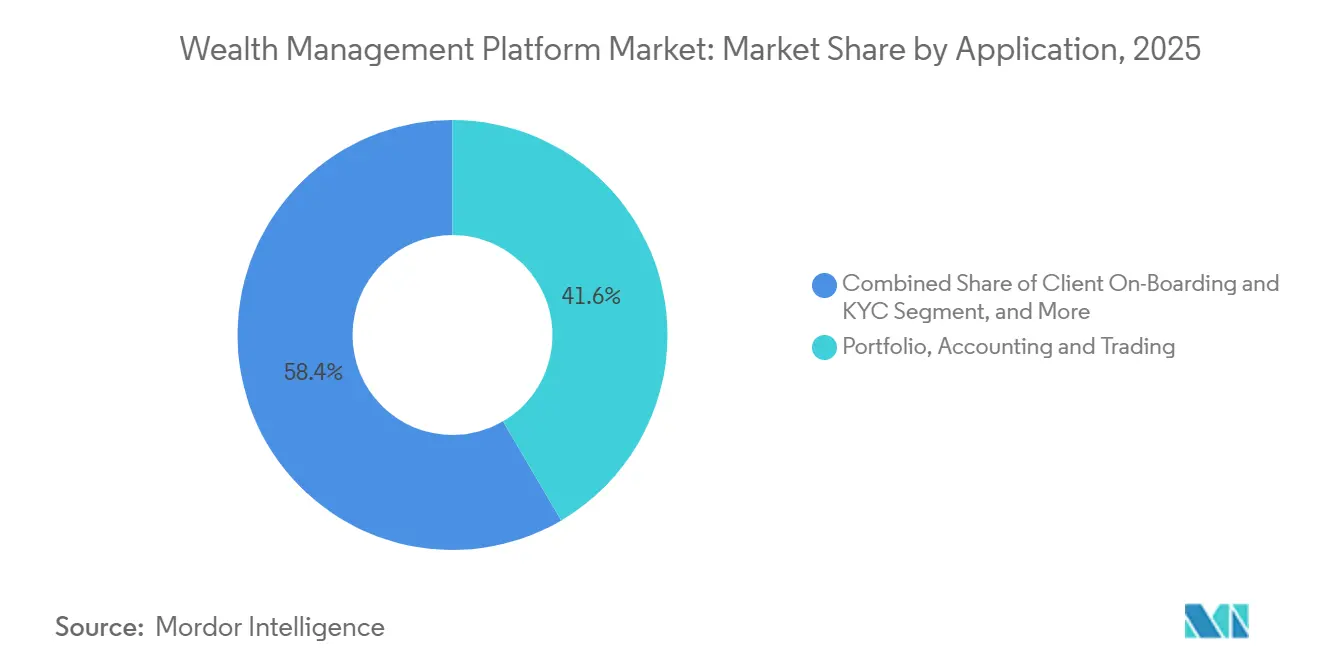
- By application, onboarding and know-your-customer workflows posted the fastest trajectory with a 14.63% CAGR, whereas portfolio, accounting, and trading modules led with 41.57% revenue share in 2025.
- By enterprise size, SMEs are forecast to grow 13.52% per year through 2031 even as large enterprises commanded 64.31% of spending in 2025.
- By geography, Asia-Pacific is projected to register a 14.71% CAGR through 2031 while North America retained 34.31% of global revenue in 2025.
Note: Market size and forecast figures in this report are generated using Mordor Intelligence’s proprietary estimation framework, updated with the latest available data and insights as of January 2026.
Global Wealth Management Platform Market Trends and Insights
Drivers Impact Analysis*
| Driver | (~) % Impact on CAGR Forecast | Geographic Relevance | Impact Timeline |
|---|---|---|---|
| AI Copilots Slashing Advisor Productivity Costs | +2.5% | Global | Short term (≤ 2 years) |
| Shift to Fee-Based Advisory and Decumulation Planning | +2.1% | North America and Europe | Short term (≤ 2 years) |
| Rise of Embedded Wealth Solutions in Neobanks and Super-Apps | +1.9% | Asia-Pacific, Europe, Latin America | Medium term (2-4 years) |
| Integration of ESG Scoring and Sustainability Analytics | +1.8% | Europe and North America | Medium term (2-4 years) |
| Demand for Hyper-Personalized Behavioral-Finance Planning | +1.6% | North America, Asia-Pacific | Medium term (2-4 years) |
| Tokenized Funds Enabling Fractional HNWI Access | +1.4% | Asia-Pacific and Middle East | Long term (≥ 4 years) |
| Source: Mordor Intelligence | |||


AI Copilots Slashing Advisor Productivity Costs
Generative models trained on financial-planning corpora now draft meeting notes, investment policy statements, and rebalancing orders within seconds, freeing up 20-30% of staff time. Natural-language interfaces let non-technical advisors query complex datasets without navigating multi-tab dashboards, smoothing adoption across varying skill levels. Early adopters report higher client-to-advisor ratios without lowering service quality, a capability critical for RIAs whose median book tops 100 households. Regulators insist on auditable AI outputs, prompting vendors to log inputs, outputs, and human overrides, yet compliance demands have not slowed deployment. With talent costs rising, firms see AI copilots as a direct lever to defend margins even as fee compression intensifies.
Shift to Fee-Based Advisory and Decumulation Planning
Regulation Best Interest and Form CRS shifted broker-dealers toward fiduciary-style models, turning per-trade commission structures into compliance liabilities. Wrap accounts now dominate new asset flows, spiking demand for platforms that automate multi-custodian billing, tax-lot accounting, and performance reporting. North America’s aging investor base has sharpened focus on decumulation, driving uptake of Monte Carlo engines and Social Security optimization modules that justify advisory fees beyond basic allocation. Surveys show nearly seven in ten wealth managers intend to add retirement-income features within 18 months, underlining immediate revenue opportunities. Vendors integrating withdrawal simulators and longevity-risk analytics differentiate sharply as retirees seek certainty in higher-rate environments.
Rise of Embedded Wealth Solutions in Neobanks and Super-Apps
Digital banks across Singapore, Brazil, and Germany now bundle zero-commission trading and fractional investing inside everyday payment apps, luring younger cohorts who value convenience over in-person advice. These super-apps shorten account opening to minutes through biometric KYC, pushing incumbents to match their frictionless onboarding. For platform vendors, white-label APIs that slot into consumer apps create new distribution channels without the expense of a retail footprint. Yet the model exerts pricing pressure because embedded partners expect revenue-sharing economics rather than license fees. Regulators remain cautious, especially around suitability rules, but sandboxes in Singapore and Switzerland have paved viable paths to scale.[1]Monetary Authority of Singapore, “Regulatory Sandbox,” MAS.gov.sg
Integration of ESG Scoring and Sustainability Analytics
Carbon transition risk has transformed ESG from marketing gloss to quantifiable liability, evidenced by tools like Aladdin Climate assessing USD 23 trillion in assets by 2024. Europe’s Sustainable Finance Disclosure Regulation forces product-level reporting, leading vendors to hard-wire third-party ESG data feeds and automated taxonomy mapping. Divergent issuer scores, often 50% apart across providers, compel platforms to present multi-source overlays so advisors can pick preferred methodologies. Partnerships with carbon-accounting APIs accelerated in 2025, letting advisors display scope-3 footprints during client reviews. Demand is strongest in Europe yet spreading globally as institutional allocators elevate climate metrics in mandates.
Restraints Impact Analysis*
| Restraint | (~) % Impact on CAGR Forecast | Geographic Relevance | Impact Timeline |
|---|---|---|---|
| Fragmented Data Standards Across Custodians | -1.5% | Global | Medium term (2-4 years) |
| Talent Drain to Fintech Start-Ups | -1.2% | North America and Europe | Short term (≤ 2 years) |
| Cyber-Resilience Obligations Raising Compliance Spend | -1.0% | Europe and North America | Short term (≤ 2 years) |
| Bank and Fintech Balance-Sheet Pressure in Higher-Rate Cycle | -0.9% | Global | Short term (≤ 2 years) |
| Source: Mordor Intelligence | |||
Fragmented Data Standards Across Custodians
Each custodian delivers position and transaction feeds in proprietary formats, forcing vendors to maintain dozens of brittle connectors and raising engineering costs. Real-time updates stall when even one feed fails, often leaving advisors to reconcile manually at day-end. Standardization attempts through ISO 20022 or FIX remain piecemeal, as custodians view data formats as stickiness levers. A unified API pilot launched by the Depository Trust and Clearing Corporation has been slow to win broad adoption, keeping integration bottlenecks front-and-center. High switching costs deter advisors from migrating platforms, muting competitive churn but also stifling innovation velocity.
Talent Drain to Fintech Start-Ups
Venture-backed wealth-tech challengers raised USD 30 billion in Series A and B funding during 2024, siphoning product managers and data engineers from established vendors. Incumbents counter with retention bonuses and longer-term career paths, yet equity upside and rapid release cycles remain hard to match. Extended hiring timelines delay feature roadmaps, particularly in AI and blockchain integration, widening perception gaps between legacy suites and challenger stacks. Europe and North America feel the pinch most acutely given dense fintech ecosystems and ready venture capital. The brain drain constricts incumbents’ capacity to meet evolving regulatory tech mandates, compounding compliance risk.
*Our forecasts treat driver/restraint impacts as directional, not additive. The impact forecasts reflect baseline growth, mix effects, and variable interactions.
Segment Analysis
By Deployment Type: Cloud Architectures Dominate Scalability
Cloud platforms held 62.32% of the wealth management platform market in 2025 and are expected to grow at a 12.18% CAGR to 2031. The wealth management platform market size for cloud deployments is therefore set to overtake on-premise spending long before the forecast horizon. Advisors value mobile access, real-time collaboration, and automatic upgrades that remove server management headaches. Multi-tenant designs let vendors amortize development across thousands of clients, accelerating release cadence while lowering per-seat pricing. Large banks still maintain hybrid environments to satisfy data-sovereignty rules, yet even these institutions off-load non-sensitive workloads to the cloud as hyperscale providers expand regional availability zones.
Vendor roadmaps now revolve around cloud-native modules that plug in via APIs, enabling rapid rollout of AI copilots, ESG dashboards, and decumulation engines without rewriting core code. SMEs gravitate to subscription pricing that aligns with variable revenue streams, further widening the cloud adoption gap versus on-premise. European DORA requirements add due-diligence layers for third-party providers, but respondents to a 2025 Deloitte survey still plan to boost cloud budgets by 74% within two years. Latency concerns have eased thanks to edge compute nodes that support real-time trade execution. Consequently, on-premise now serves principally as a legacy bridge rather than strategic preference.

By End-User Industry: Family Offices and RIAs Outpace Banks
Banks retained 38.13% of 2025 revenue, yet family offices and RIAs are accelerating at 13.36% per year, the fastest clip in the wealth management platform market. Platform decisions inside banks must clear centralized governance, security audits, and multi-year budget cycles that sap implementation speed. In contrast, independent RIAs can deploy new tools within weeks, letting them capitalize on emerging features such as tokenized-asset support and behavioral-finance planning.
Family offices increasingly demand consolidated dashboards spanning private equity, real estate, and collectibles, needs unmet by broker-centric suites. Survey work shows 62% of single-family offices aim to abandon spreadsheets for integrated reporting by 2026, a trend that expands the wealth management platform market size for niche multi-asset modules. Advisors also prize automated fiduciary workflows that simplify Form ADV updates and custody reconciliation, tasks that burden small compliance teams. As legacy banks modernize at slower tempo, RIAs and family offices will keep chipping away at aggregate market share with cloud-native stacks tuned for speed.
By Application: Onboarding and KYC Surge on Regulatory Mandates
Portfolio, accounting, and trading modules captured 41.57% of 2025 revenue, yet onboarding and KYC tools are sprinting ahead at a 14.63% CAGR. The wealth management platform market share for onboarding is climbing because perpetual KYC, beneficial-ownership checks, and anti-money-laundering screenings now require continuous refreshes, not one-time verifications. Digital workflows using biometric authentication and OCR compress account-opening from days to minutes, crucial for advisors competing on client experience.
Regulators on both sides of the Atlantic demand granular disclosures of fees and conflicts, prompting firms to automate compliance documentation. Integrated onboarding engines link to sanctions lists and electronic signature services, cutting acquisition costs by 25% according to a 2025 McKinsey study. Meanwhile, planning and goal-based tools offer the most visible client touchpoint, converting projections into tangible progress visuals. Still, accurate portfolio data underpins every module, so core accounting engines remain indispensable even as their relative growth slows.

By Enterprise Size: SMEs Embrace Modular Pricing
Large enterprises generated 64.31% of 2025 spending, but SMEs will expand at 13.52% annually through 2031. API-first architectures allow smaller firms to buy only what they need, slashing upfront capex and trimming learning curves. The wealth management platform market size for SMEs gains momentum as pay-as-you-go pricing removes lock-in fears. BCG research shows SME advisors on cloud platforms book 18% higher revenue per head, attributing gains to automation that frees time for prospecting.
Large institutions still dominate absolute dollars, with sprawling advisor networks and multi-currency reporting needs. Yet their replacement cycles extend beyond a decade, limiting unit growth even as ticket sizes stay large. SMEs, unburdened by legacy cores, can pivot to emerging vendors offering specialized tax-loss engines, behavioral planning overlays, or AI copilots. This dynamism cements SMEs as the volume growth engine despite lower per-firm outlays.
Geography Analysis
North America contributed 34.31% of global 2025 revenue, reflecting the region’s dense RIA and broker-dealer ecosystem. Growth has steadied as the market approaches feature parity across incumbents, making mergers and acquisitions a common expansion path. Regulatory frameworks such as Regulation Best Interest have nudged advisors toward fee-based accounts, spurring upgrades to billing and compliance modules but not radically expanding addressable headcount.
Asia-Pacific is the fastest-growing region with a 14.71% CAGR projected through 2031. Rising wealth in China, India, and Southeast Asia is powering the wealth management platform market in the region as younger investors demand robo-advice and fractional shares delivered via mobile apps. Digital-first managers in Singapore and Hong Kong skip brick-and-mortar entirely, instead embedding wealth offerings within payments and lifestyle platforms. Local regulators encourage experimentation through sandboxes, although cross-border capital controls in China restrain international vendor penetration.
Europe occupies the middle ground. Open-banking mandates create account-aggregation opportunities, while DORA raises the bar on cyber-resilience, inadvertently benefiting vendors with mature incident-response tooling.[2]European Banking Authority, “Open Banking Regulations,” EBA.europa.eu The Middle East and South America are smaller today but exhibit strong pockets of demand; sovereign wealth managers in the United Arab Emirates and family offices in Brazil seek multi-asset reporting aligned with Islamic finance or local tax codes. Africa’s adoption clusters in South Africa and Kenya, where mobile-money rails facilitate digital onboarding and micro-investment products. Regional diversity in regulation and investor preferences requires vendors to localize tax engines, language packs, and custody connectors, favoring modular stacks that can toggle features by jurisdiction.


Competitive Landscape
The top five providers controlled 40-45% of 2025 revenue, indicating moderate concentration. SS&C Technologies, Fidelity National Information Services, and BlackRock dominate large-enterprise accounts, while niche challengers focus on family offices and growth-stage RIAs. Competition circles three axes: first, vertical integration; incumbents acquire custody or tax-optimization tools to deepen wallet share. Second, horizontal expansion; suites add modules for alternative assets and jurisdiction-specific compliance. Third, open-platform ecosystems; vendors expose APIs and marketplaces so advisors can bolt on point solutions without heavy customization.
Neobank disruptors pressure margins by embedding wealth features inside consumer super-apps, enticing younger clients with zero-commission trades. Incumbents counter by lowering account minimums and launching digital-advice channels, but legacy architectures slow time-to-market. Data science is emerging as a moat; one custodian filed a patent for attrition-prediction models that trigger proactive retention offers.[3]U.S. Patent and Trademark Office, “Client Attrition Prediction,” USPTO.gov Regulatory complexity both hinders and assists; it raises entry barriers for green-field startups, yet boosts demand for vendors that automate audits and maintain deep compliance content libraries tied to FINRA and ESMA standards.
Strategic moves in 2025 reinforced these themes. SS&C bought a portfolio-accounting specialist to bolster its RIA reach, while BlackRock enabled tokenized fund distribution to democratize private-market access. Temenos rolled out an AI compliance module cutting Form ADV prep hours by 40%, underscoring the race to embed automation across labor-intensive processes. Funding rounds, such as InvestCloud’s USD 150 million Series D, finance international expansion and embedded-wealth pilots within neobanks. Market share battles therefore hinge on speed of innovation, regulatory trust, and ecosystem breadth rather than pure feature checklists.
Wealth Management Platform Industry Leaders
Avaloq Group AG
Fidelity National Information Services (FIS)
Temenos AG
Prometeia SpA
Backbase BV
- *Disclaimer: Major Players sorted in no particular order

Recent Industry Developments
- December 2025: Fiserv partnered with a leading European custodian to roll out its cloud platform across 12 countries, including integration with local tax systems.
- November 2025: BlackRock added tokenized fund capabilities to Aladdin Wealth, slicing minimums to USD 10,000 for private equity and real estate access.
- October 2025: SS&C Technologies acquired a mid-sized portfolio-accounting vendor for USD 320 million, adding 1,200 RIA clients.
- September 2025: emenos launched an AI module that automates Form ADV updates, reporting a 40% cut in compliance hours for early adopters.


Research Methodology Framework and Report Scope
Market Definitions and Key Coverage
Our study defines the wealth management platform market as software solutions that allow financial institutions and advisors to consolidate a client's full balance sheet, plan goals, automate portfolio management, and meet front-to-mid-office compliance needs across desktop, tablet, and mobile interfaces.
Scope Exclusion: Hardware terminals and pure-play robo-advisory apps with no multi-asset rebalancing engine are kept outside this definition.
Segmentation Overview
- By Deployment Type
- On-Premise
- Cloud
- By End-User Industry
- Banks
- Trading Firms
- Brokerage Firms
- Investment Management Firms
- Family Offices and RIAs
- By Application
- Portfolio, Accounting and Trading
- Financial Planning and Goal-Based Advice
- Compliance and Risk Reporting
- Client On-Boarding and KYC
- By Enterprise Size
- Large Enterprises
- Small and Mid-Sized Enterprises (SME)
- By Geography
- North America
- United States
- Canada
- Mexico
- Europe
- Germany
- United Kingdom
- France
- Italy
- Spain
- Russia
- Rest of Europe
- Asia Pacific
- China
- Japan
- India
- South Korea
- ASEAN
- Australia and New Zealand
- Rest of Asia Pacific
- South America
- Brazil
- Argentina
- Rest of South America
- Middle East
- Saudi Arabia
- UAE
- Turkey
- Rest of Middle East
- Africa
- South Africa
- Nigeria
- Rest of Africa
- North America
Detailed Research Methodology and Data Validation
Primary Research
Mordor analysts interviewed portfolio system architects, private bank COOs, and regional wealth tech integrators across North America, Europe, and Asia-Pacific. These conversations clarified typical per-seat pricing, cloud migration pacing, and regional compliance triggers, allowing us to tighten the initial assumptions and align our model with real buyer behavior.
Desk Research
We began by mapping addressable spend using public datasets from bodies such as the Bank for International Settlements, FINRA, the European Securities and Markets Authority, and country central banks, which report advisor density, account volumes, and assets under management. Additional signals were drawn from global trade associations like the Investment Company Institute, open-access working papers in the Journal of Financial Planning, major banking 10-Ks, and press archives housed in Dow Jones Factiva. Paid micro-databases, D&B Hoovers for firm revenues and Volza for cross-border software shipments, helped anchor supplier footprints.
Subsequently, we screened regulatory filings, patent abstracts via Questel, and selected conference proceedings to size emerging features such as AI copilot modules and ESG scoring engines. The sources named are illustrative; many other repositories were tapped to complete, cross-check, and refresh the dataset.
Market-Sizing & Forecasting
A top-down reconstruction of the spending pool, linking advisor headcount, client segment penetration, and average platform outlay, serves as the starting point, which is then reconciled with targeted bottom-up checks such as sampled vendor average selling price multiplied by active deployments. Key variables feeding the model include: (1) annual assets under management growth, (2) regulatory filing frequency that mandates digital reporting, (3) cloud conversion rate within bank IT budgets, (4) advisor to client ratio trends, and (5) regional inflation adjusted license fees. Forecasts to 2030 rely on a multivariate regression that pairs these inputs with GDP and interest rate outlooks before scenario stress testing by our primary experts. Data gaps, for instance, unreported SME adoptions, are bridged through conservative interpolation guided by adjacent software take-up curves.
Data Validation & Update Cycle
Outputs pass a three-layer review: automated variance flags, senior analyst sense check, and sector lead sign-off. We refresh every twelve months, yet trigger interim updates when legislation, currency swings above 5%, or material vendor M&A would shift the baseline. Clients therefore receive the latest vetted view each time a report is downloaded.
Why Mordor's Wealth Management Platform Baseline Earns Trust
Published market values often diverge because studies choose different product mixes, license metrics, and refresh cadences.
Key gap drivers include whether maintenance fees are bundled, if robo-only apps are counted, the treatment of one-time implementation revenue, and how quickly foreign exchange movements are rolled through models. Mordor's scope anchors on recurring software revenue, converts all inputs at quarterly average FX, and updates annually; factors that compress drift versus peers.
Benchmark comparison
| Market Size | Anonymized source | Primary gap driver |
|---|---|---|
| USD 6.09 B (2025) | Mordor Intelligence | - |
| USD 5.50 B (2024) | Global Consultancy A | Includes single-module advisory tools and applies static 2022 FX rates |
| USD 2.95 B (2023) | Industry Journal B | Excludes cloud subscriptions and benchmarks only tier-one banks |
In short, our disciplined scope selection, variable transparency, and faster refresh cycle help decision makers rely on Mordor's balanced baseline when sizing opportunities or benchmarking growth plans.


Key Questions Answered in the Report
How large will the wealth management platform market be by 2031?
It is forecast to reach USD 11.82 billion, growing at an 11.63% CAGR from 2026 levels.
Which deployment model is expanding fastest?
Cloud-based platforms are projected to post a 12.18% CAGR through 2031, outpacing on-premise alternatives.
What segment is driving the highest growth in applications?
Onboarding and KYC workflows lead with a 14.63% CAGR as regulators demand perpetual client-due-diligence updates.
Why are family offices and RIAs adopting platforms rapidly?
They need consolidated multi-asset reporting, automated compliance, and flexible cloud modules, fueling a 13.36% CAGR.
Which region offers the strongest growth runway?
Asia-Pacific carries the highest forecast at 14.71% CAGR thanks to rising wealth pools and digital-first investment models.
How are AI copilots influencing advisor economics?
Early deployments cut administrative workloads by up to 30%, allowing firms to serve more clients without proportional head-count increases.
Page last updated on:


