Digital Asset Management Market Size and Share
Market Overview
| Study Period | 2020 - 2031 |
|---|---|
| Market Size (2026) | USD 7.51 Billion |
| Market Size (2031) | USD 14.42 Billion |
| Growth Rate (2026 - 2031) | 13.94% CAGR |
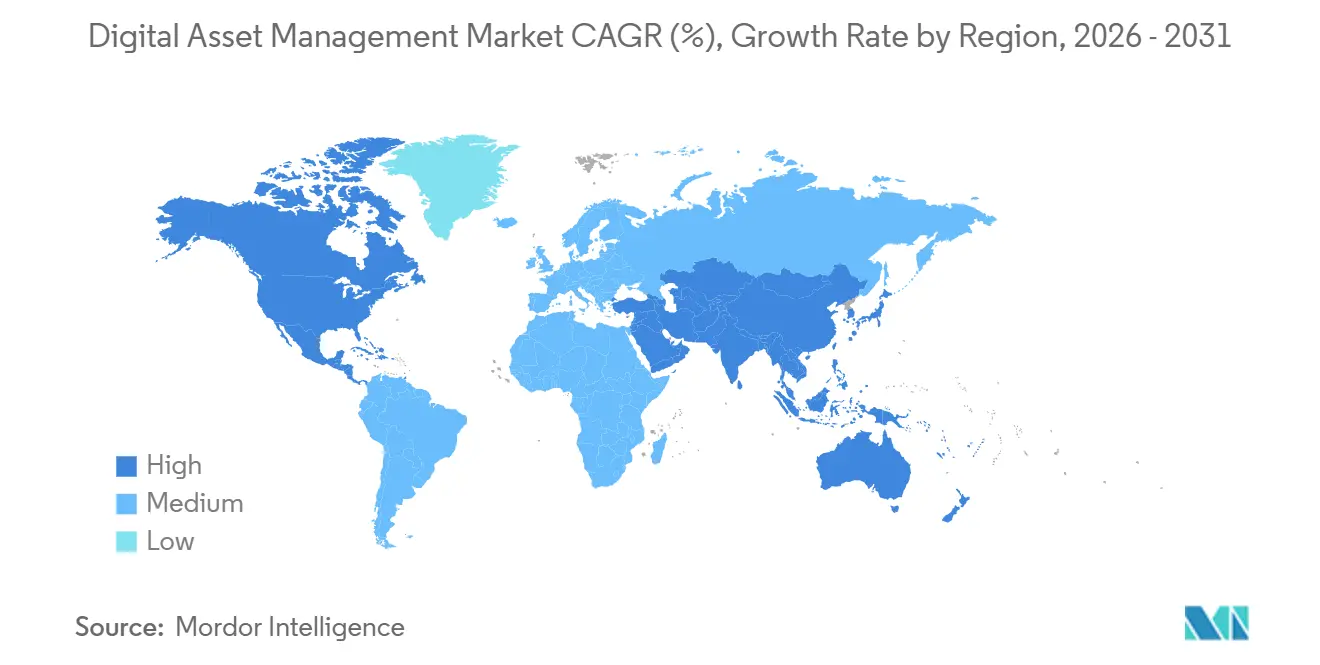
| Fastest Growing Market | Asia Pacific |
| Largest Market | North America |
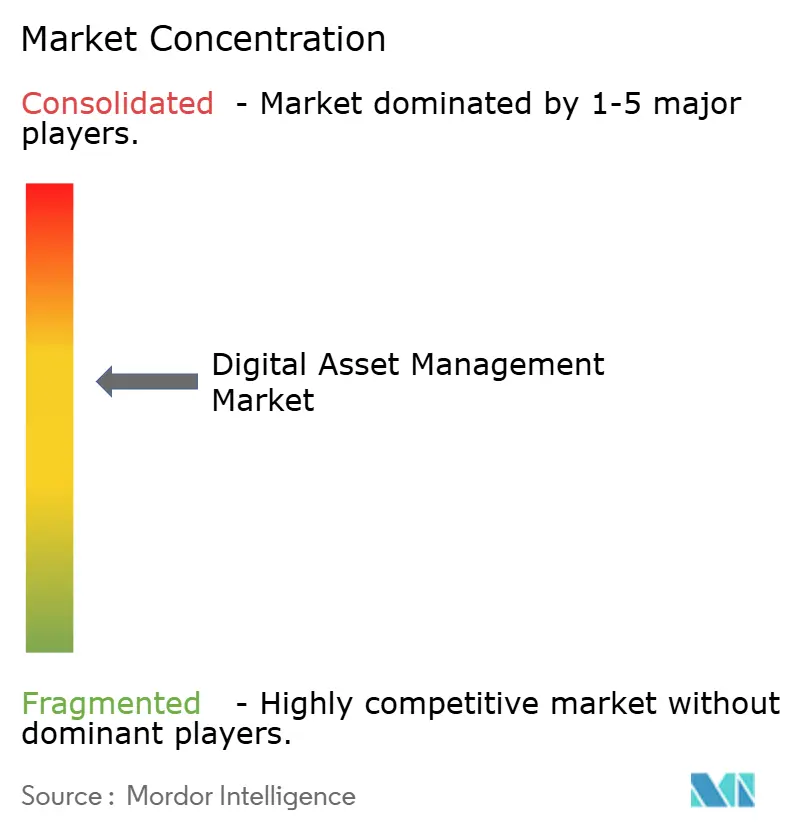
| Market Concentration | Medium |
Major Players *Disclaimer: Major Players sorted in no particular order Image © Mordor Intelligence. Reuse requires attribution under CC BY 4.0. | |
Digital Asset Management Market Analysis by Mordor Intelligence
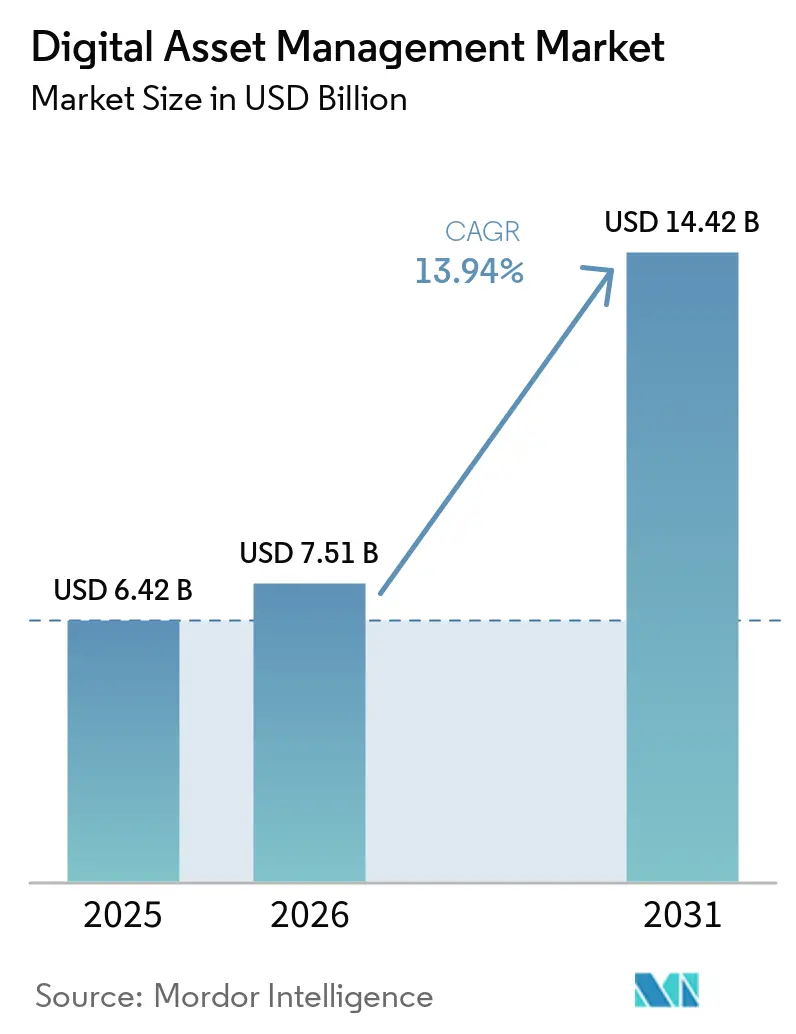
The digital asset management market size is projected to be USD 6.42 billion in 2025, USD 7.51 billion in 2026, and reach USD 14.42 billion by 2031, growing at a CAGR of 13.94% from 2026 to 2031. Accelerated content velocity in omnichannel commerce, the migration to cloud-native AI platforms, and tightening accessibility and data-sovereignty rules are reshaping vendor roadmaps. Vendors are shifting from storage-centric repositories toward orchestration layers that automate tagging, rights verification, and real-time asset syndication. Competitive dynamics intensified after Adobe’s purchase of Semrush and the Getty Images and Shutterstock merger, igniting a race to fuse DAM, SEO, and content intelligence. Generative AI, meanwhile, is becoming table stakes for enterprise clients that expect instant asset renditioning and semantic search.
Key Report Takeaways
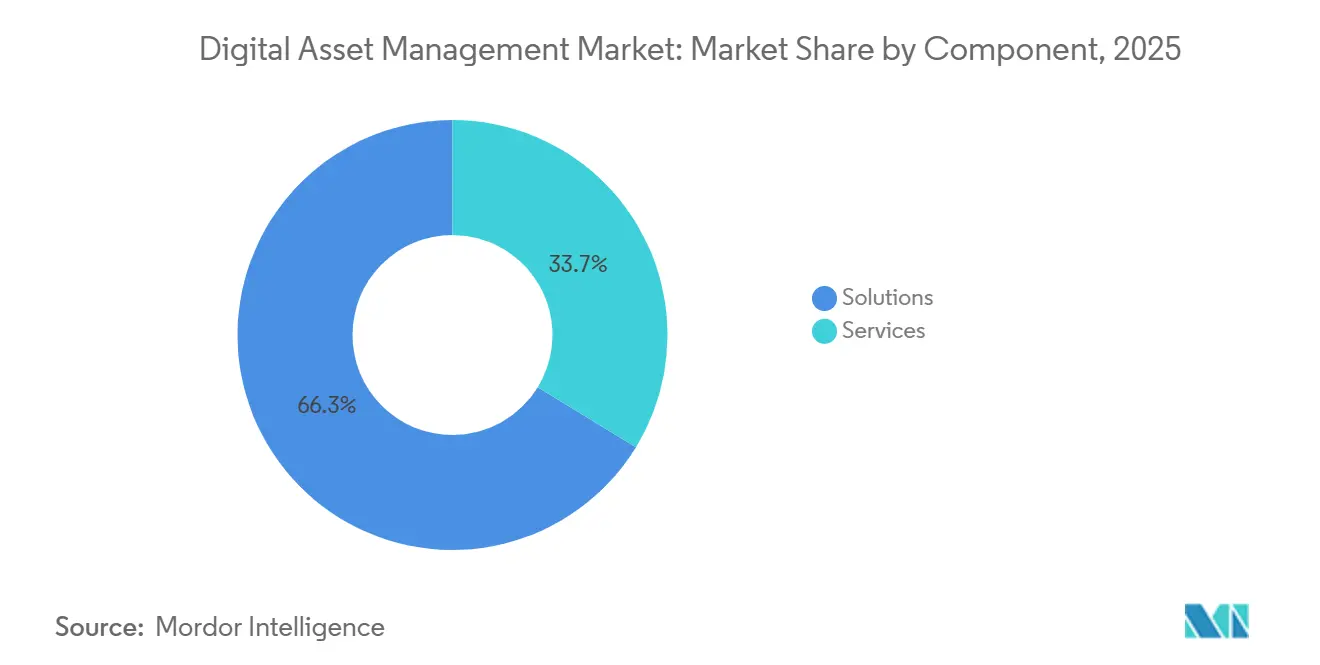
- By component, solutions led with 66.26% of the digital asset management market share in 2025, while services are advancing at a 14.33% CAGR through 2031.
- By deployment mode, on-premise installations held a 59.76% share in 2025, whereas cloud deployments are forecast to expand at a 14.29% CAGR to 2031.
- By organization size, large enterprises accounted for 62.98% of the digital asset management market in 2025, while Small and Medium Enterprises (SMEs) posted the fastest growth at a 14.01% CAGR.
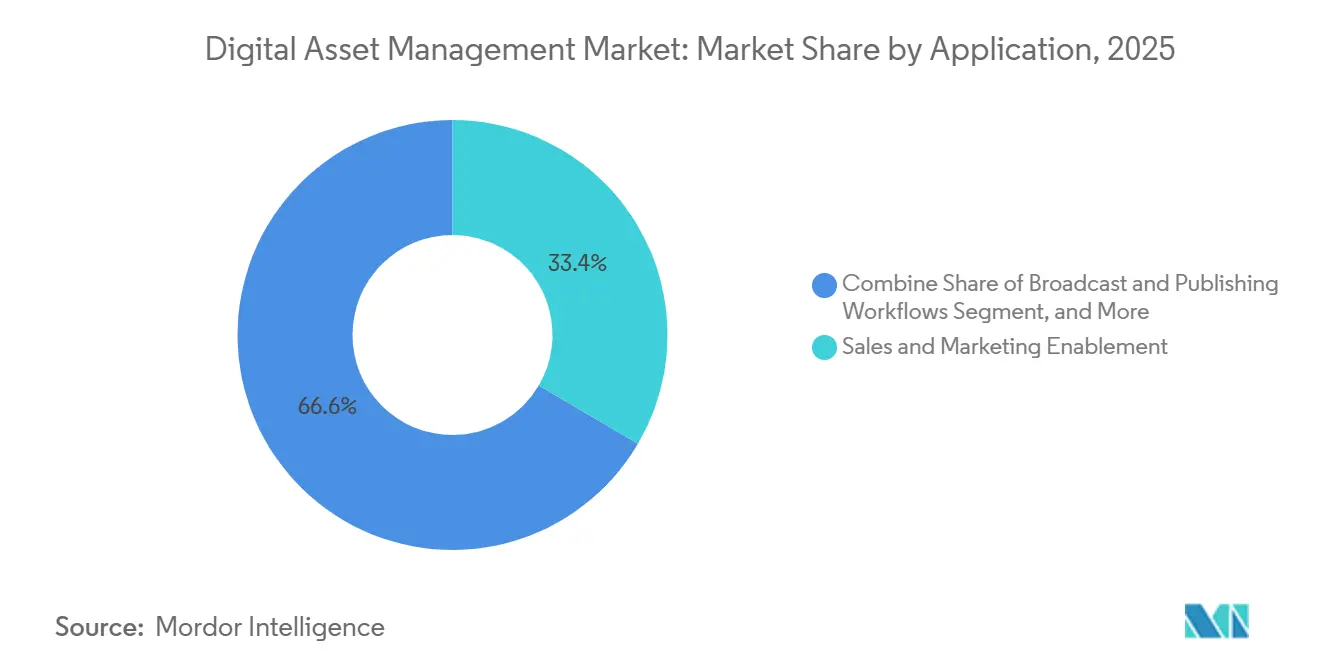
- By application, sales and marketing enablement commanded 33.43% revenue share in 2025; product and e-commerce management is projected to rise at a 14.89% CAGR through 2031.
- By end-user industry, media and entertainment held 32.12% share of the digital asset management market in 2025, while healthcare and life sciences are progressing at a 15.51% CAGR to 2031.
- By geography, North America accounted for a 36.27% share in 2025, whereas Asia-Pacific is set to grow at a 14.84% CAGR during 2026-2031.
Note: Market size and forecast figures in this report are generated using Mordor Intelligence’s proprietary estimation framework, updated with the latest available data and insights as of 2026.
Global Digital Asset Management Market Trends and Insights
Drivers Impact Analysis*
| Driver | (~) % Impact on CAGR Forecast | Geographic Relevance | Impact Timeline |
|---|---|---|---|
| Growing Volume And Velocity Of Rich Media Assets In Omnichannel Commerce | +2.8% | Global, Early In North America And Europe | Medium Term (2–4 Years) |
| Rapid Shift To Cloud-Native AI-Enhanced DAM Platforms In North America | +2.5% | Primarily North America, Spreading To Europe And APAC | Short Term (≤2 Years) |
| Surging Demand For Personalized Video Streaming Assets In Asia-Pacific | +2.2% | APAC Core, Notably China, India, Japan, South Korea | Medium Term (2–4 Years) |
| Integration Of DAM With Headless CMS For Real-Time Content Syndication | +1.9% | Global, Led By Digital-First Firms In North America And Europe | Short Term (≤2 Years) |
| Regulatory Push For Accessibility (WCAG 2.2) Elevating Metadata Standards In Europe | +1.6% | Europe, With Multinationals Adopting Globally | Long Term (≥4 Years) |
| Emergence Of Generative-AI-Powered Auto-Tagging Reducing Time-To-Market | +2.1% | Highest Adoption In North America And Europe | Short Term (≤2 Years) |
| Source: Mordor Intelligence | |||


Growing Volume and Velocity of Rich Media Assets in Omnichannel Commerce
Consumer packaged goods brands boosted digital ad spend, pushing asset counts into the millions and straining legacy libraries. Firms that coupled DAM with product information management cut duplicate asset creation by 30-50% and shortened campaign launch cycles by 26%.[1]MediaValet, “Healthcare Digital Asset Management,” mediavalet.com Centralized orchestration also unlocked USD 184,000 in annual savings from content reuse. Retailers that blend DAM and PIM now report 45% higher video-enabled sales because each SKU inherits rights-cleared imagery, localized text, and AI-generated variations on demand.[2] Cloudinary, “Intelligent Digital Asset Management,” cloudinary.com With Gartner estimating that 20% of e-commerce transactions will run through AI platforms by 2030, enterprises view DAM as the backbone of automated, hyper-personalized storefronts. This accelerates refresh cycles for incumbent on-premise systems that lack API-first delivery.
Rapid Shift to Cloud-Native AI-Enhanced DAM Platforms in North America
A Fortune 100 technology company migrated 1.8 million assets (50 terabytes) to SaaS, trimming total cost of ownership and yielding 25% productivity gains via automated product-to-asset association. Progress Software’s Automate MFT touts 50% lower costs versus on-premise transfer suites while meeting SOC 2 and HIPAA controls. Bynder surpassed one billion AI searches in September 2025, spotlighting soaring demand for semantic and multimodal discovery. Cloud vendors compete on embedded AI, open APIs, and compliance blueprints, with Forrester naming Aprimo and Orange Logic leaders in 2026. This cloud pivot is reinforced by the CFO's preference for OPEX models, driving the digital asset management market toward subscription revenue.
Surging Demand for Personalized Video Streaming Assets in Asia-Pacific
APAC enterprises outpace North America in AI budget growth (26% vs 19%), and 33% of CEOs personally steer AI initiatives.[3]Dhruv Dhumatkar, “How APAC’s Data Infrastructure Will Mature in 2026,” DigiconAsia, digiconasia.net India’s data-center footprint is scaling at a 16% CAGR, exemplified by Yotta’s USD 2 billion Nvidia Blackwell cluster, slated for an August 2026 launch. Regional hyperscale capacity empowers real-time transcoding, captioning, and moderation workflows critical to personalized streams. UPC Volt’s 100-megawatt facility in Hyderabad and ESR’s Navi Mumbai campus further expand low-latency infrastructure, aligning with the Allianz Risk Barometer that flags AI among the top two business risks in the region. As brands race to tailor video snippets per viewer, DAM platforms equipped with GPU-accelerated encoding and automated rights governance gain strategic priority.
Integration of DAM with Headless CMS for Real-Time Content Syndication
Cloudinary’s November 2025 tie-up with Contentful lets marketers edit video, request AI search, and publish without leaving the CMS interface. Acquia’s DAM API added webhooks and instant search connectors, enabling event-driven asset pushes to any headless front end. Yet Adobe’s Middle East survey shows that just 57% of large enterprises have fully implemented API architectures, despite 61% claiming mature cloud stacks. Wedia’s native Content Picker inside Adobe Creative Cloud and Microsoft 365 demonstrates how dynamic linking eliminates version errors and ensures master-asset updates propagate universally. Together, these advances transform DAM from a system of record into a system of action optimized for real-time commerce.
Restraints Impact Analysis*
| Restraint | (~) % Impact on CAGR Forecast | Geographic Relevance | Impact Timeline |
|---|---|---|---|
| High Total Cost Of Ownership For Enterprise-Grade DAM Suites In SMEs | -1.8% | Global, Acute In South America, Africa, Southeast Asia | Medium Term (2–4 Years) |
| Data-Sovereignty And Residency Mandates Limiting Cross-Border Asset Storage | -2.1% | Europe First, Spreading To India, UAE, China, Nigeria | Long Term (≥4 Years) |
| Fragmented Legacy Repositories Hindering Seamless Migration | -1.5% | North America And Europe | Medium Term (2–4 Years) |
| Limited Skilled Workforce For AI-Based Metadata Governance | -1.2% | Global, Highest In Emerging Markets | Long Term (≥4 Years) |
| Source: Mordor Intelligence | |||
High Total Cost of Ownership for Enterprise-Grade DAM Suites in SMEs
Failed projects average USD 2.5 million over three years, with 67% abandonment inside 18 months due to poor governance rather than software flaws. Entry-level SaaS such as LightRocket (from USD 350 per month) or ResourceSpace’s Team Cloud tier eases licensing outlay, yet often omits AI metadata, multi-region residency, and advanced automation. Activo warns buyers to allocate 15-25% of total spend to governance, staffing a DAM manager (USD 85,000-120,000) plus stewards, costs that can rival the platform itself. Without this investment, metadata chaos erodes ROI, especially for small firms lacking change-management muscle.
Data-Sovereignty and Residency Mandates Limiting Cross-Border Asset Storage
The EU Digital Operational Resilience Act, Data Act, and Cloud Sovereignty Framework demand localized processing, forcing DAM vendors to deploy EU-only clusters and pursue SEAL certification.[4]European Commission, “Digital Strategy,” digital-strategy.ec.europa.eu Microsoft conceded it cannot fully shield EU data from U.S. CLOUD Act exposure, heightening client pressure for European hosting. Outside Europe, India’s Digital Personal Data Protection Act, China’s PIPL, and Nigeria’s 2023 laws create a patchwork of residency rules documented by DLA Piper. These mandates inflate infrastructure costs, delay global rollouts, and complicate the expansion of the digital asset management market.
*Our forecasts treat driver/restraint impacts as directional, not additive. The impact forecasts reflect baseline growth, mix effects, and variable interactions.
Segment Analysis
By Component: Services Gain Traction amid Governance Complexity
Solutions accounted for 66.26% of the digital asset management market share in 2025, driven by investments in AI tagging engines, rights modules, and workflow orchestrators. However, services revenue is forecast to outpace the overall digital asset management market size at a 14.33% CAGR through 2031 as enterprises confront tangled metadata and legacy sprawl. Large migrations, such as Infogain’s 1.8 million-asset project, reveal that cleaning, mapping, and stewarding metadata often dwarfs software configuration workloads. Organizations that earmark 15-25% of program budgets for governance achieve 40% faster go-lives and 60% higher user adoption, driving recurring demand for implementation, change management, and managed metadata contracts.
Further, vendors increasingly bundle AI model tuning and continuous workflow optimization into subscription tiers, blurring the lines between software and services. Clients lean on partners to train vision models on brand-specific iconography and to recalibrate taxonomies that reflect new product launches. As DAM moves from system-of-record to system-of-action, professional services become the grease that keeps governance, compliance, and user satisfaction aligned with business outcomes.

By Deployment Mode: Cloud Rises despite On-Premise Entrenchment
On-prem deployments accounted for 59.76% of the digital asset management market in 2025, as heavily regulated industries still favor in-house infrastructure. Yet cloud instances are projected to grow 14.29% annually through 2031, driven by lower upfront costs, elastic scaling, and built-in AI add-ons. SaaS suites such as Progress Software’s Automate MFT advertise 50% lower ownership cost than self-hosted stacks, while meeting SOC 2 and HIPAA benchmarks. Enterprises migrating to API-first clouds report faster UI response times, simpler upgrades, and modular integration options that shorten development queues.
Data-sovereignty rules do sustain hybrid patterns. European banks, for example, keep master files on local servers to satisfy DORA, yet burst derivatives and renditions to regional clouds for delivery. In Asia-Pacific, hyperscale investments from Yotta, UPC Volt, and ESR create local anchors that let brands comply with data-localization guidance while tapping GPU-rich processing for generative video. Over time, multitenant clouds with optional sovereign partitions appear poised to absorb the bulk of new workloads, even as mission-critical archives linger on-premise.
By Organization Size: SMEs Accelerate on Consumption Pricing
Large enterprises held 62.98% share in 2025 by virtue of capital muscle and in-house stewards, but Small and Medium Enterprises (SMEs) represent the digital asset management market’s fastest-growing cohort at 14.01% CAGR. Flexible pricing from ResourceSpace and LightRocket, along with no-code automation builders from Cloudinary, allow smaller firms to spin up DAM without scripting knowledge or six-figure consultants. Still, staffing costs remain a hurdle: Activo pegs the minimum governance team at one full-time DAM manager plus several part-time curators, an expense many SMEs offset by outsourcing to managed-service partners.
Successful mid-market rollouts emphasize guard-railed templates that lock brand elements while empowering local edits, thereby maintaining consistency without adding headcount. Meanwhile, large organizations continue to pursue continent-scale deployments that blend regional asset councils and custom AI models to classify products in 190-plus countries, ensuring they retain spending dominance even as growth tilts to the long-tail customer base.
By Application: E-Commerce Management Outpaces Traditional Campaign Workflows
Sales and marketing enablement accounted for 33.43% of 2025 revenue, yet product and e-commerce management is forecast to outgrow every other use case at a 14.89% CAGR. The rise of atomic content, one master spawning locale-, channel-, and SKU-specific renditions, has tightened the bond between DAM and PIM. Retailers integrating both systems achieve 90% faster image delivery to digital storefronts and a 45% bump in video-driven sales. The digital asset management market for e-commerce also benefits from AI engines that automatically score images for compliance with marketplace guidelines, slashing listing rejections.
Traditional broadcast and publishing workflows still demand versioned transcodes, caption syncing, and archive retrieval, keeping media houses as anchor clients. Yet even broadcasters are re-skinning content for direct-to-consumer apps that mirror e-commerce personalization tactics, further bleeding the lines between campaign enablement and transactional content services.

By End-User Industry: Healthcare and Life Sciences Emerge as Fastest Mover
Media and entertainment retained a 32.12% share in 2025, leveraging DAM for massive video libraries, episodic versioning, and rights windows. Healthcare and life sciences, though, will chart a 15.51% CAGR to 2031, propelled by HIPAA-compliant platforms that centralize patient education videos, physician training modules, and fundraising creative. MediaValet notes all its healthcare clients reached ROI within one year, underscoring pent-up demand for regulated, multi-site asset hubs.
BFSI adoption climbs amid tightening KYC and disclosure mandates, while retail and CPG brands expand digital shelves that must localize promotions on the fly. Manufacturing, government, education, and IT each inject niche requirements, from 3-D CAD storage to multilevel security clearance, that spur specialized metadata schemas. Collectively, these verticals diversify revenue and reduce reliance on media majors, cushioning vendors against entertainment spending cycles.
Geography Analysis
North America, with 36.27% of 2025 revenue, benefits from early SaaS adoption and deep budgets for AI-assisted content pipelines. Enterprises there lead in semantic search rollouts and integrate DAM with broader marketing clouds, reinforcing the region’s incumbency but also intensifying vendor jockeying. Europe follows closely, though its trajectory is shaped by WCAG 2.2, DORA, and nascent SEAL cloud-sovereignty certifications that raise compliance spend yet spur demand for automated rights expiry and residency controls. Microsoft’s 2025 admission on CLOUD Act exposure accelerated a shift toward EU-hosted clouds, prompting providers to launch Frankfurt, Paris, and Warsaw regions dedicated to content-heavy workloads.
Asia-Pacific is the digital asset management market’s growth engine, projected at 14.84% CAGR through 2031. Government AI strategies in China, India, and Japan are unlocking public grants for local GPU clusters, converting infrastructural tailwinds into enterprise DAM budgets. India’s 580,000-square-meter data-center pipeline and Yotta’s USD 2 billion GPU spend highlight the scale of investment steering workloads into the region. APAC firms’ willingness to escalate AI budgets faster than global peers underscores demand for DAM platforms that embed generative diffusion models, video QC, and multilingual taxonomy support out of the box.
South America is carving a regional hub anchored by Brazil, which holds roughly 41% of the continent’s installed IT capacity. TikTok Pecém’s BZR 50 billion (USD 9.62 billion) complex and Rio IA City’s staged BZR 50 billion (USD 9.62 billion) expansion point to a growing addressable base, though the March 2026 lapse of the Redata incentive cut annual investment forecasts sharply. Hybrid on-shore / off-shore hosting patterns therefore remain likely as vendors weigh latency against cost.
The Middle East and Africa show uneven but promising uptake. Gulf enterprises, rich in mature cloud stacks, seek API-ready DAM to bridge multilingual, culturally tuned content, whereas parts of Africa lean on mobile-first strategies as bandwidth expands. Government digitization programs and sovereign-cloud mandates should incrementally lift spending, but skills shortages and connectivity gaps will modulate pacing.

Competitive Landscape
Concentration in the digital asset management market moderates as cloud-native specialists erode incumbent share. Adobe, OpenText, Oracle, Bynder, and Aprimo hold leadership through end-to-end suites and vast integration catalogs. Adobe’s USD 1.9 billion Semrush deal pairs DAM with content intelligence, allowing marketers to link asset tags to search rank, a differentiator none of its peers yet match. Getty Images and Shutterstock’s USD 3.7 billion merger condensed stock workflows, incentivizing DAM providers to pre-bake rights reconciliations that shield against expired licenses.
Open-source momentum, led by Hyland’s August 2025 release of its Cloud Content Repository, offers enterprises escape from lock-in while fanning an ecosystem of plug-ins. Canto’s XI release merges its 2023-24 acquisitions into a generative-AI-driven interface, illustrating how mid-tier vendors leapfrog feature sets. Cloudinary, rated Visionary by Gartner, courts developers with 25-plus SDKs and usage-based billing that scales down as readily as up, attracting SaaS-first brands.
White-space remains around AI metadata with human-in-loop validation, headless CMS orchestration, and phased migration aid. Vendors addressing governance fatigue, 73% of projects falter after 18 months, by bundling stewardship tooling and ROI dashboards will capture latent demand. Overall, the top five suppliers jointly hold between 55-65% share.
Digital Asset Management Industry Leaders
Adobe Inc.
Canto Inc.
CELUM GmbH
Oracle Corporation
IBM Corp.
- *Disclaimer: Major Players sorted in no particular order

Recent Industry Developments
- February 2026: Yotta Data Services committed USD 2 billion to an Nvidia Blackwell GPU cluster in Noida, India, slated for Aug 2026 deployment.
- February 2026: Hyland broadened its Content Innovation Cloud, citing a 220% year-over-year jump in agentic workflow adoption during Q4 2025.
- February 2026: ESR invested Rs 900 crore (USD 108 million) to build a multi-level AI-ready campus in Navi Mumbai.
- January 2026: Wedia released a paper positioning DAM as the creative backbone of the generative AI era.


Global Digital Asset Management Market Report Scope
The Digital Asset Management Market Report is Segmented by Component (Solutions, Services), Deployment Mode (On-Premise, Cloud), Organisation Size (SMEs, Large Enterprises), Application (Sales and Marketing Enablement, Broadcast and Publishing Workflows, Product and E-Commerce Management, Photography, Graphics and Design Repositories, Document and Knowledge Management), End-User Industry (Media and Entertainment, BFSI, Government and Public Sector, Healthcare and Life Sciences, Retail and CPG, Manufacturing, IT and Telecom, Rest of End-User Industry), and Geography (North America, South America, Europe, Asia-Pacific, Middle East, Africa). The Market Forecasts are Provided in Terms of Value (USD).
| Solutions |
| Services |
| On-Premise |
| Cloud (SaaS) |
| Small and Medium Enterprises (SMEs) |
| Large Enterprises |
| Sales and Marketing Enablement |
| Broadcast and Publishing Workflows |
| Product and E-Commerce Management |
| Photography, Graphics and Design Repositories |
| Document and Knowledge Management |
| Media and Entertainment |
| BFSI |
| Government and Public Sector |
| Healthcare and Life Sciences |
| Retail and CPG |
| Manufacturing |
| IT and Telecom |
| Rest of End-User Industry |
| North America | United States |
| Canada | |
| Mexico | |
| South America | Brazil |
| Argentina | |
| Rest of South America | |
| Europe | United Kingdom |
| Germany | |
| France | |
| Spain | |
| Italy | |
| Rest of Europe | |
| Asia-Pacific | China |
| India | |
| Japan | |
| Australia | |
| South Korea | |
| Rest of Asia-Pacific | |
| Middle East | Saudi Arabia |
| United Arab Emirates | |
| Turkey | |
| Rest of Middle East | |
| Africa | South Africa |
| Kenya | |
| Rest of Africa |
| By Component | Solutions | |
| Services | ||
| By Deployment Mode | On-Premise | |
| Cloud (SaaS) | ||
| By Organisation Size | Small and Medium Enterprises (SMEs) | |
| Large Enterprises | ||
| By Application | Sales and Marketing Enablement | |
| Broadcast and Publishing Workflows | ||
| Product and E-Commerce Management | ||
| Photography, Graphics and Design Repositories | ||
| Document and Knowledge Management | ||
| By End-User Industry | Media and Entertainment | |
| BFSI | ||
| Government and Public Sector | ||
| Healthcare and Life Sciences | ||
| Retail and CPG | ||
| Manufacturing | ||
| IT and Telecom | ||
| Rest of End-User Industry | ||
| By Geography | North America | United States |
| Canada | ||
| Mexico | ||
| South America | Brazil | |
| Argentina | ||
| Rest of South America | ||
| Europe | United Kingdom | |
| Germany | ||
| France | ||
| Spain | ||
| Italy | ||
| Rest of Europe | ||
| Asia-Pacific | China | |
| India | ||
| Japan | ||
| Australia | ||
| South Korea | ||
| Rest of Asia-Pacific | ||
| Middle East | Saudi Arabia | |
| United Arab Emirates | ||
| Turkey | ||
| Rest of Middle East | ||
| Africa | South Africa | |
| Kenya | ||
| Rest of Africa | ||


Key Questions Answered in the Report
What is the projected value of the digital asset management market by 2031?
The market is expected to reach USD 14.42 billion by 2031.
Which deployment model is growing fastest?
Cloud-based deployments are forecast to rise at a 14.29% CAGR between 2026 and 2031.
Which application segment shows the highest growth?
Product and e-commerce management is advancing at a 14.89% CAGR through 2031.
Why are services revenue rising faster than software in DAM?
Enterprises need implementation, metadata migration, and governance expertise, driving services at a 14.33% CAGR.
Which region offers the strongest growth outlook for DAM?
Asia-Pacific leads with a projected 14.84% CAGR to 2031, backed by sovereign AI initiatives and hyperscale data-center builds.
What is the primary barrier for SMEs adopting DAM?
High total cost of ownership, including governance staffing, remains the chief obstacle.
Page last updated on:


