Asset Optimization Solutions Market Size and Share
Market Overview
| Study Period | 2020 - 2031 |
|---|---|
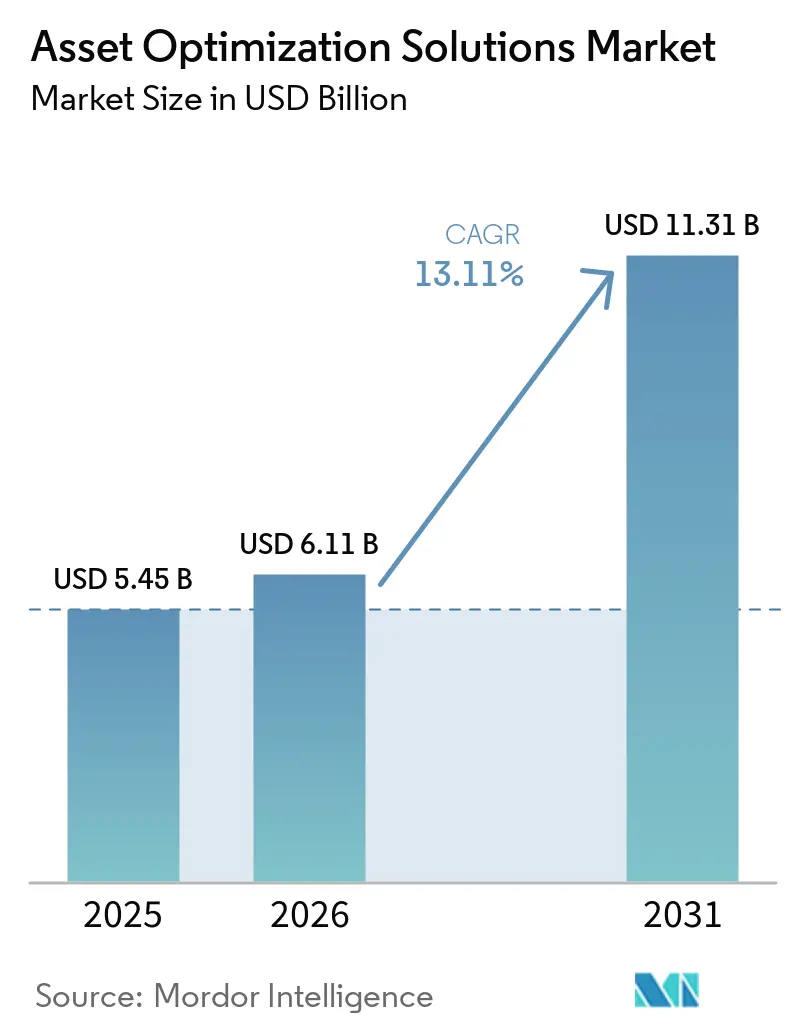
| Market Size (2026) | USD 6.11 Billion |
| Market Size (2031) | USD 11.31 Billion |
| Growth Rate (2026 - 2031) | 13.11% CAGR |
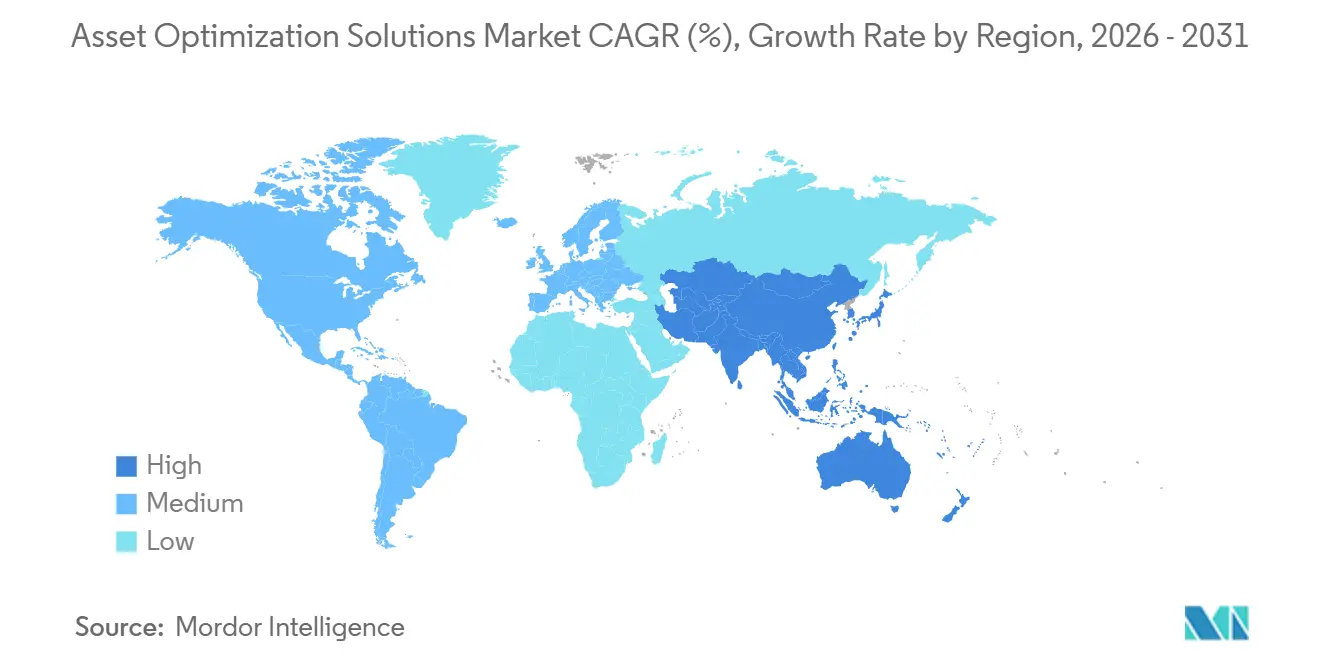
| Fastest Growing Market | Asia Pacific |
| Largest Market | North America |
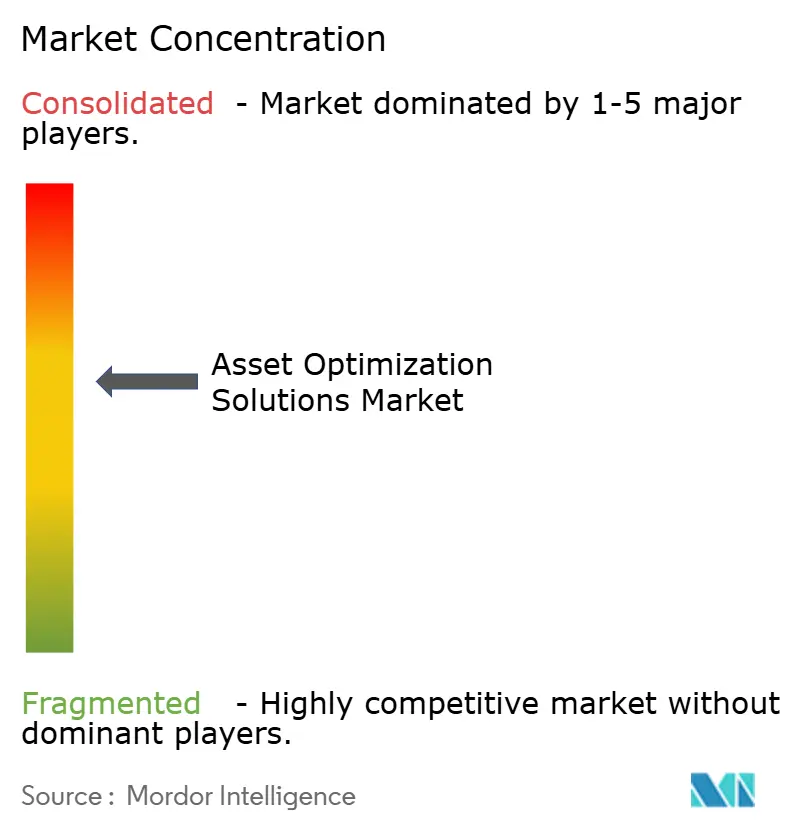
| Market Concentration | Medium |
Major Players *Disclaimer: Major Players sorted in no particular order Image © Mordor Intelligence. Reuse requires attribution under CC BY 4.0. | |
Asset Optimization Solutions Market Analysis by Mordor Intelligence
The asset optimization solutions market size was valued at USD 5.45 billion in 2025, USD 6.11 billion in 2026, and is expected to reach USD 11.31 billion by 2031, at a CAGR of 13.11% during the forecast period (2026-2031). Industrial operators now treat asset performance management as a competitive lever, not a back-office chore, because digital twins, edge analytics, and carbon-accounting rules steer capital toward equipment that runs longer and cleaner. Software still generates most revenue, yet outsourcing‐friendly services are scaling faster as enterprises struggle to find data-science talent. Hybrid deployment designs reconcile on-premise control mandates with cloud-grade computing, while vertical uptake widens beyond oil and gas into healthcare, transportation, and discrete manufacturing. Regionally, North America remains the spending anchor, but Asia-Pacific is closing the gap on the back of government-backed modernization programs and greenfield investments.
Key Report Takeaways
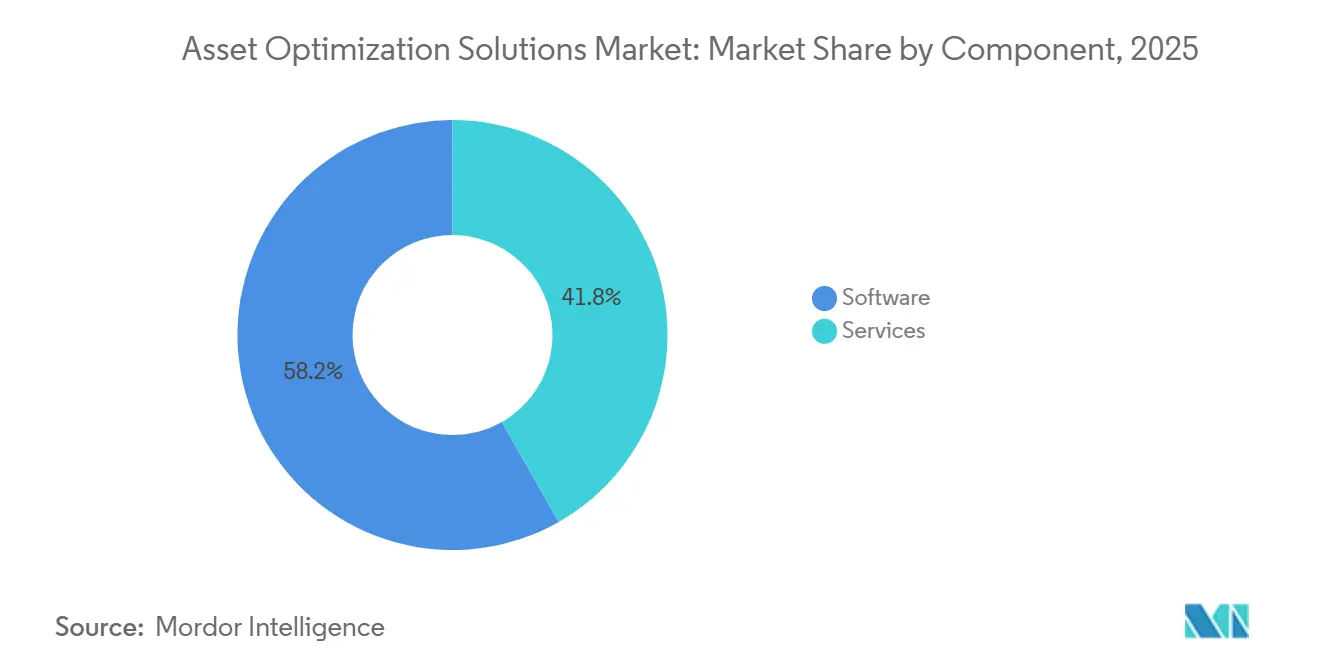
- By component, services are expanding at a 14.91% CAGR through 2031, while software retained 58.23% revenue share in 2025.
- By deployment mode, the hybrid deployment mode is projected to advance at 14.23% CAGR through 2031, whereas cloud held 48.34% of the 2025 asset optimization solutions market share.
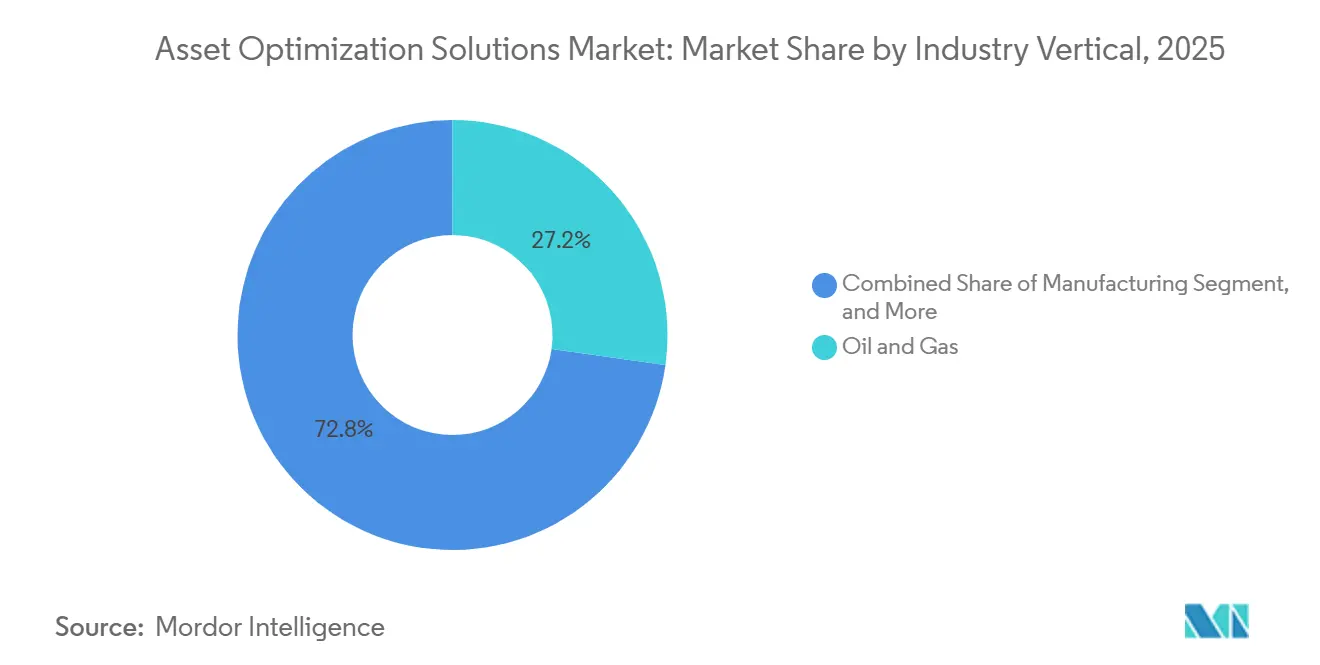
- By industry vertical, oil and gas commanded 27.23% of 2025 spending, but healthcare is projected to advance at 13.91% CAGR to 2031.
- By enterprise size, large enterprises captured 67.76% of 2025 revenue, yet small and medium-sized enterprises are progressing at 14.52% CAGR thanks to SaaS pricing.
- By geography, North America led with 33.64% of global sales in 2025, while Asia-Pacific is the fastest-growing region at 13.63% CAGR through 2031.
Note: Market size and forecast figures in this report are generated using Mordor Intelligence’s proprietary estimation framework, updated with the latest available data and insights as of January 2026.
Global Asset Optimization Solutions Market Trends and Insights
Drivers Impact Analysis*
| Driver | (~) % Impact on CAGR Forecast | Geographic Relevance | Impact Timeline |
|---|---|---|---|
| Rapid Digitalization of Industrial Operations | +3.2% | Global, especially North America, Europe, Asia-Pacific manufacturing hubs | Medium term (2-4 years) |
| Predictive Maintenance Focus to Reduce Unplanned Downtime | +2.8% | Global, led by oil and gas, power, and manufacturing | Short term (≤ 2 years) |
| Rise of Industrial Internet of Things Platforms | +2.4% | Asia-Pacific core with spill-over to Middle East and Africa | Medium term (2-4 years) |
| Integration of Physics-Based Twins with AI Analytics | +2.1% | North America and Europe, emerging in Asia-Pacific | Long term (≥ 4 years) |
| Carbon-Intensity KPIs Driving Asset Efficiency Programs | +1.6% | Europe, North America, expanding to Asia-Pacific | Long term (≥ 4 years) |
| Compliance with Stringent Safety-Regulatory Frameworks | +1.0% | Global, highest in North America and Europe | Medium term (2-4 years) |
| Source: Mordor Intelligence | |||
Rapid Digitalization of Industrial Operations
Brownfield assets averaging 25-30 years in age are being retrofitted with sensors, gateways, and cloud APIs at record speed. Germany’s Platform Industrie 4.0 pushed 12,000 plants to adopt digital twins by 2025, and France’s Industrie du Futur steered EUR 10 billion (USD 11.3 billion) into similar upgrades.[1]Plattform-Industrie 4.0, “Germany Industry 4.0 Initiative,” PLATTFORM-I40.DE Agile manufacturers that rode these programs cut changeover times by 40%, winning orders during the 2024 semiconductor crunch.[2]Siemens AG, “40% Changeover Time Reduction on Xcelerator,” SIEMENS.COM
Predictive Maintenance Focus to Reduce Unplanned Downtime
Cummins saved USD 18 million in 2025 by catching bearing wear early, while power plant operators stretched turbine runtime up to 15% with condition-based scheduling.[3]Cummins Inc., “North American Predictive Maintenance Savings 2025,” CUMMINS.COM Machine-learning models now predict failures 30-60 days ahead with near-90% accuracy, making sensor rollouts economically compelling. Logistics fleets mirror the trend; UPS carved out USD 400 million in fuel and maintenance savings that year.[4]United Parcel Service, “2025 Sustainability Report - Fleet Optimization,” UPS.COM
Rise of Industrial Internet of Things Platforms
China mandated IIoT interfaces on all new industrial equipment above 100 kW from 2025, wiring 300,000 factories and generating 2.5 exabytes of data annually. Saudi Aramco’s 50,000-sensor rollout at Ghawar optimized injection pressure and extended field life by as much as seven years. Local edge analytics shrink response times, giving leaders a distinct throughput and reliability edge.
Integration of Physics-Based Twins with AI Analytics
Siemens’ Digital Twin Composer, unveiled in 2026, marries thermodynamic models with generative AI to stress-test equipment virtually and cut simulation cycles by 60%. BASF’s physics-informed neural nets added 3% yield at its Ludwigshafen chemicals hub in 2025, equal to EUR 45 million (USD 50.9 million) in margin. The ability to extrapolate outside historical ranges is now a must-have for process-intensive sectors.
Restraints Impact Analysis*
| Restraint | (~) % Impact on CAGR Forecast | Geographic Relevance | Impact Timeline |
|---|---|---|---|
| High Upfront Capital Expenditure | -1.8% | Global, strongest in South America, Africa, and SMEs | Short term (≤ 2 years) |
| Cyber-Security Vulnerabilities in Connected Assets | -1.4% | Global, critical in North America and Europe | Medium term (2-4 years) |
| Shortage of In-House Data-Science Talent | -1.1% | Global, severe in Asia-Pacific and emerging markets | Long term (≥ 4 years) |
| Fragmented Brownfield Data Silos In Legacy Plants | -0.9% | North America and Europe aging assets | Medium term (2-4 years) |
| Source: Mordor Intelligence | |||
High Upfront Capital Expenditure
Full-scale programs, costing between USD 2-15 million, extend paybacks to 3-5 years, deterring mid-market adopters. In 2025, Petrobras shelved a planned USD 200 million upgrade, citing borrowing costs exceeding 12%. While SaaS models alleviate financial strain, they hinge on dependable bandwidth, a challenge for both remote mines and offshore rigs. Additionally, the high upfront investment and operational complexities further limit adoption among smaller players. Companies are exploring hybrid models to balance costs and infrastructure challenges.
Cyber-Security Vulnerabilities in Connected Assets
CISA logged 1,087 industrial-control vulnerabilities in 2024, up 22% year on year. Dragos found ransomware downtime averages 11 days at USD 8.3 million per incident. Buyers now demand zero-trust segmentation, adding 15-20% to project budgets and lengthening proofs of concept. This underscores the increasing complexity of cybersecurity challenges faced by industries globally.
*Our forecasts treat driver/restraint impacts as directional, not additive. The impact forecasts reflect baseline growth, mix effects, and variable interactions.
Segment Analysis
By Component: Services Outpace Software as Complexity Mounts
Services revenue in the asset optimization solutions market grew 14.91% annually through 2031 as firms tackled integration and data-science gaps. IBM Maximo’s ninth release still needs 6-12 months of expert configuration, reinforcing demand for consulting and managed services. Vendors pivot toward outcome-based contracts, with AspenTech deriving 40% of turnover from services that include uptime guarantees. The asset optimization solutions market size for services is forecast to widen its lead as labor shortages persist.
Software, while slower, remains indispensable. Platform refreshes bundle AI toolkits and low-code dashboards, but customers lacking governance discipline risk data sprawl. Continuous updates also pressure internal teams to keep skills current, driving renewed outsourcing cycles and reinforcing the services growth flywheel. The increasing reliance on automation and AI-driven tools is also prompting organizations to reassess their digital transformation strategies to remain competitive.


By Deployment Mode: Hybrid Blends Control with Scale
Cloud hosted 48.34% of 2025 spending, primarily for compute-intensive model training, but regulated sectors insist that safety-critical control loops stay local. Schneider Electric’s EcoStruxure places edge controllers on-site while forwarding anonymized data to Azure for fleet analytics, cutting egress costs 70-80%. Hybrid thus delivers the lowest total cost of ownership without compromising sovereignty under China’s Data Security Law.
Operators also value business continuity. During the 2025 internet disruptions, plants running hybrid architectures sustained production using local AI caches. As a result, the asset optimization solutions market size tied to hybrid deployments is projected to post the fastest CAGR to 2031, eclipsing pure cloud additions in manufacturing, utilities, and pharmaceuticals.
By Industry Vertical: Healthcare Emerges as Fastest Riser
Oil and gas retained 27.23% of 2025 outlays, justified by the USD 5 million-per-day hit from offshore downtime. Shell’s North Sea digital twin cut non-productive time 18%. Yet hospitals now chase similar economics; GE HealthCare’s AI maintenance suite sliced magnetic-resonance scanner outages 30% in 2025. Under value-based care, missed imaging slots trigger reimbursement penalties, turning uptime into revenue protection.
Transportation and mining follow closely, while food processors deploy scheduling optimizers to curb sanitation-driven production lulls. The asset optimization solutions market share captured by healthcare is set to swell as diagnostic equipment fleets grow and reimbursement models toughen. Additionally, the rising focus on operational efficiency and cost reduction is further propelling the adoption of these solutions across industries.

By Enterprise Size: SMEs Close the Digital Gap
Large enterprises still command a majority 67.76% share, leveraging economies of scale to fund multi-site rollouts. However, SaaS pricing unlocked the asset optimization solutions industry for firms below 500 employees. IFS won 400 such customers in 2025 on pay-per-asset tiers. Deployment times now average 8-12 weeks, compressing cash cycles and validating investment faster.
As predictive workflows take over manual rounds, SMEs are becoming leaner and more agile. This demographic is set to grow at a rate exceeding 14% CAGR, prompting vendors to increasingly pivot their product roadmaps towards user-friendly mobile apps and standardized analytics packages. The adoption of these technologies is expected to enhance operational efficiency and drive competitive differentiation for SMEs in the forecast period.
Geography Analysis
North America generated 33.64% of global revenue in 2025 and should advance near 12.8% CAGR to 2031. U.S. EPA risk-management rules and OSHA process-safety mandates compel chemical and refinery operators to implement continuous condition monitoring. Canada’s oil-sands producers, such as Suncor, trimmed steam ratios 7% using optimization, lowering carbon intensity and fuel bills. Mexico’s export-oriented plants integrate predictive maintenance to hit 99.5% on-time delivery commitments for automakers.
Asia-Pacific is the fastest climber at 13.63% CAGR. China’s 14th Five-Year Plan steers USD 1.4 trillion into smart factories, targeting 70% digitalization of large industrial firms by 2027. India’s USD 1.5 trillion National Infrastructure Pipeline embeds asset-management specs into procurement, ensuring new ports and power plants launch with analytics baked in. Japan’s Society 5.0 fuses cyber-physical tech with human-robot collaboration, while ASEAN nations replicate global best practices in fresh plants, bypassing legacy constraints.
Europe captured 24.1% of 2025 turnover and should rise at a roughly 12.5% CAGR. Platform Industrie 4.0’s interoperability guides cut deployment costs up to 25%. The United Kingdom’s GBP 1 billion (USD 1.27 billion) Industrial Decarbonization Strategy funds energy-intensive sectors adopting optimization. France’s aging nuclear fleet relies on predictive analytics to justify license extensions, deferring USD 80 billion in capex. Middle East and Africa, led by Saudi Vision 2030, build optimization into mining and petrochemical capacity, while South America pilots remain cautious amid currency swings.

Competitive Landscape
Roughly 55-60% of 2025 revenue sat with the top ten vendors, indicating moderate concentration. Automation heavyweights, Siemens, ABB, Schneider Electric, Honeywell, and Rockwell Automation, cross-sell optimization apps into their installed control bases, creating high switching costs. Siemens’ USD 10.6 billion Altair purchase formed an end-to-end digital-twin suite spanning design through decommissioning. Enterprise IT players, SAP, Oracle, and IBM, embed analytics at the ERP layer, smoothing cultural adoption among procurement and maintenance teams.
White-space persists in mid-market niches where incumbents over-serve. Uptake Technologies packages industry-specific libraries that deploy in under 90 days, appealing to manufacturers with limited IT staff. Standards participation is turning into a moat, with vendors shaping IEEE and IEC protocols to favor their data models. Patent filings around reinforcement learning and federated training rose 18% in 2025, emphasizing the race to automate data-science tasks.
Investors are increasingly channeling capital into cyber-secure architectures and no-code configurations. They are particularly drawn to platforms that meld anomaly detection with optimization. This dual focus not only tackles primary industry challenges but also enhances appeal to buyers prioritizing compliance. Additionally, the integration of these features helps businesses streamline operations while mitigating potential risks associated with cyber threats.
Asset Optimization Solutions Industry Leaders
International Business Machines Corporation
General Electric Company
Siemens AG
ABB Ltd.
Schneider Electric SE
- *Disclaimer: Major Players sorted in no particular order

Recent Industry Developments
- January 2026: Siemens launched Digital Twin Composer, cutting simulation cycles by 60% and enabling real-time schedule optimization.
- December 2025: ABB acquired Sevensense Robotics to add autonomous inspection capabilities that lower human exposure in hazardous zones.
- November 2025: Schneider Electric embedded Azure OpenAI services into EcoStruxure Asset Advisor, shrinking anomaly diagnosis from hours to minutes.
- October 2025: Honeywell released Forge Enterprise Performance Management, merging asset, energy, and emissions dashboards under one ISO 50001-certified suite.


Global Asset Optimization Solutions Market Report Scope
The Global Asset Optimization Solutions Market Report is Segmented by Component (Software, Services), Deployment Mode (On-Premise, Cloud, Hybrid), Industry Vertical (Oil and Gas, Energy and Utilities, Manufacturing, Transportation and Logistics, Healthcare, Other Industry Verticals), Enterprise Size (Large Enterprises, Small and Medium-Sized Enterprises), and Geography (North America, South America, Europe, Asia-Pacific, Middle East and Africa). The Market Forecasts are Provided in Terms of Value (USD).
| Software |
| Services |
| On-Premise |
| Cloud |
| Hybrid |
| Oil and Gas |
| Energy and Utilities |
| Manufacturing |
| Transportation and Logistics |
| Healthcare |
| Other Industry Verticals |
| Large Enterprises |
| Small and Medium-Sized Enterprises (SMEs) |
| North America | United States | |
| Canada | ||
| Mexico | ||
| South America | Brazil | |
| Argentina | ||
| Rest of South America | ||
| Europe | Germany | |
| United Kingdom | ||
| France | ||
| Italy | ||
| Spain | ||
| Rest of Europe | ||
| Asia-Pacific | China | |
| Japan | ||
| India | ||
| South Korea | ||
| ASEAN | ||
| Rest of Asia-Pacific | ||
| Middle East and Africa | Middle East | Saudi Arabia |
| United Arab Emirates | ||
| Turkey | ||
| Rest of the Middle East | ||
| Africa | South Africa | |
| Nigeria | ||
| Rest of Africa | ||
| By Component | Software | ||
| Services | |||
| By Deployment Mode | On-Premise | ||
| Cloud | |||
| Hybrid | |||
| By Industry Vertical | Oil and Gas | ||
| Energy and Utilities | |||
| Manufacturing | |||
| Transportation and Logistics | |||
| Healthcare | |||
| Other Industry Verticals | |||
| By Enterprise Size | Large Enterprises | ||
| Small and Medium-Sized Enterprises (SMEs) | |||
| By Geography | North America | United States | |
| Canada | |||
| Mexico | |||
| South America | Brazil | ||
| Argentina | |||
| Rest of South America | |||
| Europe | Germany | ||
| United Kingdom | |||
| France | |||
| Italy | |||
| Spain | |||
| Rest of Europe | |||
| Asia-Pacific | China | ||
| Japan | |||
| India | |||
| South Korea | |||
| ASEAN | |||
| Rest of Asia-Pacific | |||
| Middle East and Africa | Middle East | Saudi Arabia | |
| United Arab Emirates | |||
| Turkey | |||
| Rest of the Middle East | |||
| Africa | South Africa | ||
| Nigeria | |||
| Rest of Africa | |||


Key Questions Answered in the Report
How large is the asset optimization solutions market in 2026?
The asset optimization solutions market size stands at USD 6.11 billion in 2026 and is projected to reach USD 11.31 billion by 2031, expanding at 13.11% CAGR.
Which component category is growing fastest?
Services are the fastest-growing component, advancing at 14.91% CAGR as firms outsource integration, data-science, and managed-optimization tasks.
What drives healthcare adoption of asset optimization tools?
Value-based reimbursement penalizes imaging outages, so hospitals deploy predictive maintenance that has already cut scanner downtime 30% and is propelling a 13.91% CAGR for the healthcare segment.
Why are hybrid deployments preferred over pure cloud?
Hybrid architectures keep latency-sensitive controls on-site for safety while exporting anonymized data to the cloud for heavy analytics, reducing bandwidth costs up to 80% and satisfying data-sovereignty rules in regions like China.
Which region will contribute most to future growth?
Asia-Pacific is forecast to register the highest 13.63% CAGR to 2031, fueled by China’s USD 1.4 trillion smart-manufacturing drive and India’s USD 1.5 trillion infrastructure pipeline.
How are cyber-security risks influencing buying decisions?
Rising OT ransomware incidents push buyers to insist on zero-trust segmentation, adding 15-20% to deployment budgets but increasingly seen as essential to securing connected assets.
Page last updated on:


