IT Asset Management Market Size and Share
Market Overview
| Study Period | 2020 - 2031 |
|---|---|
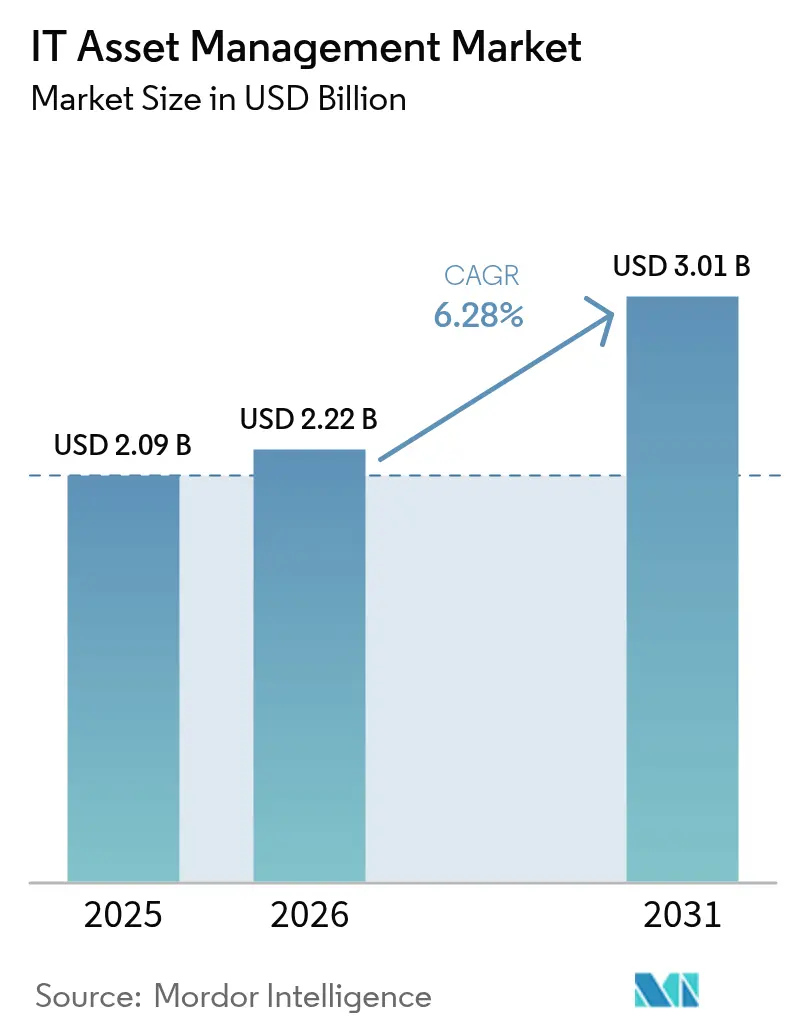
| Market Size (2026) | USD 2.22 Billion |
| Market Size (2031) | USD 3.01 Billion |
| Growth Rate (2026 - 2031) | 6.28% CAGR |
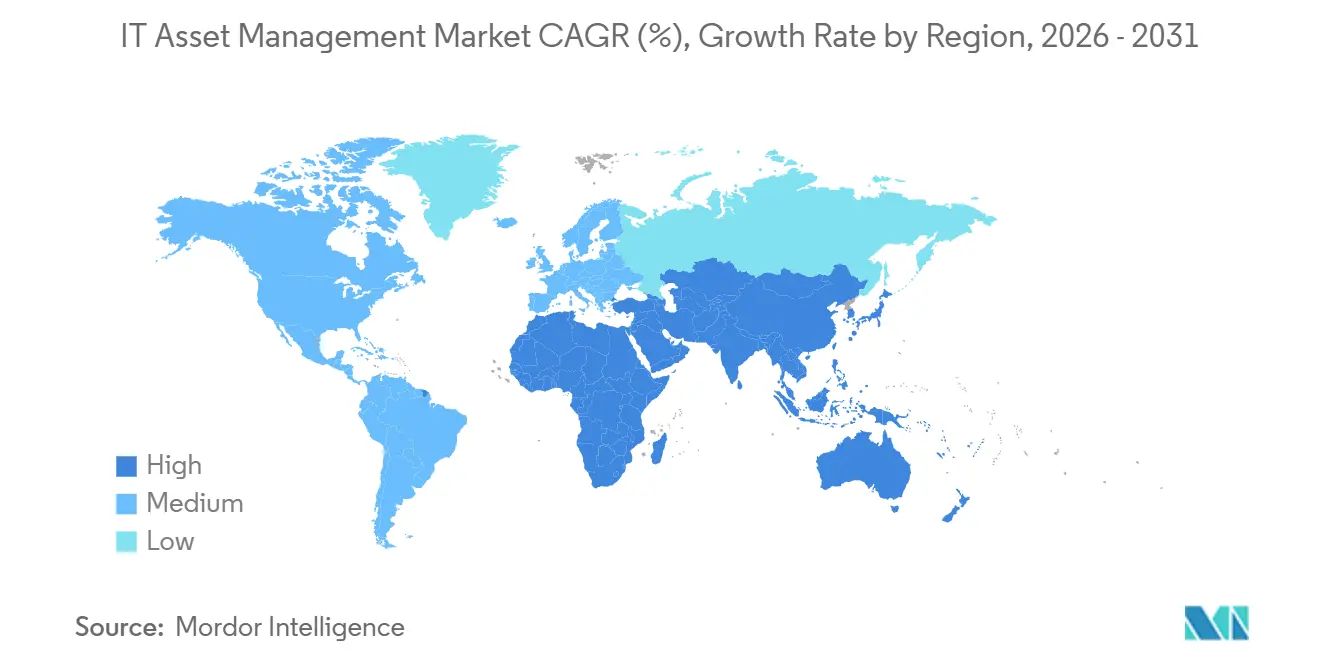
| Fastest Growing Market | Asia Pacific |
| Largest Market | North America |
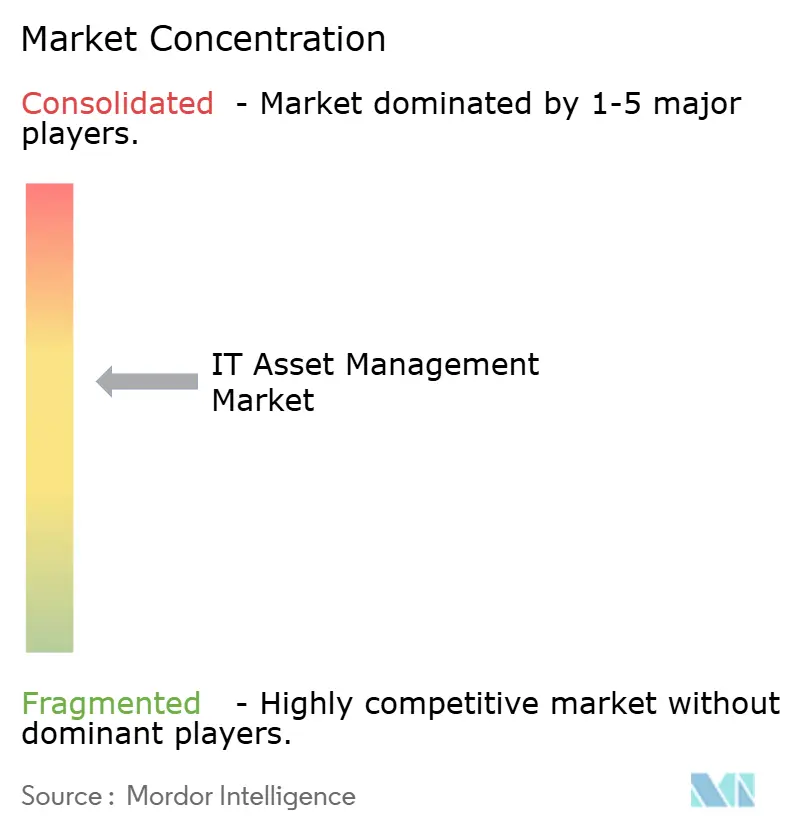
| Market Concentration | Medium |
Major Players *Disclaimer: Major Players sorted in no particular order Image © Mordor Intelligence. Reuse requires attribution under CC BY 4.0. | |
IT Asset Management Market Analysis by Mordor Intelligence
The IT Asset Management market size is expected to increase from USD 2.09 billion in 2025 to USD 2.22 billion in 2026 and reach USD 3.01 billion by 2031, growing at a CAGR of 6.28% over 2026-2031. Demand is shifting from periodic inventory sweeps toward continuous, AI-mediated discovery that captures ephemeral cloud workloads and edge endpoints, pushing platform providers to embed real-time telemetry pipelines. Regulatory mandates such as the EU Corporate Sustainability Reporting Directive and the Digital Operational Resilience Act are turning asset visibility into a board-level compliance requirement, accelerating adoption across financial services and healthcare. Spending is also migrating toward managed services as enterprises outsource licence-optimization analytics and audit-defense workflows they cannot staff internally. Competitive dynamics are intensifying because hyperscale vendors now bundle ITAM modules into observability and FinOps suites, compressing margins for standalone specialists while expanding total addressable demand for integrated governance platforms.
Key Report Takeaways
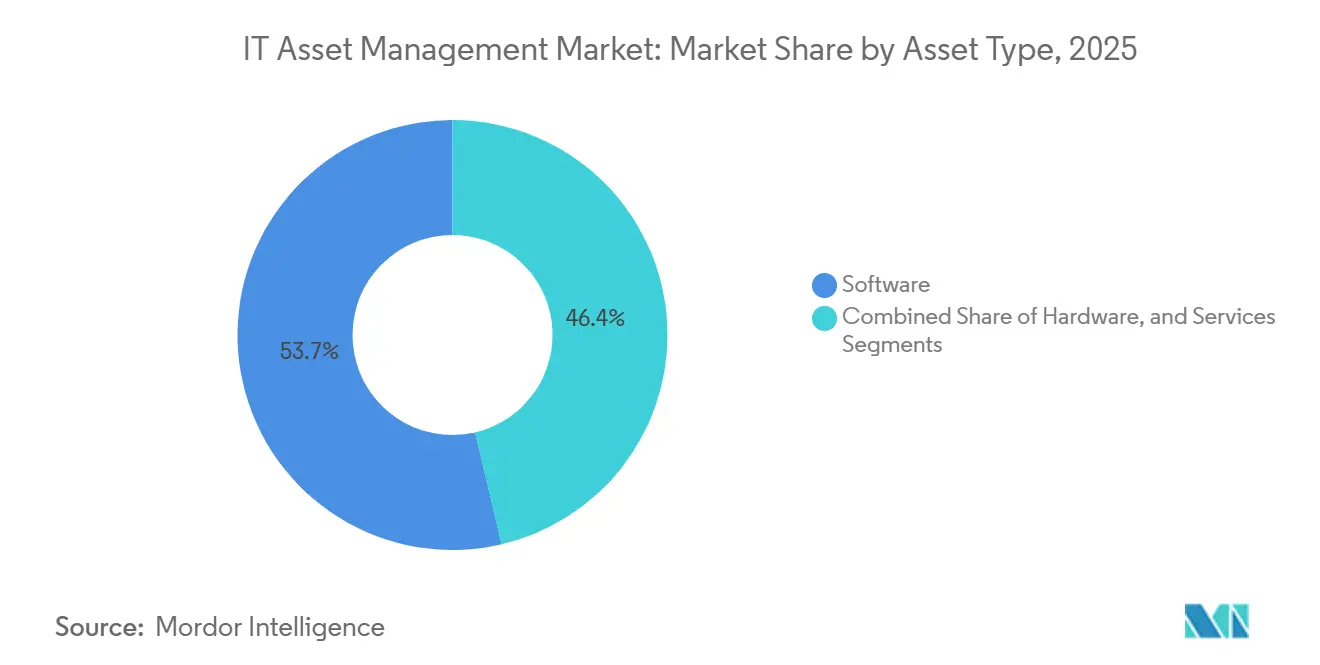
- By asset type, software assets captured 48.73% of the IT Asset Management market share in 2025; services are advancing at a 6.98% CAGR through 2031.
- By deployment model, cloud platforms held 63.12% share of the IT Asset Management market size in 2025, while the same segment is projected to expand at a 7.01% CAGR to 2031.
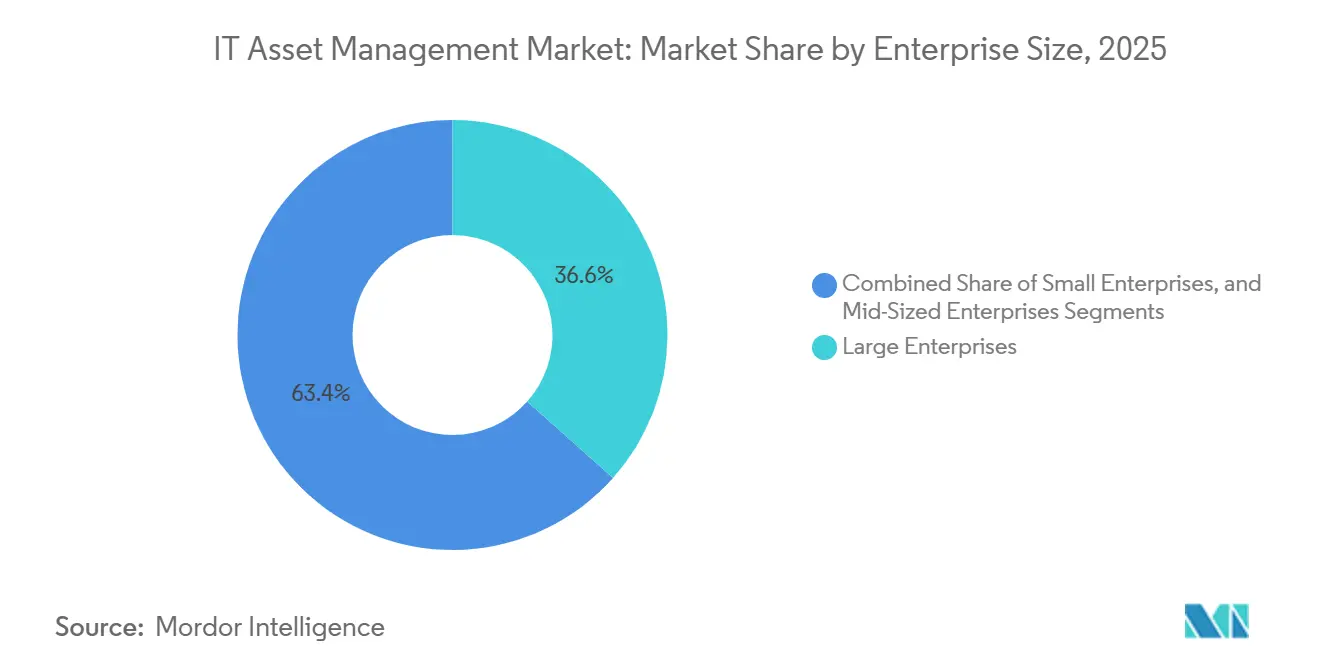
- By enterprise size, large enterprises accounted for 44.54% of 2025 revenue, yet small enterprises are forecast to expand at a 7.18% CAGR over 2026-2031.
- By end-user industry, BFSI led with 22.81% revenue share in 2025; healthcare and life sciences are expected to grow at a 7.88% CAGR through 2031.
- By geography, North America commanded 39.63% of the 2025 base, whereas Asia Pacific is poised to grow at a 7.43% CAGR to 2031.
Note: Market size and forecast figures in this report are generated using Mordor Intelligence’s proprietary estimation framework, updated with the latest available data and insights as of 2026.
Global IT Asset Management Market Trends and Insights
Drivers Impact Analysis*
| Driver | (~) % Impact on CAGR Forecast | Geographic Relevance | Impact Timeline |
|---|---|---|---|
| Expansion of Interconnected IT Infrastructure | +1.2% | Global, with pronounced effects in Asia Pacific and North America | Medium term (2-4 years) |
| Escalating Software-Licence Audit Risks and Costs | +1.5% | Global, particularly acute in North America and Europe | Short term (≤2 years) |
| Mandatory Regulatory Compliance (ISO 19770, GDPR, CSRD) | +1.8% | Europe leading, followed by North America; emerging in Asia Pacific | Long term (≥4 years) |
| Shift Toward Hybrid-Cloud and SaaS Environments | +1.4% | Global, with North America and Europe as early adopters | Medium term (2-4 years) |
| AI-Driven Autonomous Asset Discovery and Optimisation | +1.0% | North America and Europe core, spillover to Asia Pacific | Medium term (2-4 years) |
| ESG-Linked ITAM for Carbon-Footprint Reporting | +0.9% | Europe and North America, expanding to Asia Pacific | Long term (≥4 years) |
| Source: Mordor Intelligence | |||
Mandatory Regulatory Compliance
Enterprises are aligning IT asset registers with evolving statutes that now link operational resilience and climate accountability to verifiable inventories. Since January 2025, the Digital Operational Resilience Act obliges EU banks to maintain dynamic ICT asset catalogs and recovery objectives, placing direct emphasis on continuously updated dependency maps.[1]European Parliament, “Digital Operational Resilience Act,” europarl.europa.eu Simultaneously, ISO 19770-1:2024 introduced climate-action clauses requiring documentation of procurement and disposal impacts, turning asset-level carbon metrics into reportable data points. The Corporate Sustainability Reporting Directive expands this obligation across all large European companies, driving finance teams to integrate ITAM data with carbon-accounting ledgers. U.S. counterparts feel parallel pressure as HIPAA and PCI-DSS updates reference asset management as foundational security control, making regulatory alignment a universal adoption catalyst.
Shift Toward Hybrid-Cloud and SaaS Environments
Hybrid architectures fragment visibility because legacy discovery tools cannot track short-lived containers or interrogate multi-tenant SaaS metrics. ServiceNow’s 2025 ITAM Pro release addressed this gap with dependency mapping across Kubernetes clusters, enabling real-time remediation workflows. Cloud economics add urgency; a Flexera five-year total-cost study found that cloud ITAM platforms cut operating costs by 34% compared with on-premises options. Privacy-sensitive organizations adopt federated models that retain raw identifiers on-premise while exporting normalized counts to cloud analytics, balancing compliance with advanced optimization features. Multi-region enterprises layer jurisdiction-specific instances to meet divergent data-sovereignty rules, further propelling demand for SaaS-first, policy-aware discovery engines.
Escalating Software-Licence Audit Risks and Costs
Publishers such as Microsoft now run continuous-compliance engines that compare telemetry to entitlements, shrinking remediation windows from months to days.[2]Microsoft, “Microsoft Licensing,” microsoft.com Oracle applies audit logic to cloud mobility, claiming that VM movement across availability zones resets processor counts a stance that forces firms to maintain immutable deployment records. Enterprises lacking defensible maps face unbudgeted penalties, leading procurement and legal teams to mandate ITAM platforms with audit-simulation algorithms. Specialist providers monetise this urgency by bundling advisory services with real-time licence-position reconciliation, converting fear of punitive costs into predictable subscription revenue.
Expansion of Interconnected IT Infrastructure
Modern applications rely on distributed microservices stitched across data centers, multiple public clouds, and edge locations. An API misconfiguration in one region can expose assets elsewhere, elevating continuous discovery from cost-control utility to cybersecurity imperative. The UK National Cyber Security Centre’s Cyber Assessment Framework now recommends real-time asset discovery as a basic security control. Vendors respond with AI-driven graph databases that map relationships among containers, APIs, and serverless functions, enabling teams to model failure cascades before executing decommissioning or patch workflows. This capability directly reduces incident-response time and regulatory breach-notification exposure.
Restraints Impact Analysis*
| Restraint | (~) % Impact on CAGR Forecast | Geographic Relevance | Impact Timeline |
|---|---|---|---|
| Shortage of Skilled ITAM Practitioners and Process Maturity | -0.8% | Global, particularly acute in Asia Pacific and emerging markets | Long term (≥4 years) |
| Integration Complexity with Legacy and Siloed Tools | -0.6% | North America and Europe, where legacy estates are most entrenched | Medium term (2-4 years) |
| Privacy Concerns over Continuous Asset-Telemetry Collection | -0.4% | Europe leading due to GDPR; expanding to North America and Asia Pacific | Medium term (2-4 years) |
| Pricing Commoditisation Eroding Vendor Margins | -0.5% | Global, with competitive pressure highest in North America | Short term (≤2 years) |
| Source: Mordor Intelligence | |||
Shortage of Skilled ITAM Practitioners and Process Maturity
The IT Asset Management market relies on hybrid expertise spanning licensing, cybersecurity, and finance, yet universities seldom teach these combined disciplines. IAITAM’s 2024 survey showed 58% of organizations faced hiring delays over 120 days for senior roles. Asia Pacific feels the gap most acutely because rapid digital transformation outpaces formal training pipelines, inflating consulting costs. Process immaturity compounds the talent deficit many enterprises still lack documented asset-lifecycle workflows, forcing scarce experts to design procedures before executing them. Public-sector agencies struggle even more; a UK Government Greening ICT study revealed less than 30% had linked ITAM data to carbon reports, despite legal mandates.[3]UK Government, “Greening Government ICT,” gov.uk
Integration Complexity with Legacy and Siloed Tools
Large enterprises juggle an average of 11 point solutions, from CMDBs to vulnerability scanners, each with proprietary schemas. Integrating a modern platform consumes up to 60% of initial budgets and often stretches deployments beyond a year. Legacy mainframe estates aggravate blind spots because discovery agents cannot parse proprietary metadata without custom middleware. An IBM modernization study noted that 73% of global firms still run mission-critical workloads on platforms older than 15 years. Shadow-IT purchases via expense reports widen data gaps, compelling ITAM vendors to scrape single sign-on and finance systems for completeness, yet this forensic integration raises project complexity and delays return on investment.
*Our forecasts treat driver/restraint impacts as directional, not additive. The impact forecasts reflect baseline growth, mix effects, and variable interactions.
Segment Analysis
By Asset Type: Services Segment Gains as Outsourcing Accelerates
Services revenue within the IT Asset Management market size is projected to expand at a 6.98% CAGR, outpacing software and hardware segments through 2031. Enterprises outsource audit-defense, licence optimisation, and cloud-cost analytics to specialists maintaining current publisher rulebooks, relieving internal teams of complex reconciliation tasks.
Hardware tracking is increasingly a feature of endpoint security or infrastructure monitoring suites, shifting standalone demand toward edge and mobile inventories. In software, traditional licence management tools are being supplanted by SaaS-centric platforms that integrate directly with hyperscaler billing APIs. Recurring managed-services contracts improve vendor revenue predictability but require clients to relinquish day-to-day operational control. As vendors bundle proactive lifecycle dashboards, for example, ServiceNow’s failure-rate predictions, customers move from reactive asset counting to data-driven refresh strategies, reinforcing the migration from product to service value.


By Deployment Model: Cloud Platforms Dominate as Hybrid Complexity Rises
Cloud solutions captured 63.12% of 2025 revenue and continue to lead the IT Asset Management market share, supported by a 7.01% CAGR forecast. SaaS delivery eliminates on-premise maintenance costs and speeds feature rollout, making it the default for greenfield deployments. Regulated industries still retain subsets of data on-premise, generating demand for hybrid architectures that replicate sanitized records to cloud analytics.
Federated-query technology, like Snow Software’s 2025 launch, allows on-prem agents to send aggregated counts, not raw identifiers, addressing GDPR privacy concerns. Economically, Flexera’s study found that cloud models reduce five-year operating costs by 34%, mostly by eliminating database-administration labor. Multinationals configure region-specific instances to satisfy divergent sovereignty laws, yet share data into a unified dashboard, underscoring the flexibility advantage of cloud-first ITAM.
By Enterprise Size: Small Enterprises Embrace Simplified Cloud Tools
Large enterprises generated 44.54% of 2025 revenue as their complex estates demand granular visibility, but small businesses now represent the fastest-growing slice of the IT Asset Management industry at 7.18% CAGR. Microsoft’s 2024 decision to extend compliance verification to customers with as few as 50 seats drove small firms toward entry-level SaaS tools priced below USD 5,000 annually.
Lightweight platforms such as Lansweeper auto-discover assets via identity-provider integrations, limiting the need for desktop-support deployment, and upsell to compliance modules once audit pressure escalates. Mid-market organizations lean on managed-service bundles that provide discovery software and outsourced analysts, bridging budget and expertise gaps. Meanwhile, large enterprises consolidate ITAM, incident, and change workflows on enterprise-service-management suites, trading best-of-breed flexibility for platform stickiness.
By End-User Industry: Healthcare Leads Growth Amid Regulatory Pressure
BFSI institutions held 22.81% of 2025 spending, propelled by DORA’s stringent inventory mandates, yet healthcare and life sciences headline growth at 7.88% CAGR through 2031. FDA cybersecurity guidance now requires hospitals to maintain software bills of materials for connected medical equipment, expanding ITAM’s remit into operational-technology environments.
HIPAA breach-notification liability further compels providers to track unpatched endpoints or face financial penalties. Retailers deploy ITAM to comply with PCI-DSS 4.0, managing point-of-sale and edge nodes, while manufacturers extend visibility to industrial-IoT sensors. Public-sector demand surges in Asia Pacific as India and China embed centralized inventories into procurement legislation, reinforcing regional growth momentum. Energy, utilities, and education present long-tail opportunities as each adapts ITAM frameworks to sector-specific compliance drivers.
Geography Analysis
North America contributed 39.63% of 2025 IT Asset Management market revenue, reflecting mature audit-defense use cases and early adoption of carbon-accounting integrations. U.S. enterprises now prioritize modeling the financial impact of software vendors’ subscription transitions, while Canadian growth quickens under provincial privacy statutes aligning with GDPR. Mexico’s demand stems from multinational manufacturing plants required to conform to parent-company governance policies.
Europe’s momentum originates in statutory compulsion. CSRD’s Scope 3 disclosure criteria and DORA’s operational-resilience rules embed ITAM deep into finance and risk management, particularly in Germany and the United Kingdom. France accelerates adoption under circular-economy mandates that demand lifecycle tracking for refurbish-ready electronics. Pan-European firms value platforms with multi-tenant architectures that maintain jurisdiction-specific compliance modules, simplifying trans-border data reconciliations.
Asia Pacific delivers the fastest trajectory at 7.43% CAGR between 2026-2031. India’s Digital Personal Data Protection Act and China’s Cybersecurity Law revisions oblige agencies to sustain real-time asset visibility, spurring demand for localized language support and government-portal integrations. Japan’s amended Act on the Protection of Personal Information broadens breach-notification triggers, elevating asset inventories as foundational compliance evidence. Markets in Southeast Asia benefit from managed-service offerings tailored to organizations lacking in-house expertise, while Australian enterprises integrate ITAM with carbon-reduction roadmaps under the Safeguard Mechanism reforms. Collectively, these drivers position Asia Pacific as the principal expansion frontier for the IT Asset Management market.

Competitive Landscape
The IT Asset Management market remains moderately fragmented; the top five vendors, ServiceNow, Microsoft, IBM, BMC, and Flexera, collectively held just a 38% share in 2025. Platform convergence shapes competitive dynamics as hyperscale vendors embed ITAM into broader observability and FinOps suites. ServiceNow folds ITAM Pro into its flagship enterprise service management cloud, creating high switching costs that disadvantage point-solution rivals.[4]ServiceNow, “IT Asset Management,” servicenow.com Broadcom’s 2024 purchase of VMware and subsequent subscription bundling sparked a wave of asset-validation projects that temporarily inflated consulting revenue but also signaled future pricing pressure on standalone licence-management tools.
Niche opportunities surface at the intersection of ITAM and ESG reporting, where no provider yet automates end-to-end Scope 3 factor mapping. Lightweight SaaS entrants such as Axonius and Lansweeper court small and mid-sized enterprises with rapid-time-to-value discovery engines that require minimal configuration. Generative-AI adoption is accelerating; pilots have shown that large-language models can parse tens of thousands of contracts to pinpoint unused entitlements, compressing six-month manual exercises into hours. Incumbents respond by integrating AI microservices for automatic remediation suggestions and predictive cost analytics, differentiating on depth of publisher relationship networks rather than raw discovery footprint. ISO 19770 certification and GDPR compliance posture increasingly dictate shortlist criteria, especially among European buyers prioritizing built-in audit trails.
Regional specialists add competitive tension by tailoring discovery engines to local compliance nuances for example, vendors in Japan embed privacy-impact scoring aligned with the Act on the Protection of Personal Information, while Indian providers integrate with government e-procurement portals to streamline invoice validation. Strategic alliances further reshape the field, Snow Software’s partnership with Ivanti marries endpoint-security telemetry to asset registers, giving both companies cross-sell channels into previously siloed budgets. Finally, the entrance of FinOps-centric start-ups focused on granular cloud-billing reconciliation forces incumbents to accelerate roadmap delivery of cost-attribution dashboards or risk ceding share in a domain adjacent to their core licence-management stronghold.
IT Asset Management Industry Leaders
Dell Technologies Inc.
Microsoft Corporation
IBM Corporation
BMC Software, Inc.
HP Inc.
- *Disclaimer: Major Players sorted in no particular order

Recent Industry Developments
- February 2026: IBM launched its next-generation IT Asset Intelligence Suite, adding AI-driven lifecycle analytics and automated compliance mapping for ISO 19770 and CSRD.
- January 2026: ServiceNow introduced real-time anomaly detection and automated remediation spanning Oracle Cloud and Microsoft Azure within ITAM Pro.
- December 2025: Snow Software and Ivanti partnered to offer integrated ITAM and endpoint-security visibility across hybrid workforces.
- November 2025: Flexera acquired a cloud cost-optimization startup for USD 52 million, strengthening automated resource-allocation analytics.


Global IT Asset Management Market Report Scope
The IT Asset Management Market is witnessing significant growth due to the increasing adoption of digital transformation initiatives, the rising need for efficient asset tracking, and the growing emphasis on cost optimization across industries. Organizations are increasingly leveraging IT asset management solutions to streamline operations, enhance productivity, and ensure compliance with regulatory standards, driving the demand for these solutions globally.
The IT Asset Management Market Report is Segmented by Asset Type (Hardware including Servers and Mainframes, PCs and Laptops, Mobile and Edge Devices, Networking Equipment; Software including Software Asset Management, Cloud and SaaS Subscriptions, Endpoint Security and EDR Licences; Services), Deployment Model (On-Premise, Cloud, Hybrid), Enterprise Size (Small Enterprises, Mid-Sized Enterprises, Large Enterprises), End-User Industry (IT and Telecom, Banking Financial Services and Insurance, Healthcare and Life Sciences, Retail and e-Commerce, Manufacturing, Government and Public Sector, Energy and Utilities, Education), and Geography (North America, South America, Europe, Asia Pacific, Middle East, Africa). The Market Forecasts are Provided in Terms of Value in USD.
| Hardware | Servers and Mainframes |
| PCs and Laptops | |
| Mobile and Edge Devices | |
| Networking Equipment | |
| Software | Software Asset Management (SAM) |
| Cloud and SaaS Subscriptions | |
| Endpoint Security and EDR Licences | |
| Services |
| On-Premise |
| Cloud |
| Hybrid |
| Small Enterprises (1-99 FTE) |
| Mid-Sized Enterprises (100-999 FTE) |
| Large Enterprises (1,000+ FTE) |
| IT and Telecom |
| Banking, Financial Services and Insurance |
| Healthcare and Life Sciences |
| Retail and e-Commerce |
| Manufacturing |
| Government and Public Sector |
| Energy and Utilities |
| Education |
| North America | United States |
| Canada | |
| Mexico | |
| South America | Brazil |
| Argentina | |
| Europe | Germany |
| United Kingdom | |
| France | |
| Rest of Europe | |
| Asia Pacific | China |
| Japan | |
| India | |
| Rest of Asia Pacific | |
| Middle East | United Arab Emirates |
| Saudi Arabia | |
| Rest of Middle East | |
| Africa | South Africa |
| Rest of Africa |
| By Asset Type | Hardware | Servers and Mainframes |
| PCs and Laptops | ||
| Mobile and Edge Devices | ||
| Networking Equipment | ||
| Software | Software Asset Management (SAM) | |
| Cloud and SaaS Subscriptions | ||
| Endpoint Security and EDR Licences | ||
| Services | ||
| By Deployment Model | On-Premise | |
| Cloud | ||
| Hybrid | ||
| By Enterprise Size | Small Enterprises (1-99 FTE) | |
| Mid-Sized Enterprises (100-999 FTE) | ||
| Large Enterprises (1,000+ FTE) | ||
| By End-User Industry | IT and Telecom | |
| Banking, Financial Services and Insurance | ||
| Healthcare and Life Sciences | ||
| Retail and e-Commerce | ||
| Manufacturing | ||
| Government and Public Sector | ||
| Energy and Utilities | ||
| Education | ||
| By Geography | North America | United States |
| Canada | ||
| Mexico | ||
| South America | Brazil | |
| Argentina | ||
| Europe | Germany | |
| United Kingdom | ||
| France | ||
| Rest of Europe | ||
| Asia Pacific | China | |
| Japan | ||
| India | ||
| Rest of Asia Pacific | ||
| Middle East | United Arab Emirates | |
| Saudi Arabia | ||
| Rest of Middle East | ||
| Africa | South Africa | |
| Rest of Africa | ||


Key Questions Answered in the Report
Which segment is expanding fastest within the IT Asset Management market?
The services segment is forecast to grow at 6.98% CAGR to 2031 as enterprises outsource audit defense and cloud-cost analytics.
How large will the global IT asset inventory tooling spend be by 2031?
The IT Asset Management market size is projected to reach USD 3.01 billion by 2031.
What regulatory changes have the greatest impact on tooling requirements?
The EU’s Digital Operational Resilience Act and Corporate Sustainability Reporting Directive mandate continuously updated ICT inventories and Scope 3 emissions data, respectively.
Why are small businesses suddenly investing in asset management platforms?
Microsoft expanded licence-compliance verification to customers with as few as 50 seats, exposing smaller firms to audit risk and driving adoption of entry-level SaaS ITAM tools.
Which region presents the strongest growth outlook?
Asia Pacific leads with a projected 7.43% CAGR from 2026-2031, fueled by digital-government mandates and data-protection laws in India, China, and Japan.
How are vendors differentiating amid rising commoditization?
Leading providers embed generative AI for automated licence reconciliation and integrate carbon accounting features to help clients meet new sustainability disclosure rules.
Page last updated on:


