Deep Tech Market Size and Share
Market Overview
| Study Period | 2019 - 2030 |
|---|---|
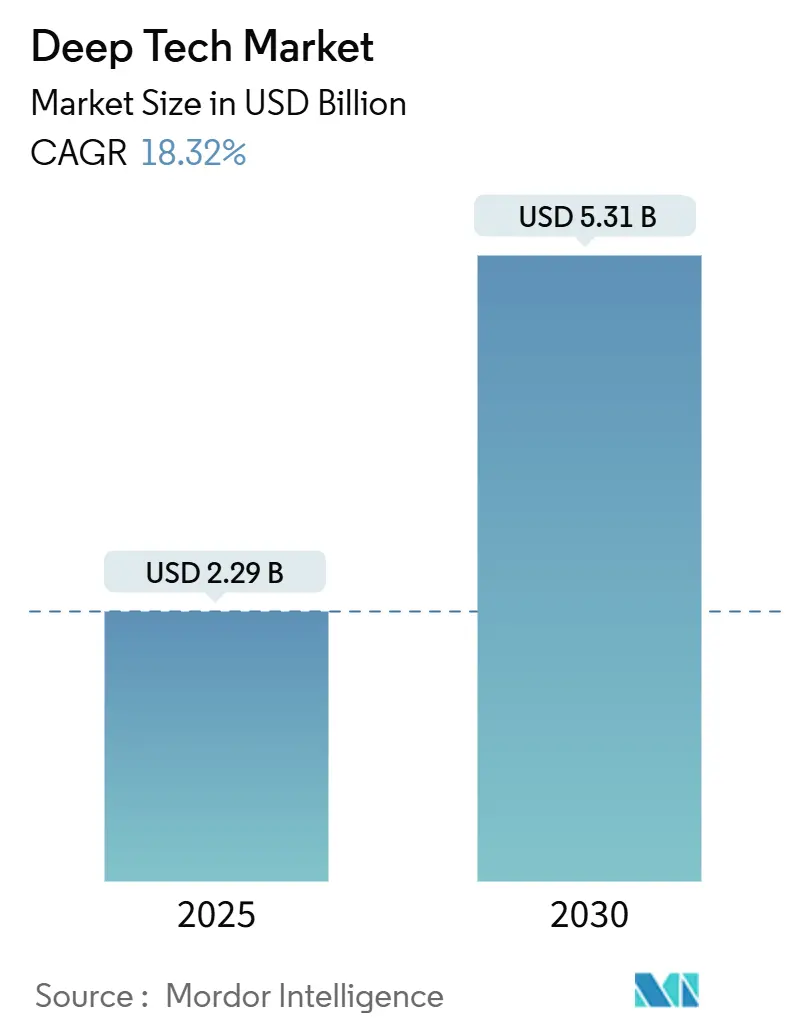
| Market Size (2025) | USD 2.29 Billion |
| Market Size (2030) | USD 5.31 Billion |
| Growth Rate (2025 - 2030) | 18.32% CAGR |
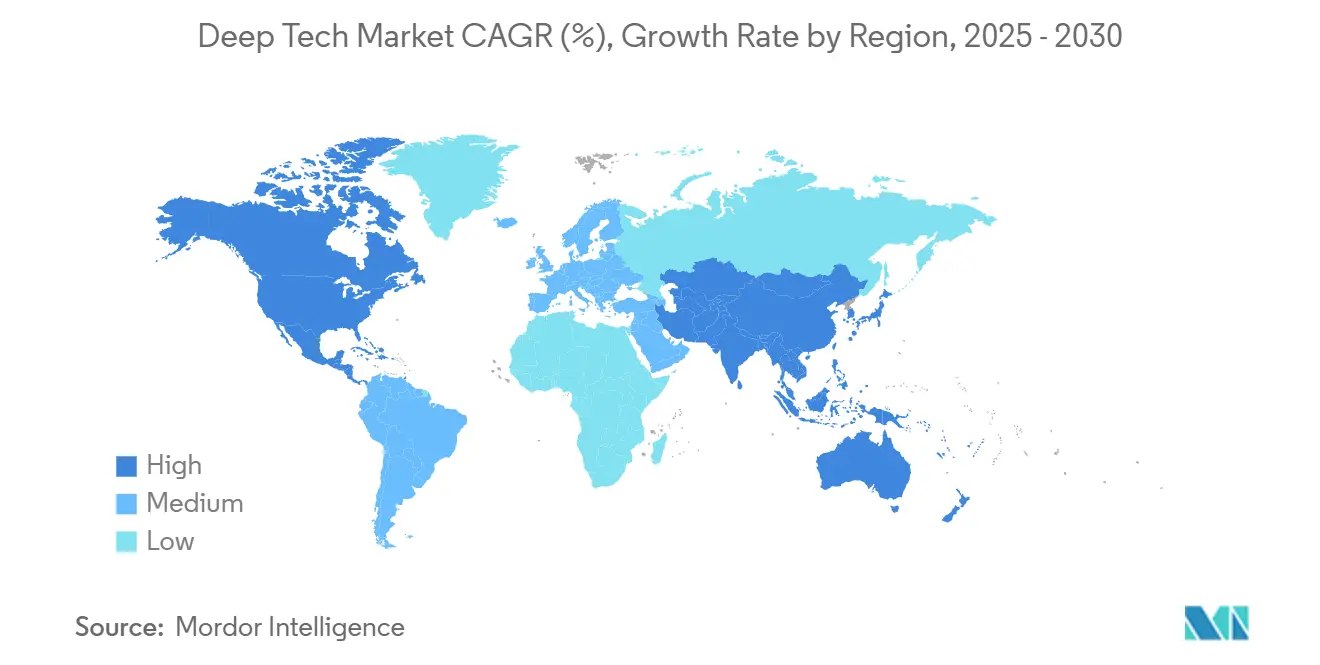
| Fastest Growing Market | Asia Pacific |
| Largest Market | North America |
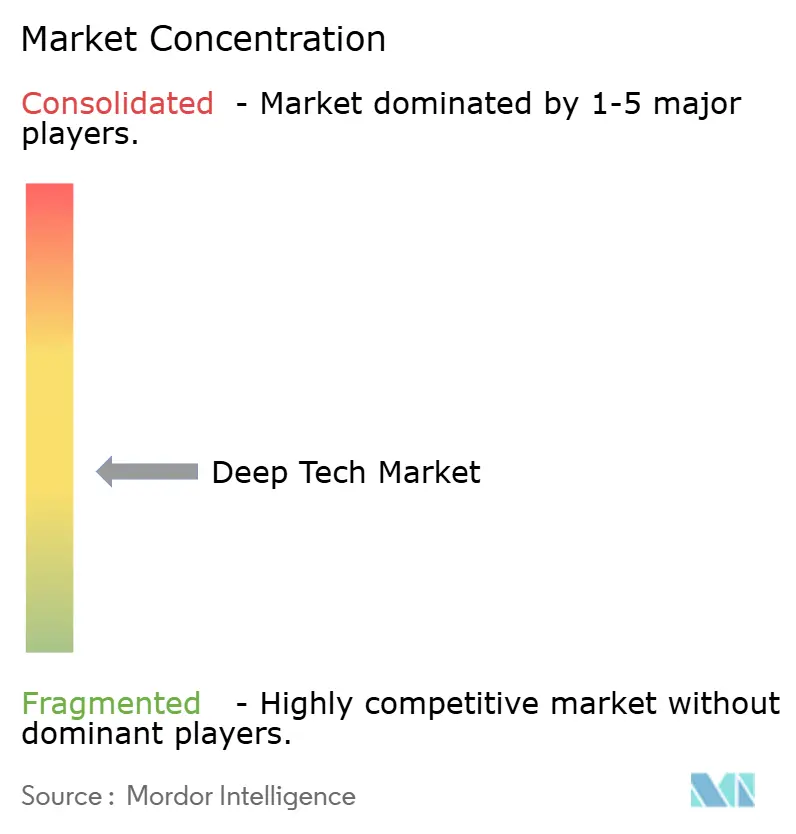
| Market Concentration | Medium |
Major Players *Disclaimer: Major Players sorted in no particular order Image © Mordor Intelligence. Reuse requires attribution under CC BY 4.0. | |
Deep Tech Market Analysis by Mordor Intelligence
The deep tech market size stood at USD 2.29 billion in 2025 and is forecast to reach USD 5.31 billion by 2030, translating into an 18.32% CAGR over the period. The steep growth curve stems from surging public-sector grants, rising corporate digital-transformation budgets, and mounting pressure on nations to secure technological sovereignty. Artificial intelligence (AI) keeps the spotlight on data-centric innovation, while quantum computing breakthroughs are opening new revenue streams far sooner than earlier projections. Sovereign deep-tech funds launched in Canada, the United Kingdom, and Singapore are shortening commercialization timelines by co-financing critical infrastructure projects. Simultaneously, defense-driven procurements are accelerating dual-use applications in cybersecurity, autonomous navigation, and materials science, providing predictable demand that attracts private investment. Supply-chain geopolitics remain a key uncertainty, yet they also provoke domestic innovation in restricted jurisdictions, cushioning overall growth momentum.
Key Report Takeaways
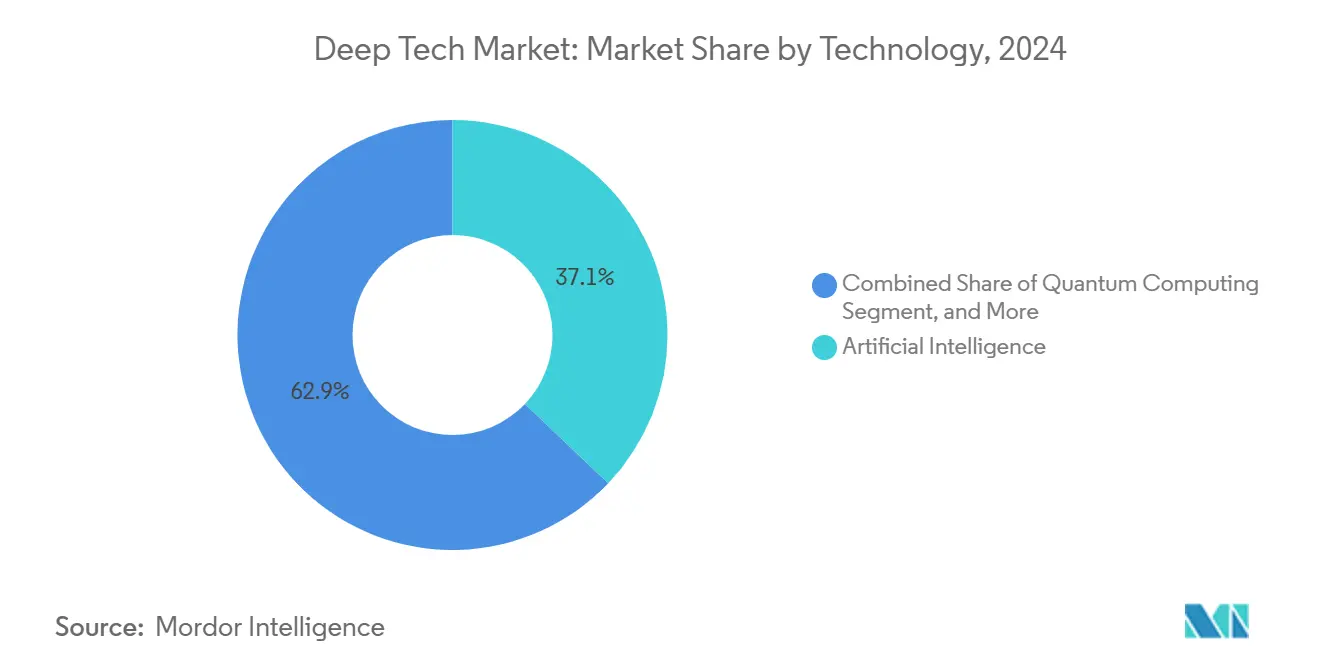
- By technology, artificial intelligence led with a 37.1% deep tech market share in 2024, while quantum computing is projected to advance at a 19.7% CAGR through 2030.
- By funding stage, Series A–Series B captured 54.2% share of the deep tech market size in 2024; Seed/Pre-seed financing is expanding at a 20.1% CAGR to 2030.
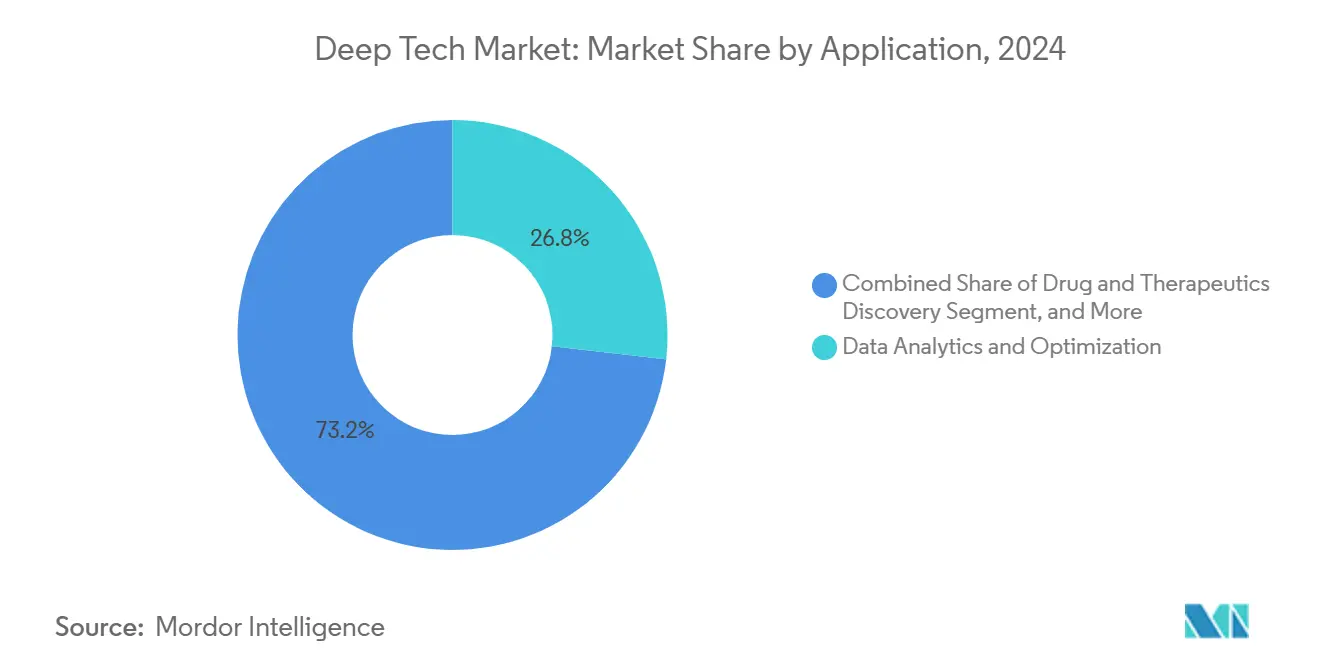
- By application, data analytics and optimization commanded 26.8% of the deep tech market size in 2024 and industrial automation is progressing at an 18.9% CAGR through 2030.
- By end-user industry, IT and telecom held 21.4% of 2024 revenue, while healthcare and life sciences is pacing at an 18.5% CAGR to 2030.
- By geography, North America accounted for 36.5% of 2024 revenue; Asia-Pacific is set to grow at a 19.3% CAGR through 2030.
Global Deep Tech Market Trends and Insights
Drivers Impact Analysis*
| Driver | (~) % Impact on CAGR Forecast | Geographic Relevance | Impact Timeline |
|---|---|---|---|
| Rapid advances in enabling technologies | +4.2% | Global, North America, China, EU | Medium term (2–4 years) |
| Government funding for breakthrough technologies | +3.8% | North America, EU, Asia-Pacific | Short term (≤ 2 years) |
| Corporate digital-transformation pressure | +3.1% | Global, led by North America and Europe | Medium term (2–4 years) |
| Venture-capital inflows and unicorn creation | +2.9% | North America, Asia-Pacific, selective EU | Short term (≤ 2 years) |
| Defense-sector dual-use procurement accelerators | +2.4% | North America, EU, Australia, selective Asia-Pacific | Medium term (2–4 years) |
| Emergence of sovereign deep-tech funds | +1.8% | Asia-Pacific, Middle East, Latin America | Long term (≥ 4 years) |
| Source: Mordor Intelligence | |||
Rapid Advances in Enabling Technologies Drive Cross-Domain Innovation
Breakthrough achievements across AI, quantum computing, and synthetic biology are collapsing erstwhile silos. Google’s Willow quantum chip reached new error-correction thresholds in 2024, while EvolutionaryScale’s ESM3 model simulated 500 million years of protein evolution.[1]Amazon, “EvolutionaryScale Launches with ESM3: A Milestone AI Model for Biology,” press.aboutamazon.com SandboxAQ’s quantum-enhanced AI navigation suite now ships in commercial form, eliminating GPS dependency. These milestones accelerate solution development in drug discovery, materials design, and resilience engineering, compelling incumbents to fast-track capability acquisitions or risk erosion of incumbency advantages.
Government Funding Mechanisms Reshape Innovation Ecosystems
The USD 500 billion Stargate program in the United States, the EU’s dedicated EUR 112 million AI-and-quantum call, and Canada’s BOREALIS agency typify state-backed efforts to derisk frontier research. Mandatory co-investment clauses and regulatory sandboxes embedded in these initiatives foster local supply-chain formation and talent pipelines, effectively positioning deep-tech capability as strategic infrastructure rather than optional experimentation.
Corporate Digital Transformation Accelerates Deep Tech Adoption
Ninety-seven percent of global executives expect generative AI to redefine enterprise processes, and 70% of factory managers list workforce transformation as pivotal to competitiveness. Finance multinationals suggest AI could lift sector profits by USD 2 trillion by 2028. Consequently, enterprise procurement acts as a reliable commercialization conduit, turning formerly academic prototypes into scalable, revenue-generating platforms and anchoring the deep tech market in mainstream operational budgets.
Venture-Capital Ecosystem Matures Around Deep Tech Investments
Funds exceeding EUR 300 million (USD 352.91 million)—such as World Fund and Kembara—are normalizing longer investment horizons that mirror quantum and synthetic-biology development cycles. The injection of USD 1 billion into SSI and USD 450 million into PsiQuantum illustrates investors’ growing comfort with capital-intensive projects exhibiting nonlinear payoff structures. Specialized diligence teams and staged tranche releases reduce early-stage information asymmetries, contributing to sustainable funding flows.
Restraints Impact Analysis*
| Restraint | (~) % Impact on CAGR Forecast | Geographic Relevance | Impact Timeline |
|---|---|---|---|
| High capital intensity and long commercialization cycles | −2.8% | Global | Long term (≥ 4 years) |
| Regulatory uncertainty and ethical concerns | −2.1% | Global | Medium term (2–4 years) |
| Talent scarcity in interdisciplinary domains | −1.9% | Global | Medium term (2–4 years) |
| Hardware supply-chain geopolitics | −1.6% | Global | Short term (≤ 2 years) |
| Source: Mordor Intelligence | |||
High Capital Requirements Create Funding Bottlenecks
Quantum start-ups alone require roughly EUR 15 billion (USD 17.65 billion) between 2020 and 2030 to cross the commercialization finish line. PsiQuantum’s planned multi-billion-dollar fabrication campus on Chicago’s South Works site exemplifies the burdensome physical-asset profile that constrains early-stage entrants. Extended R&D horizons clash with traditional venture timeframes, forcing firms to court strategic investors, governments, or corporate joint ventures.
Regulatory Frameworks Struggle to Keep Pace with Technology
The EU AI Act imposes far-reaching compliance duties, while US policy leans toward executive orders and post-market enforcement. Parallel export-control regimes governing AI chips and model parameters add multi-jurisdictional complexity. For synthetic biology, divergent bio-safety codes heighten approval costs. Uncertainty obliges companies to maintain redundant legal strategies, diverting capital from innovation to compliance.
*Our forecasts treat driver/restraint impacts as directional, not additive. The impact forecasts reflect baseline growth, mix effects, and variable interactions.
Segment Analysis
By Technology: Quantum Computing Accelerates Commercial Breakthroughs
The segment generated the second-largest contribution to 2024 revenue but remains the fastest-growing, expanding at a 19.7% CAGR through 2030. Quantum-AI integration proofs—such as Oxford Ionics’ 99.97% gate fidelity and IQM’s EUR 128 million funding—signal readiness for industrial pilot programs.[2]IQM, “IQM Quantum Computers Raises €128 m Series A2 Funding,” meetiqm.com AI retains leadership at 37.1% deep tech market share due to widespread cloud-service deployments and sovereign-AI mandates. Robotics and drones add steady incremental gains by embedding foundation models that obviate expensive lidar.
Advanced materials and synthetic biology lean on machine learning for accelerated discovery cycles. Seoul National University’s LLM-based synthesizability engine helps compress materials R&D timelines from years to months. At the convergence frontier, Quantum-AI frameworks simulate protein-ligand interactions, linking quantum hardware achievements directly to bio-pharma pipelines.


By Funding Stage: Early-Stage Momentum Redefines Capital Stacks
Series A–Series B rounds secured 54.2% of capital in 2024, demonstrating investor preference for ventures with validated prototypes. Growth-stage pools such as EIF-backed Kembara fill later-stage gaps, yet overall late-stage deal volume moderates as capital requirements escalate.
Seed/Pre-seed allocations, registering 20.1% CAGR, reflect risk-tolerant capital circling earlier ideas armed with clearer market pathways and government grant leverage. The European Innovation Council’s EUR 411 million disbursement to 68 start-ups signals institutional readiness to absorb early-stage technology risk. As specialized funds proliferate, blended finance models combining grant, equity, and strategic debt emerge as the dominant blueprint for deep tech market capitalization.
By Application: Industrial Automation Leads Growth Surge
Data analytics and optimization supplied 26.8% of 2024 revenue, buoyed by mature AI pipelines in finance, retail, and logistics. Industrial automation now posts the fastest growth rate at 18.9% CAGR as manufacturers deploy foundation models that coordinate multi-robot cells on shop floors. Vayu Robotics demonstrates lidar-free on-road delivery robots, slashing bill-of-materials costs.
Drug discovery applications gain traction as quantum simulations reach biologically relevant scales. Materials and chemicals discovery utilize AI-driven retrosynthesis to reduce laboratory iterations. Quantum-enhanced machine-learning tools address malware detection, elevating cybersecurity to board-level priority. Climate-tech solutions attract dedicated capital, aligning sustainability mandates with deep tech innovation.
By End-User Industry: Healthcare Gains Adoption Momentum
IT and telecom held a 21.4% revenue share in 2024 by virtue of 5G-cloud infrastructure rollouts and AI-accelerated silicon demand. Healthcare and life sciences log an 18.5% CAGR to 2030, aided by GE HealthCare’s alliance with AWS to exploit unstructured imaging datasets.
Defense and aerospace anchor dual-use spending, while manufacturing absorbs AI automation for resilient supply chains. Energy utilities target quantum optimization for distributed-grid management. BFSI leans on generative AI for fraud analytics, and agriculture trials precision-farming algorithms for input-use efficiency. Wide industry adoption cements the deep tech market as indispensable enterprise infrastructure.
Geography Analysis
North America captured 36.5% of 2024 revenue owing to unmatched venture-capital depth and the Stargate program’s USD 500 billion spending track. Federal memoranda and export-control measures toggle between market creation and ecosystem gating, but sustained university-industry consortia continue to funnel intellectual property into start-ups. Canada’s BOREALIS agency and defense procurements inject further momentum.
Europe serves as regulatory trendsetter, allocating EUR 112 million under Horizon Europe and mobilizing EUR 10 billion via the European Tech Champions Initiative.[3]European Commission, “New Horizon Europe Funding Boosts European Research in AI and Quantum Technologies,” digital-strategy.ec.europa.eu Germany pushes industrial automation, the United Kingdom advances quantum leadership, and France underwrites deep-tech scaling programs. Strict AI governance raises compliance expense but improves global marketability for certified solutions.
Asia-Pacific exhibits the fastest regional expansion at 19.3% CAGR. China’s doubled equity issuance, Singapore’s USD 332 million attraction package, Japan’s soft-regulation AI Act, South Korea’s targeted growth sectors, and Australia’s quantum initiatives illustrate high-velocity policy experimentation. Export-license frictions reshape supply-chain logistics but concurrently spark local silicon fabrication and model-training capacity.

Competitive Landscape
Competition remains technology-specific and innovation-centric. Platform incumbents—Alphabet, Microsoft, NVIDIA—bundle AI accelerators, cloud capacity, and foundation models to extract scale economies. In quantum computing, specialized start-ups like PsiQuantum, Oxford Ionics, and IQM secure strategic capital and government backing, preserving fragmentation. Synthetic-biology competitors such as EvolutionaryScale and Abiologics exploit AI-driven protein engineering to carve fresh niches.
Strategic moves trend toward vertical integration. Meta’s USD 14.3 billion outlay to Scale AI aims to internalize data-set curation, while Apple’s reported interest in Perplexity AI hints at proprietary search pipelines. Telecom OEMs adopt semantic-graph engines to on-device AI, as Samsung’s integration of RDFox in Galaxy S25 exemplifies. Geopolitical controls create region-locked competitive pools, nudging US and allied firms toward domestic supply consolidation and encouraging Asian peers to champion indigenous alternatives.
M&A appetite intensifies for cross-domain capability fusion—quantum-AI simulators, bio-AI therapeutics, and materials-AI generative design. Start-ups with defensible IP around hardware architectures or data-rich biological models command premium valuations, catalyzing a race for exclusive licensing deals. Competitive rivalry, therefore, oscillates between scale-driven incumbents and niche-focused disruptors, with collaboration windows widening around standard-setting and interoperability frameworks.
Deep Tech Industry Leaders
Alphabet Inc. (Google DeepMind)
International Business Machines Corporation
NVIDIA Corporation
Microsoft Corporation
Amazon Web Services, Inc.
- *Disclaimer: Major Players sorted in no particular order

Recent Industry Developments
- July 2025: The White House unveiled the AI Action Plan to accelerate domestic infrastructure build-out and promote US technology exports.
- July 2025: OpenAI and the UK government announced a strategic partnership to expand AI infrastructure and security collaboration.
- July 2025: The Pentagon awarded four agentic-AI contracts worth USD 200 million each to Anthropic, Google, OpenAI, and xAI.
- June 2025: Canada launched BOREALIS to bolster research in AI and quantum fields.


Global Deep Tech Market Report Scope
| Artificial Intelligence |
| Quantum Computing |
| Robotics and Drones |
| Advanced Materials and Nanotech |
| Synthetic Biology and Biotech |
| Other Deep-Tech Technologies |
| Seed / Pre-seed |
| Series A - Series B |
| Growth / Expansion |
| Late Stage / Pre-IPO |
| Data Analytics and Optimization |
| Drug and Therapeutics Discovery |
| Materials and Chemicals Discovery |
| Autonomous Systems and Mobility |
| Industrial Automation and Robotics |
| Cybersecurity and Threat Detection |
| Climate-Tech and Sustainability Solutions |
| Other Applications |
| IT and Telecom |
| Healthcare and Life Sciences |
| Defense and Aerospace |
| Manufacturing |
| Energy and Utilities |
| BFSI |
| Agriculture and Food |
| Transportation and Logistics |
| Other End-user Industries |
| North America | United States |
| Canada | |
| Mexico | |
| Europe | Germany |
| United Kingdom | |
| France | |
| Italy | |
| Spain | |
| Rest of Europe | |
| Asia-Pacific | China |
| Japan | |
| India | |
| South Korea | |
| Australia | |
| Rest of Asia-Pacific | |
| South America | Brazil |
| Argentina | |
| Rest of South America | |
| Middle East and Africa | Saudi Arabia |
| United Arab Emirates | |
| South Africa | |
| Rest of Middle East and Africa |
| By Technology | Artificial Intelligence | |
| Quantum Computing | ||
| Robotics and Drones | ||
| Advanced Materials and Nanotech | ||
| Synthetic Biology and Biotech | ||
| Other Deep-Tech Technologies | ||
| By Funding Stage | Seed / Pre-seed | |
| Series A - Series B | ||
| Growth / Expansion | ||
| Late Stage / Pre-IPO | ||
| By Application | Data Analytics and Optimization | |
| Drug and Therapeutics Discovery | ||
| Materials and Chemicals Discovery | ||
| Autonomous Systems and Mobility | ||
| Industrial Automation and Robotics | ||
| Cybersecurity and Threat Detection | ||
| Climate-Tech and Sustainability Solutions | ||
| Other Applications | ||
| By End-user Industry | IT and Telecom | |
| Healthcare and Life Sciences | ||
| Defense and Aerospace | ||
| Manufacturing | ||
| Energy and Utilities | ||
| BFSI | ||
| Agriculture and Food | ||
| Transportation and Logistics | ||
| Other End-user Industries | ||
| By Geography | North America | United States |
| Canada | ||
| Mexico | ||
| Europe | Germany | |
| United Kingdom | ||
| France | ||
| Italy | ||
| Spain | ||
| Rest of Europe | ||
| Asia-Pacific | China | |
| Japan | ||
| India | ||
| South Korea | ||
| Australia | ||
| Rest of Asia-Pacific | ||
| South America | Brazil | |
| Argentina | ||
| Rest of South America | ||
| Middle East and Africa | Saudi Arabia | |
| United Arab Emirates | ||
| South Africa | ||
| Rest of Middle East and Africa | ||


Key Questions Answered in the Report
How big is the deep tech market in 2025 and where is it heading by 2030?
The deep tech market size reached USD 2.29 billion in 2025 and is forecast to climb to USD 5.31 billion by 2030, reflecting an 18.32% CAGR.
Which technology segment is growing the fastest?
Quantum computing is the fastest-expanding segment, projected to post a 19.7% CAGR as hardware error-correction and commercial pilots mature.
What drives corporate demand for deep tech solutions?
Enterprise digital-transformation programs, particularly in manufacturing, finance, and healthcare, are accelerating adoption of AI, quantum, and robotics platforms to gain efficiency and competitive differentiation.
Why is Asia-Pacific the highest-growth region?
Expanding public-sector funding in China, Singapore, India, and Japan, combined with rapidly scaling venture-capital ecosystems, push Asia-Pacific toward a 19.3% CAGR through 2030.
What funding stages attract the most investment today?
Series A–Series B rounds dominate with 54.2% of 2024 capital, while Seed/Pre-seed stages log the fastest growth at 20.1% CAGR as investors enter earlier in the development cycle.
Which end-user industry shows the strongest growth momentum?
Healthcare and life sciences lead with an 18.5% CAGR through 2030, propelled by AI-enabled drug discovery and quantum-powered diagnostics.
Page last updated on:


