Washed Silica Sand Market Size and Share
Market Overview
| Study Period | 2021 - 2031 |
|---|---|
| Market Size (2026) | USD 24.92 Billion |
| Market Size (2031) | USD 32.97 Billion |
| Growth Rate (2026 - 2031) | 5.76% CAGR |
| Fastest Growing Market | Asia Pacific |
| Largest Market | Asia Pacific |
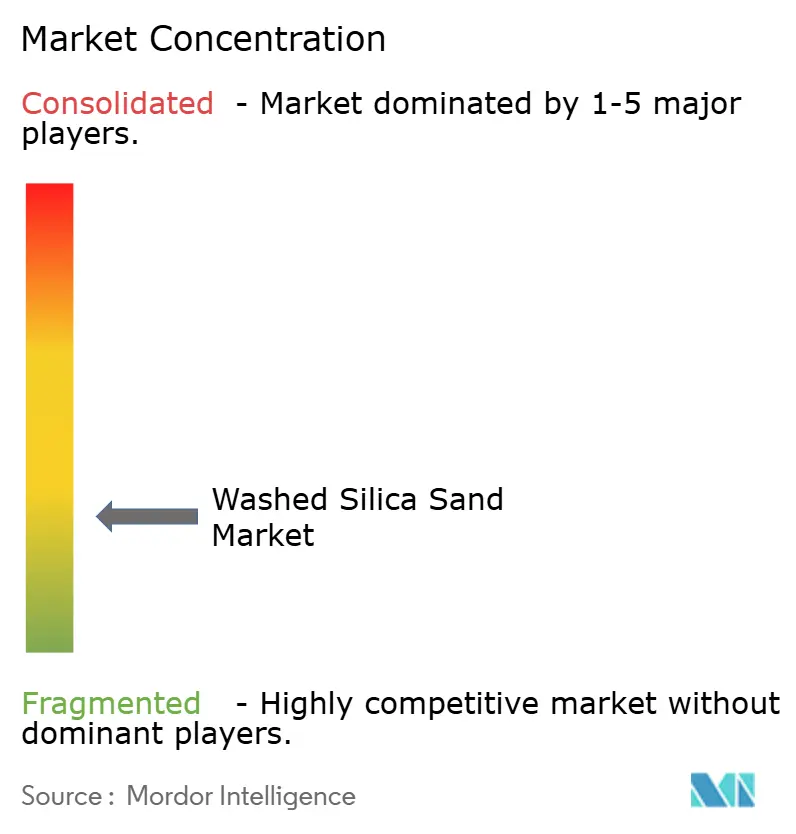
| Market Concentration | Low |
Major Players *Disclaimer: Major Players sorted in no particular order Image © Mordor Intelligence. Reuse requires attribution under CC BY 4.0. | |
Washed Silica Sand Market Analysis by Mordor Intelligence
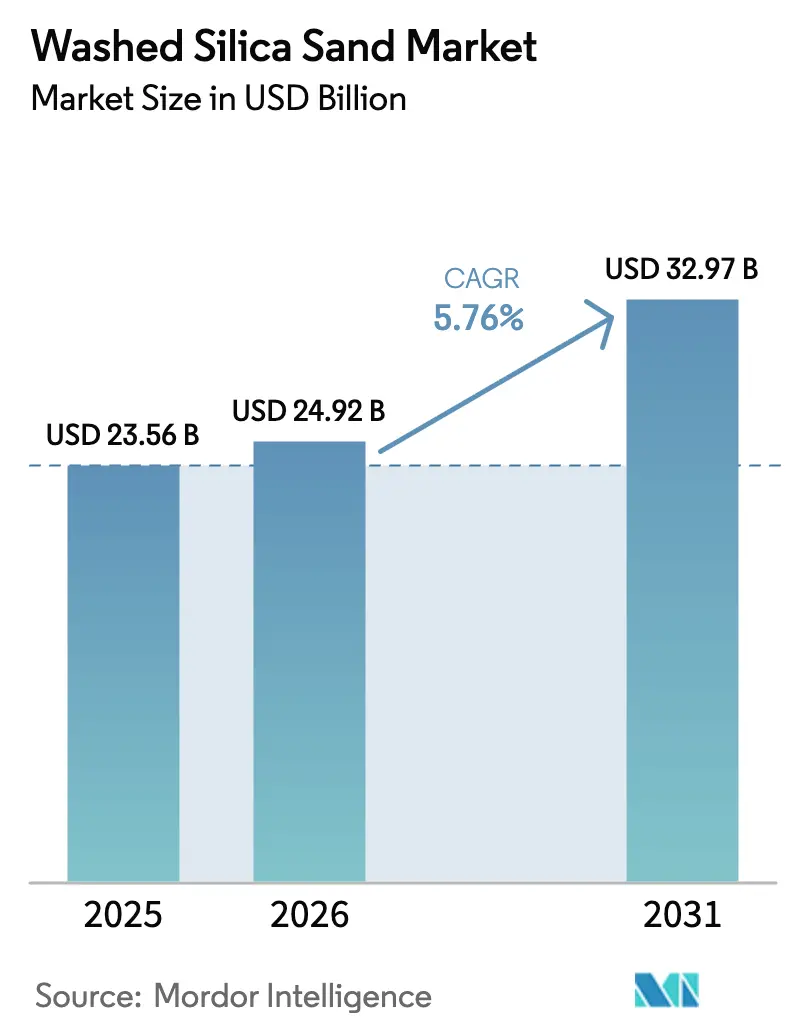
The Washed Silica Sand Market size is expected to grow from USD 23.56 billion in 2025 to USD 24.92 billion in 2026 and is forecast to reach USD 32.97 billion by 2031 at 5.76% CAGR over 2026-2031. Surging demand for ultra-high-purity quartz from semiconductor fabs, rising float-glass furnace capacity in Asia-Pacific, and the rapid build-out of in-basin wet-sand logistics in North America underpin the expansion of the washed silica sand market. Growing regional desalination projects are widening the addressable base for filtration-grade sand, while early sand-battery thermal storage pilots in Finland signal a new long-term use case. Supply risks remain elevated because Sibelco’s Spruce Pine complex alone delivers about 70% of global high-purity quartz (HPQ). Freight inflation and cullet substitution in mature glass markets temper growth but do not outweigh demand from solar, electronics, and shale completions.
Key Report Takeaways
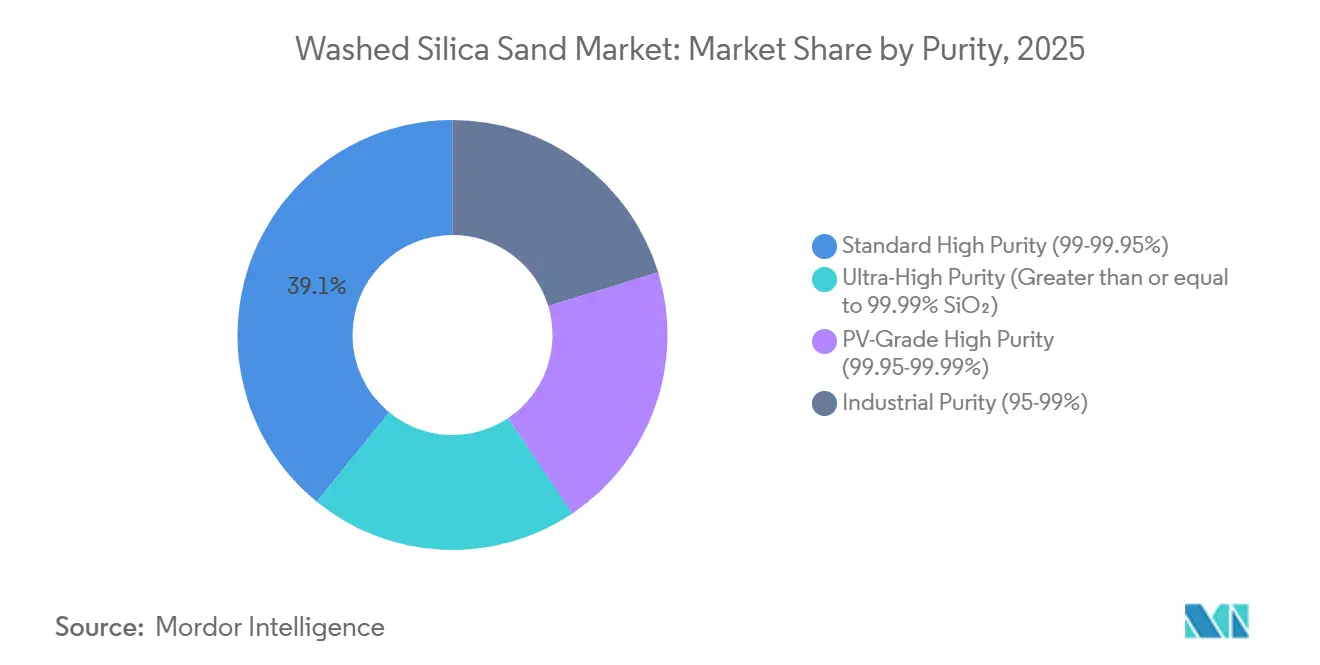
- By purity, standard high-purity grades (99-99.95% SiO₂) accounted for 39.12% share of the washed silica sand market size in 2025 and are forecast to expand at a 6.11% CAGR during the forecast period (2026-2031).
- By particle size, medium grades (355-710 µm) captured 37.11% revenue in 2025, whereas fine grades (150-355 µm) are poised for the quickest 6.21% CAGR during the forecast period (2026-2031).
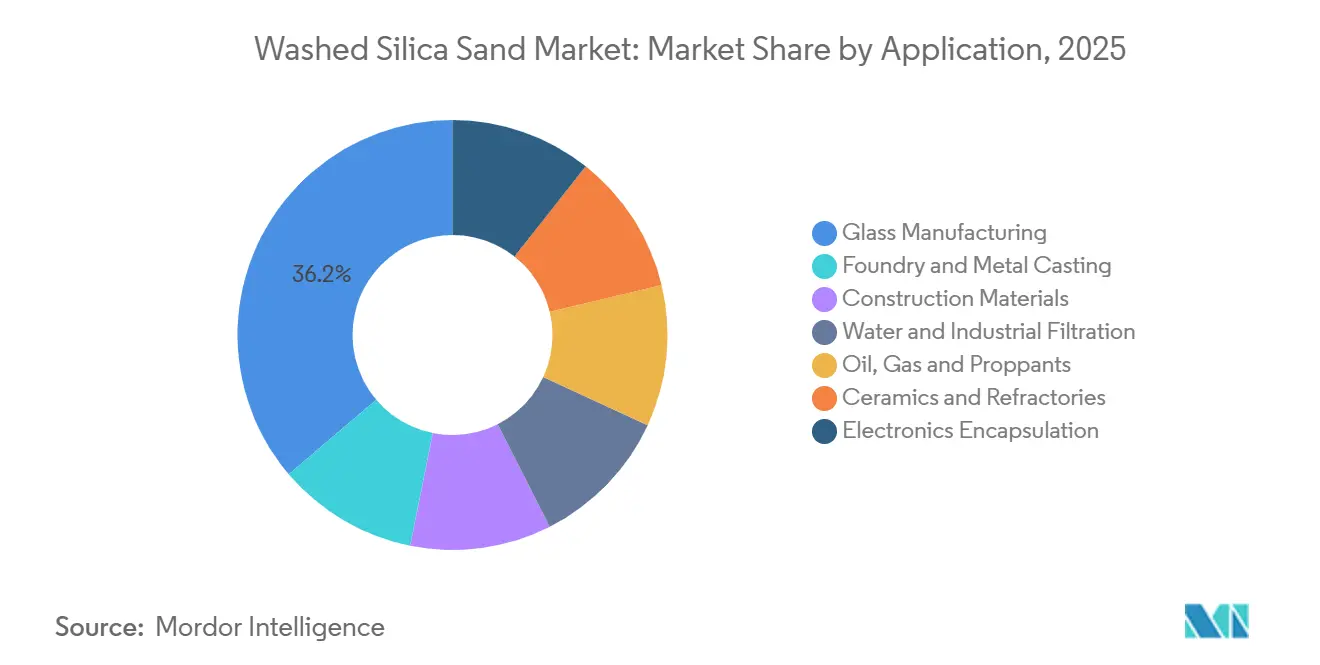
- By application, glass manufacturing led with 36.22% of the washed silica sand market share in 2025 and is advancing at a 6.14% CAGR through 2031.
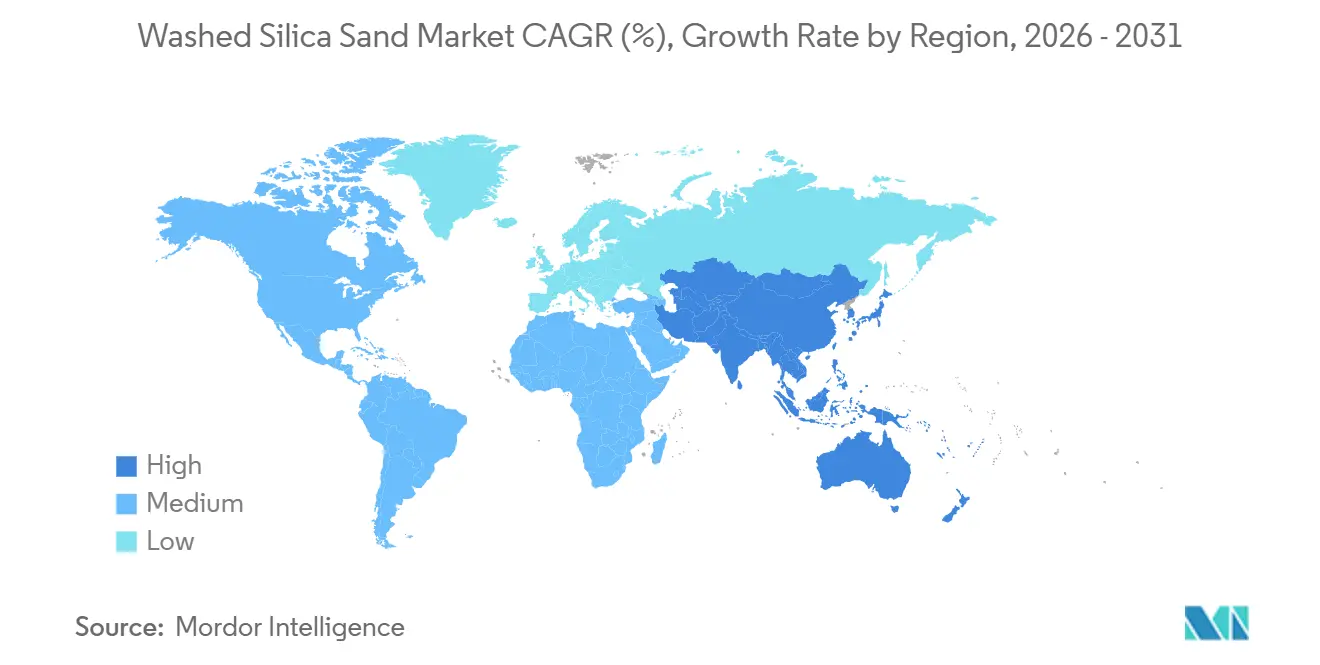
- By geography, Asia-Pacific commanded 46.78% of global revenue in 2025 and exhibits a leading 6.09% CAGR outlook to 2031.
Note: Market size and forecast figures in this report are generated using Mordor Intelligence’s proprietary estimation framework, updated with the latest available data and insights as of January 2026.
Global Washed Silica Sand Market Trends and Insights
Drivers Impact Analysis*
| Driver | (~) % Impact on CAGR Forecast | Geographic Relevance | Impact Timeline |
|---|---|---|---|
| Semiconductor fabs' ultra-pure quartz appetite | +1.2% | Global, concentrated in US (Spruce Pine), China silicon metal dominance | Long term (≥ 4 years) |
| Asia-Pacific float-glass furnace expansions | +1.4% | Asia-Pacific (China, India, ASEAN), UAE, Australia | Medium term (2-4 years) |
| Rise of in-basin wet-sand logistics (cost cuts) | +0.8% | North America (Permian Basin, Montney), localized to major shale plays | Short term (≤ 2 years) |
| Desalination boom in Middle-East and North America | +0.6% | Middle East (Saudi Arabia, UAE), North America (coastal states) | Medium term (2-4 years) |
| Sand-battery thermal storage pilots | +0.3% | Europe (Finland, Nordic region), early-stage global diffusion | Long term (≥ 4 years) |
| Source: Mordor Intelligence | |||
Semiconductor Fabs’ Ultra-Pure Quartz Appetite
HPQ output doubled at Spruce Pine following a USD 200 million expansion completed in 2025 and a USD 500 million second phase due for 2027, yet analysts still expect a 40-fold increase in demand by 2050 as chip fabs and solar ingot pullers escalate purity specifications to five-nines and beyond[1]Spruce Pine Mine, “Investment Press Release,” sibelco.com. China’s 85% share of global silicon metal and 95% dominance in polysilicon in 2025 accentuates OECD supply risk. Hurricane Helene’s 2024 disruption highlighted single-source vulnerability, spurring EU and US strategies to bring Norwegian and Portuguese quartz deposits online within three years. Sinova Global’s Tennessee silicon metal plant, under construction since 2025, provides a North American diversification pathway. Collectively, these moves keep semiconductor-grade quartz at the core of long-run demand for the washed silica sand market.
Asia-Pacific Float-Glass Furnace Expansions
Daily melt capacity in mainland China stood at 154,555 t in December 2025 across 216 operating lines, despite utilization sliding below 78% because of real-estate weakness. The Ministry of Industry and Information Technology now enforces a 1.25:1 replacement ratio on new lines, steering investment toward low-iron furnaces for BIPV and automotive glazing. Australia’s AUD 1.2 billion GlassKote project in Queensland will add 700 tons/day in early 2026, while a 1,000 tons per day sister plant is scheduled for the UAE by mid-2026[2]Glass International, “Asia-Pacific Float-Glass Projects,” glass-international.com. These projects create sustained off-take agreements for silica with Fe₂O₃ below 0.03 weight%. India and ASEAN players likewise scale solar glass capacity to meet domestic installation targets, reinforcing regional leadership in the washed silica sand market.
Rise of In-Basin Wet-Sand Logistics
Atlas Energy Solutions shipped 21.6 million short tons in 2025 via its 42-mile Dune Express conveyor, lowering last-mile trucking and cutting delivered cost by roughly USD 12/ton compared with rail imports. Distributed mobile wet-processing plants (OnCore) placed inside customer acreage trimmed weather-related downtime and improved proppant availability during peak completions. Chevron’s shift to fewer, high-volume wells tripled per-well sand intensity, cementing demand for 100-mesh grades with 10,000 psi crush strength. Competitors such as Badger Mining’s Fort St. John terminal enlargement added 275 railcar spots to support Montney operators, signaling that logistics innovation remains a near-term growth lever for the washed silica sand market.
Desalination Boom in Middle East & North America
Saudi Arabia’s Water Authority operates 11.3 million m³/day of capacity and oversees more than 10,000 km of new transmission pipelines slated by 2030, each requiring construction-grade silica backfill and filtration media. Reverse-osmosis plants source dual-media filters with uniformity coefficients below 1.6, pulling demand for washed silica sand of 0.8-1.2 mm size. North American coastal projects, though smaller, follow the same specification, expanding the customer base beyond traditional glass and proppant buyers. Product qualification cycles of 12-18 months embed long-term offtake stability once suppliers achieve NSF/ANSI 61 certification. Consequently, desalination augments steady-state consumption throughout the forecast window.
Restraints Impact Analysis*
| Restraint | (~) % Impact on CAGR Forecast | Geographic Relevance | Impact Timeline |
|---|---|---|---|
| Multimodal freight inflation (rail and bulk ships) | -0.9% | Global, acute in North America (rail), Asia-Pacific (bulk shipping) | Short term (≤ 2 years) |
| Cullet substitution in container glass | -0.7% | Europe (advanced sorting), North America (infrastructure gaps), Global | Medium term (2-4 years) |
| OSHA/MSHA crystalline-silica exposure capex | -0.4% | North America (US metal/nonmetal mines, coal operations) | Short term (≤ 2 years) |
| Source: Mordor Intelligence | |||
Multimodal Freight Inflation
Atlas Energy Solutions’ realized price declined to USD 21/ton in 2025, down 17% from 2024, even as shipped volumes rose 9%, highlighting freight’s drag on margins. Harsh 2026 winter storms cut EBITDA by USD 6 million because rail service stalled, underscoring seasonal exposure. On the ocean side, bulk charter rates rallied 28% year-on-year through Q1 2026 as bunker costs spiked, making long-haul exports less competitive. Delivered cost can double FOB prices once transport exceeds 100 km, incentivizing buyers to procure locally whenever possible. Capital-heavy conveyor belts and on-site wet-plants hedge this volatility but raise barriers to replication by mid-tier producers.
Cullet Substitution in Container Glass
Every 10% rise in cullet use trims the virgin silica needed by roughly 2-3% and lowers furnace energy by about 2%. European Union (EU) collection rates hit 80.8% in 2023, enabling an average recycled content of 53.55% across bottle plants. O-I’s French furnaces operated above 79% cullet in 2025, while Verallia UK reached 100% in select flint lines, eroding demand for ultra-low-iron sand. Strategic Materials’ 2 million tons per annum cullet network, acquired by Sibelco in 2024, accelerates North American recycling and positions virgin sand suppliers to capture value downstream rather than upstream. Nonetheless, color sensitivity and contamination keep cullet below 60% in many US furnaces, partially offsetting the substitution effect.
*Our forecasts treat driver/restraint impacts as directional, not additive. The impact forecasts reflect baseline growth, mix effects, and variable interactions.
Segment Analysis
By Purity: Ultra-High-Purity Grades Anchor Semiconductor Supply Chains
Ultra-high purity (greater than or equal to 99.99% SiO₂) volumes remain small but strategic because semiconductor polysilicon and quartz crucible makers require impurity thresholds below 50 ppm total metallics. Standard high-purity (99-99.95% SiO₂) retained 39.12% share in 2025, servicing float glass and foundry customers with 6.11% CAGR expected for the forecast period (2026-2031). Sibelco’s Spruce Pine complex doubled HPQ capacity in 2025 and will again by 2027, yet single-site risk remains pronounced, reinforcing calls for diversified European sources such as Norway’s Evje-Iveland pegmatite belt. Sinova Global’s reopened quarry and Tennessee smelter add domestic buffer capacity by 2028.
Intensive purification technologies, chlorination roasting, magnetic separation, and plasma arc treatment, push capital needs beyond USD 400/ton for incremental capacity, raising entry hurdles. Hurricane disruptions and geopolitical shocks, therefore, exert outsized price elasticity within this bracket. The washed silica sand market share controlled by the top three HPQ suppliers is projected to hold above 75% through 2031, underscoring oligopolistic dynamics in this slice of the value chain.


By Particle Size: Fine Grades Gain Traction in Foundry and Electronics
Medium grades of 355-710 µm delivered 37.11% revenue in 2025 and continue to dominate glass mixing and general construction blends owing to favorable permeability. Fines of 150-355 µm, however, are expected to advance at the fastest CAGR of 6.21% during the forecast period (2026-2031) because low-emission resin-coated sands cut hazardous air pollutants by over 41% while improving shake-out efficiency. Atlas’ 100-mesh wet sand surpasses 10,000 psi crush strength, supporting high-intensity hydraulic fracturing. Very fine (less than 150 µm) powders serve electronics encapsulation and specialty ceramics, commanding 20-25% price premiums.
Transition to ceramic foundry sand derived from bauxite is incremental, limited to precision steel castings owing to higher feed cost. Still, it exerts a subtle downforce on traditional silica volumes at the premium end. The washed silica sand market maintains its breadth by tailoring grain fineness to discrete end-use specs, thereby optimizing mix designs across diverse customer bases.
By Application: Glass Manufacturing Dominates Despite Cullet Headwinds
Glass accounted for 36.22% of global demand in 2025 and should progress at 6.14% CAGR during the forecast period (2026-2031) as architectural glazing, automotive safety glass, and solar float lines come online. Although cullet substitution trims virgin inputs in Europe, Asia-Pacific expansions and Middle-Eastern greenfield furnaces preserve absolute growth. Foundry and metal casting demand benefits from low-emission resin-coated formulations that reduce hazardous air pollutants by over 41% and improve core shakeout for aluminum casting, enabling elimination of post-bake heat-treat ovens and associated downtime.
Water and industrial filtration applications expand with desalination capacity projected to reach 89 million cubic meters per day by 2030, requiring multimedia filtration and rapid sand filtration for pretreatment in reverse osmosis plants. Construction materials, ceramics and refractories, and electronics encapsulation collectively serve niche segments with specialized particle size and purity requirements, while sand-battery thermal storage pilots consumed 2,000-2,400 tonnes per installation in Finland during 2025, signaling nascent demand for high-temperature thermal energy storage.
Geography Analysis
Asia-Pacific captured 46.78% of global revenue in 2025 with 6.09% CAGR projected through 2031. China’s 154,555 tons/day float-glass capacity, India’s massive infrastructure projects, and ASEAN’s solar supply chains anchor demand even as stricter MIIT replacement rules curb speculative builds. The UAE’s 1,000 tons/day low-iron float plant catalyzes Gulf consumption starting mid-2026. Japan and South Korea, lacking domestic HPQ, depend on U.S. and future EU supplies, adding geographic complexity to semiconductor quartz sourcing.
North America remains the second-largest cluster, buoyed by Permian Basin hydraulic fracturing. Atlas Energy Solutions alone moved 21.6 million tons in 2025, yet pricing slid 17% year-on-year, reflecting competitive logistics and flagging rig counts. Sibelco’s Spruce Pine dominates HPQ exports, but MSHA’s April 2026 compliance deadlines raise costs for smaller mines, pushing consolidation.
Europe shows tempered growth as high cullet ratios limit virgin demand. Finland’s sand-battery pilots, however, showcase emerging storage markets likely to lift northern European offtake from 2027 onward. Quarzwerke’s PV expansion at German sites cuts product carbon footprint by 25%, appealing to automotive and green-building buyers.
The Middle East and Africa combine strong desalination-led filtration needs with pipeline construction. South America remains fragmented, reliant on imports for high-purity grades but steady in construction aggregates.

Competitive Landscape
The washed silica sand market is fragmented. Small firms chase regional niches: Sinova Global is reviving North American quartz to counteract Spruce Pine risk, and Badger Mining plus TranSand upgraded the Fort St. John terminal for Montney shale. European players such as Quarzwerke invest in renewable on-site power to meet Scope 3 reduction mandates, differentiating on sustainability credentials. Barriers to entry rise with new MSHA (Mine Safety and Health Administration) dust-control rules, high-purity processing CAPEX, and customer qualification timelines, favoring incumbents that can amortize compliance over large throughput.
Washed Silica Sand Industry Leaders
Sibelco
U.S. Silica Holdings Inc.
Covia Holdings LLC
Badger Mining Corporation
VRX Silica
- *Disclaimer: Major Players sorted in no particular order

Recent Industry Developments
- December 2025: H.E. Minister of Industry and Mineral Resources announced an immediate halt on accepting applications for silica sand exploration licenses. The Ministry's competent authority thoroughly assessed the supply and demand dynamics of silica sand, ensuring its optimal industrial use. This could impact the washed silica sand market of Saudi Arabia.
- May 2024: Covia Holdings LLC acquired R.W. Sidley's Industrial Minerals Division, expanding its high-purity washed silica sand product portfolio for filtration, sports turf, and construction applications across North America.


Global Washed Silica Sand Market Report Scope
Washed silica sand is high-purity, processed silica cleaned to remove dust, clay, silt, and salt particles. It is mined sand subjected to a washing and screening process to create a consistent, clean material used in industrial applications requiring high precision and chemical stability, such as glass manufacturing, foundry casting, and water filtration.
The washed silica sand market is segmented by purity, particle size, application, and geography. By purity, the market is segmented into standard high purity (99-99.95%), ultra-high purity (greater than or equal to 99.99% sio₂), PV-grade high purity (99.95-99.99%), and industrial purity (95-99%). By particle size, the market is segmented into medium (355-710 µm), very coarse (greater than 1 mm), coarse (710-1000 µm), fine (150-355 µm), and very fine (less than 150 µm). By application, the market is segmented into glass manufacturing, foundry and metal casting, construction materials, water and industrial filtration, oil, gas, and proppants, ceramics and refractories, and electronics encapsulation. The report also covers the market size and forecasts for washed silica sand in 17 countries across major regions. The market sizes and forecasts are provided in terms of value (USD).
| Standard High Purity (99-99.95%) |
| Ultra-High Purity (Greater than or equal to 99.99% SiO₂) |
| PV-Grade High Purity (99.95-99.99%) |
| Industrial Purity (95-99%) |
| Medium (355-710 µm) |
| Very Coarse (Greater than 1 mm) |
| Coarse (710-1000 µm) |
| Fine (150-355 µm) |
| Very Fine (Less than 150 µm) |
| Glass Manufacturing |
| Foundry and Metal Casting |
| Construction Materials |
| Water and Industrial Filtration |
| Oil, Gas and Proppants |
| Ceramics and Refractories |
| Electronics Encapsulation |
| Asia-Pacific | China |
| Japan | |
| India | |
| South Korea | |
| ASEAN Countries | |
| Rest of Asia-Pacific | |
| North America | United States |
| Canada | |
| Mexico | |
| Europe | Germany |
| United Kingdom | |
| France | |
| Italy | |
| Spain | |
| Russia | |
| NORDIC Countries | |
| Rest of Europe | |
| South America | Brazil |
| Argentina | |
| Rest of South America | |
| Middle-East and Africa | Saudi Arabia |
| South Africa | |
| Rest of Middle-East and Africa |
| By Purity | Standard High Purity (99-99.95%) | |
| Ultra-High Purity (Greater than or equal to 99.99% SiO₂) | ||
| PV-Grade High Purity (99.95-99.99%) | ||
| Industrial Purity (95-99%) | ||
| By Particle Size | Medium (355-710 µm) | |
| Very Coarse (Greater than 1 mm) | ||
| Coarse (710-1000 µm) | ||
| Fine (150-355 µm) | ||
| Very Fine (Less than 150 µm) | ||
| By Application | Glass Manufacturing | |
| Foundry and Metal Casting | ||
| Construction Materials | ||
| Water and Industrial Filtration | ||
| Oil, Gas and Proppants | ||
| Ceramics and Refractories | ||
| Electronics Encapsulation | ||
| By Geography | Asia-Pacific | China |
| Japan | ||
| India | ||
| South Korea | ||
| ASEAN Countries | ||
| Rest of Asia-Pacific | ||
| North America | United States | |
| Canada | ||
| Mexico | ||
| Europe | Germany | |
| United Kingdom | ||
| France | ||
| Italy | ||
| Spain | ||
| Russia | ||
| NORDIC Countries | ||
| Rest of Europe | ||
| South America | Brazil | |
| Argentina | ||
| Rest of South America | ||
| Middle-East and Africa | Saudi Arabia | |
| South Africa | ||
| Rest of Middle-East and Africa | ||


Key Questions Answered in the Report
What CAGR is projected for the washed silica sand market through 2031?
The washed silica sand market is forecast to advance at a CAGR of 5.76% between 2026-2031.
Which region contributes most to demand?
Asia-Pacific held 46.78% of 2025 revenue and leads growth at a 6.09% CAGR.
Why is ultra-high-purity quartz strategically important?
Semiconductor polysilicon and crucible makers need five-nines purity, and current supply is largely tied to one mine in North Carolina.
How is logistics innovation influencing U.S. proppant supply?
In-basin wet-sand processing and a 42-mile conveyor cut last-mile trucking costs by about USD 12/ton.
What is the market size of washed silica sand market?
The Washed Silica Sand Market size is expected to grow from USD 23.56 billion in 2025 to USD 24.92 billion in 2026 and is forecast to reach USD 32.97 billion by 2031 at 5.76% CAGR over 2026-2031.
Page last updated on:


