Market Overview
| Study Period | 2020 - 2031 |
|---|---|
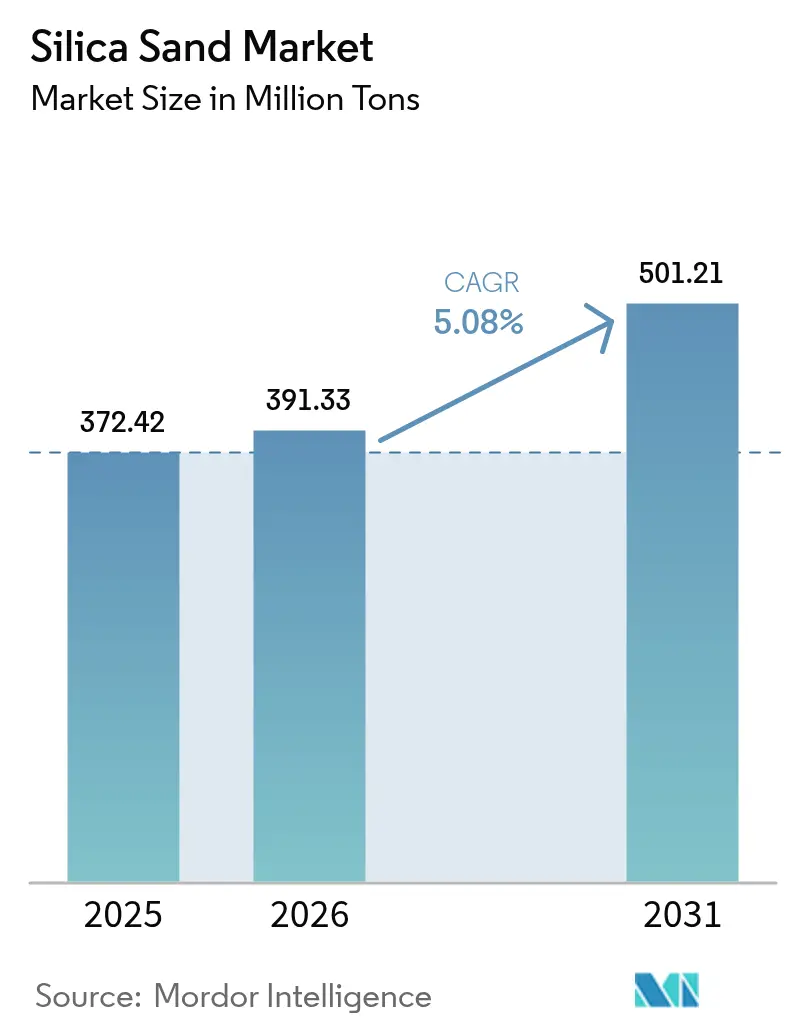
| Market Volume (2026) | 391.33 Million tons |
| Market Volume (2031) | 501.21 Million tons |
| Growth Rate (2026 - 2031) | 5.08% CAGR |
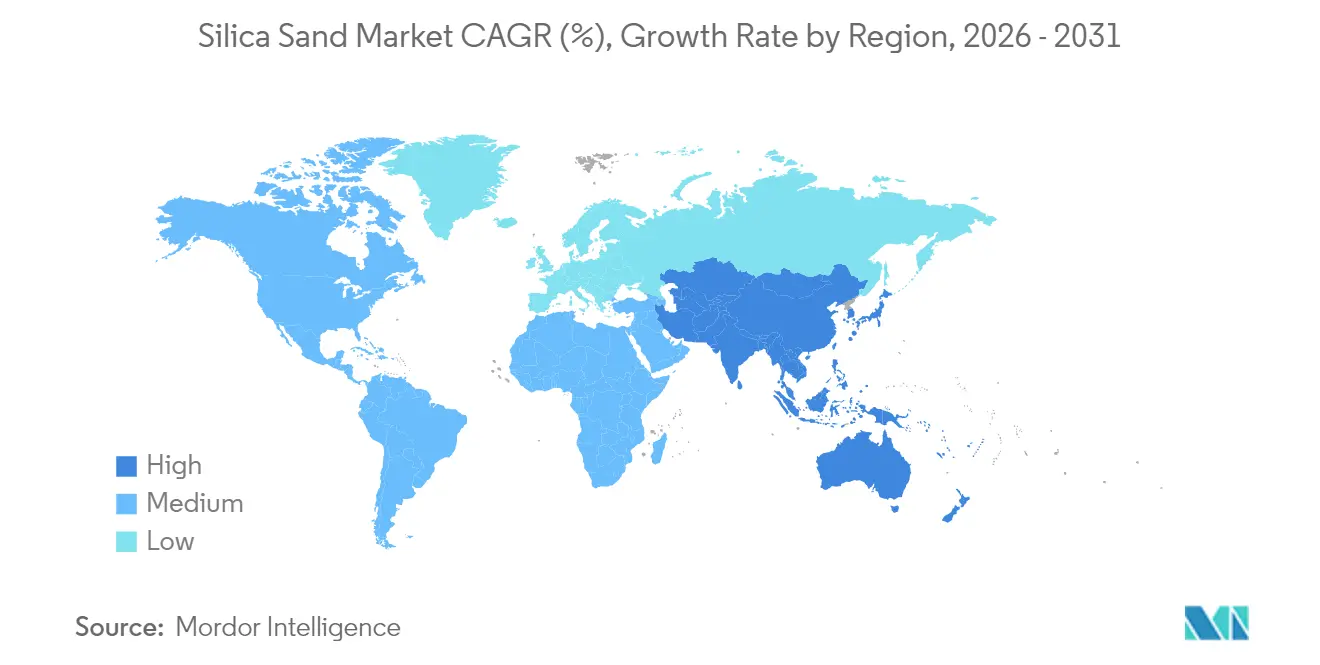
| Fastest Growing Market | Asia Pacific |
| Largest Market | Asia Pacific |
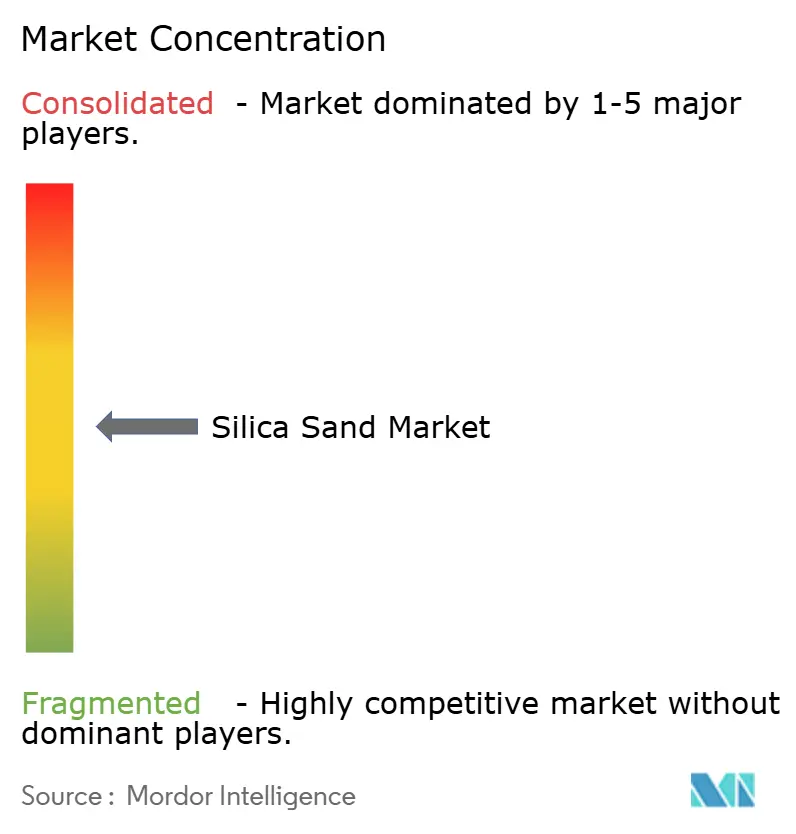
| Market Concentration | Medium |
Major Players *Disclaimer: Major Players sorted in no particular order Image © Mordor Intelligence. Reuse requires attribution under CC BY 4.0. | |
Silica Sand Market Analysis by Mordor Intelligence
The Silica Sand market size is expected to grow from 372.42 Million tons in 2025 to 391.33 Million tons in 2026 and is forecast to reach 501.21 Million tons by 2031 at 5.08% CAGR over 2026-2031. The upward trajectory is tied to the central role the mineral plays in high-purity glass, semiconductor wafers, hydraulic fracturing proppants, and a wide array of industrial fillers. Price premiums for ultra-clear solar glass, persistent growth in shale well counts, and the spread of semiconductor fabs into new regions are together sustaining demand even as environmental regulations tighten. Supply chains are gradually localizing, with in-basin mines and downstream alliances offsetting logistics costs and minimizing exposure to permitting delays. Competitive differentiation is increasingly anchored in quality certification, dust-mitigation technology, and traceability systems that help buyers manage health-and-safety compliance.
Key Report Takeaways
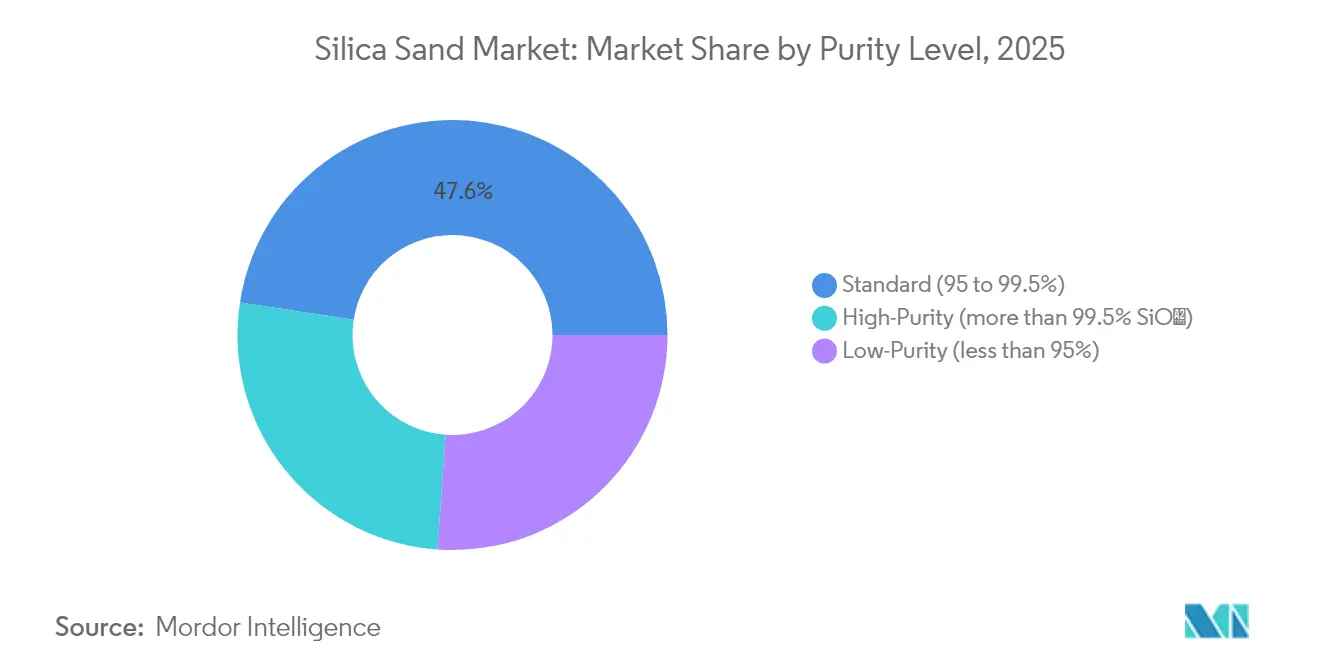
- By purity level, standard-grade silica held 47.58% of the silica sand market share in 2025, while high-purity grades are advancing at a 6.19% CAGR through 2031.
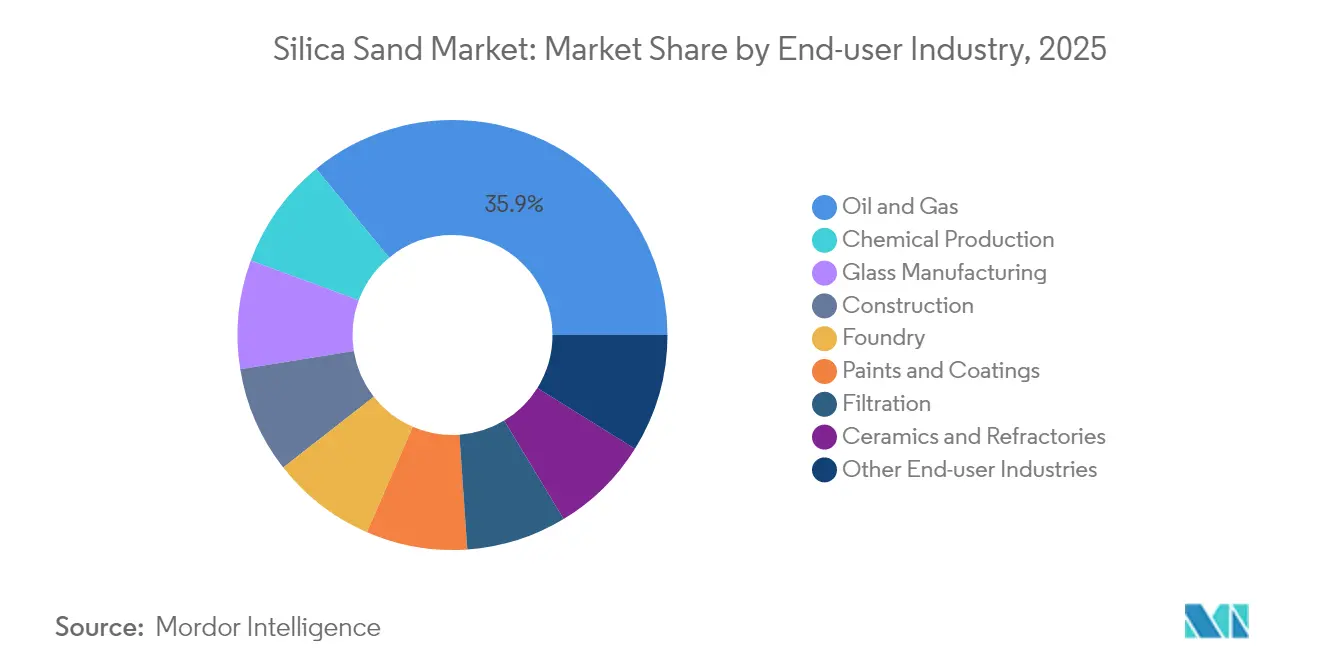
- By end-user industry, oil and gas accounted for a 35.92% share of the silica sand market size in 2025; chemical production is projected to expand at a 5.32% CAGR to 2031.
- By geography, Asia-Pacific captured 40.21% revenue in silica sand market 2025 and is growing at a 6.27% CAGR through 2031.
Note: Market size and forecast figures in this report are generated using Mordor Intelligence’s proprietary estimation framework, updated with the latest available data and insights as of 2026.
Global Silica Sand Market Trends and Insights
Drivers Impact Analysis*
| Drivers | (~) % Impact on CAGR Forecast | Geographic Relevance | Impact Timeline |
|---|---|---|---|
| Rising demand for premium-clarity flat and solar glass | +1.2% | Global, concentrated in APAC | Medium term (2-4 years) |
| Surging frac-sand intensity per shale well | +0.9% | North America, expanding to South America | Short term (≤ 2 years) |
| Growth in high-purity silica for semiconductor fabs | +0.8% | Global, led by APAC and North America | Long term (≥ 4 years) |
| Infrastructure stimulus-led concrete consumption | +0.7% | Global, emphasis on emerging markets | Medium term (2-4 years) |
| AI-driven foundry process optimisation | +0.4% | North America and Europe | Long term (≥ 4 years) |
| Source: Mordor Intelligence | |||
Rising Demand for Premium-Clarity Flat and Solar Glass
Solar-grade glass plants require feedstock exceeding 99.99% SiO₂, pushing spot prices toward USD 55 per ton as China’s photovoltaic capacity additions tighten availability for conventional float glass lines. Canadian Premium Sand and other entrants plan vertically integrated furnaces to satisfy more than 100 GW of panel output by 2027. Multinational float-glass makers have earmarked close to USD 180 million for furnace retrofits that boost energy efficiency while locking in long-term offtake contracts for high-purity sand, underscoring trends in the silica sand market. These capital commitments confirm that premium silica will remain a supply-critical input while manufacturers pursue low-carbon glass production techniques certified under ISO 9001 standards.
Surging Frac-Sand Intensity per Shale Well
Individual horizontal wells now average 1,060% more sand than in 2013, driven by longer laterals and higher stage counts. Wet-sand logistics cut diesel usage by 90% and shave USD 100,000–300,000 per well, accelerating the switch to in-basin brown sand that reduces delivered-cost volatility. OSHA respirable-silica rules are spurring adoption of new dust-capture hoods and enclosed conveyors trends in the silica sand market locking in specification-driven procurement that favors certified suppliers.
Growth in High-Purity Silica for Semiconductor Fabs
China declared high-purity quartz its 174th strategic mineral in April 2025, underpinning exploration in Henan and Xinjiang for ore capable of 5N purity. Hurricane Helene’s disruption of Spruce Pine underscored supply fragility and led to a USD 200 million capacity-doubling project by Sibelco in North Carolina. Indonesia’s silica downstream policy targets USD 45.74 billion in new investment by 2040, aiming to lift domestic wafer output and create 200,000 skilled jobs. Advanced acid-leach and thermal-upgrade lines governed by ISO 13503-2 are now mandatory to meet the 99.995% threshold required for 3 nm etch-stop layers.
Infrastructure Stimulus-Led Concrete Consumption
The USD 1.2 trillion Infrastructure Investment and Jobs Act is projected to lift U.S. cement demand by 46 million tons over five years, supporting broad-based sand offtake across readymix and precast segments. Supplementary cementitious materials blended with silica are gaining favor as firms chase lower embodied-carbon targets laid out in Global Cement and Concrete Association guidelines. Supply bottlenecks in river sand for dredging projects are pushing engineers toward manufactured silica aggregates that meet ASTM C33 gradations, bolstering the silica sand market.
Restraints Impact Analysis*
| Restraints | (~) % Impact on CAGR Forecast | Geographic Relevance | Impact Timeline |
|---|---|---|---|
| Escalating environmental permitting hurdles | -0.8% | Global, concentrated in developed markets | Medium term (2-4 years) |
| Rapid substitution by recycled cullet in container glass | -0.5% | Europe and North America | Short term (≤ 2 years) |
| Emerging low-quartz proppants (ceramics, resin-coated) | -0.3% | North America, expanding to global markets | Long term (≥ 4 years) |
| Source: Mordor Intelligence | |||
Escalating Environmental Permitting Hurdles
The MSHA silica rule that took effect in June 2024 lowered permissible exposure to 50 µg/m³ and added mandatory medical surveillance, raising compliance costs for both new and legacy pits. In Manitoba, Sio Silica’s proposed mine remains stalled after regulators called for a deeper hydro-geological review. European Chemicals Agency drafts signal tighter workplace exposure requirements that could cut output at smaller quarries lacking enclosed processing circuits. The higher hurdle rate is expected to curtail grassroots projects and concentrate production among operators with full ESG reporting frameworks.
Rapid Substitution by Recycled Cullet in Container Glass
European glass plants have raised average cullet ratios above 60%, trimming furnace energy by nearly 3% per 10-point increase while lowering CO₂ intensity under ETS allowances. Sibelco’s string of acquisitions in glass recycling is widening access to post-consumer scrap and tightening virgin sand demand. Advances in optical sorting lift throughput and purity, enabling thicker-wall returnable bottles that tolerate higher cullet loads. Although food-contact regulations cap impurities, the shift still shaves about 0.5% from the silica sand market CAGR forecast for container glass.
*Our forecasts treat driver/restraint impacts as directional, not additive. The impact forecasts reflect baseline growth, mix effects, and variable interactions.
Segment Analysis
By Purity Level: High-Purity Grades Outpace Bulk Volumes
High-purity grades above 99.5% SiO₂ account for 6.19% CAGR, the fastest within the silica sand market. Ultra-pure sand provides the substrate for semiconductor crucibles, solar float glass, and lithium-ion battery separators. Sibelc o’s Spruce Pine expansion and Australian Silica Quartz Group’s push to 99.997% purity illustrate the scale-up of value-added capacity.
Standard-grade material ranging from 95–99.5% SiO₂ remains the volume anchor, holding 47.58% of the 2025 silica sand market share. Demand stems from foundry molds, construction aggregates, and filter media. Innovations such as iron-ore tailings purification that lifts rejects to 99.99% purity blend sustainability with revenue upside, though low-purity sand below 95% SiO₂ is largely restricted to local ready-mix and backfill usage.


By End-User Industry: Chemicals Narrow the Gap with Oil and Gas
Oil and gas keep the lead at 35.92% of 2025 demand, as the silica sand market size continues to shadow horizontal rig counts. In-basin sourcing and dust-control standards keep usage resilient even when West Texas Intermediate prices swing. Wet-sand adoption also tempers cost inflation, maintaining the segment’s gross-margin attractiveness for integrated miners.
Chemical production, however, is slated for the fastest pace at 5.32% CAGR as sodium silicate, colloidal silica, and fumed silica plants scale to serve batteries, catalysts, and personal-care formulations. Nouryon’s 50% hike in Levasil capacity, alongside Evonik’s Charleston expansion, underlines the strategic repositioning toward specialty chemistries that carry EBIT margins above bulk industrial levels. Glass, foundry, ceramics, and filtration round out the demand stack, each benefiting from incremental engineering tweaks that require tighter particle-size controls and purity specs.
Geography Analysis
Asia-Pacific commands 40.21% of global volume and is projected to grow at a 6.27% CAGR, driven by China’s photovoltaic boom, India’s urban transport corridors, and Indonesia’s USD 45.74 billion silicon-downstream agenda. Australia’s Cape Flattery mine, grading 99.93% SiO₂, positions Queensland to triple output before 2030.
North America’s consumption is propelled by shale proppant at the core. The United States exported USD 809 million worth of silica sand during 2024–2025, with Canada and Japan the top buyers. The Mexico silica sand market continues to benefit from the country's expanding manufacturing sector, with imports supported by USMCA trade relationships and proximity to U.S. suppliers. The region's regulatory environment intensifies with new MSHA silica rules effective June 2024, requiring comprehensive exposure monitoring and medical surveillance programs.
Europe faces challenging conditions in silica sand industry with construction demand slowdowns affecting traditional silica sand applications, though specialized segments maintain growth momentum. The European Chemicals Agency’s draft exposure limits may concentrate supply in Northern Europe where enclosed processing is already standard. Middle East and Africa draw on infrastructure projects and glass container demand, while South America’s allure lies in automotive supply-chain shifts and new critical-minerals policies.

Competitive Landscape
The field in silica sand industry exhibits moderate fragmentation. Apollo Global’s USD 1.85 billion take-private of U.S. Silica underscores private-equity confidence in predictable cash flows and diversified end-markets. Technological differentiation is evident: in-field wet-sand plants cut emissions 90%, ceramic-lined hydro-classifiers extend equipment life, and AI-based image analyzers adjust particle distribution in real time to slash defect rates in foundries. Environmental compliance is now a market entry cost, as MSHA and ECHA align on stricter exposure caps. Producers meeting ISO 9001 and ISO 45001 will likely gain share when multinationals re-tender supply agreements for 2026-2028.
Silica Sand Industry Leaders
Badger Mining Corporation
COVIA HOLDINGS LLC
Atlas Energy Solutions Inc. (Hi-Crush Inc.)
Sibelco
U.S. Silica (Apollo Global Management)
- *Disclaimer: Major Players sorted in no particular order

Recent Industry Developments
- December 2024: Xinyi Solar and Xinyi Glass have renewed their silica sand agreement for January 1 to December 31, 2025. A Xinyi Solar subsidiary will continue supplying silica sand to the XYG Group for float glass production.
- April 2023: Apollo Global Management completed a USD 1.85 billion acquisition of U.S. Silica Holdings, transitioning the proppant leader to private ownership.


Global Silica Sand Market Report Scope
Silica sand is a type of sand with high silicon dioxide (SiO2) content. It is a naturally occurring material that is found in many parts of the world. Silica sand is used in a variety of applications, including glassmaking, foundries, and fracking, among others.
The silica sand market is segmented by end-user industry and geography. By end-user industry, the market is segmented into glass manufacturing, foundry, chemical production, construction, paints and coatings, ceramics and refractories, filtration, oil and gas, and other end-user industries. The report also covers the market size and forecasts for the silica sand market in 15 countries across major regions. For each segment, market sizing and forecasts are done in volume (tons).
By Purity Level
| High-Purity (more than 99.5% SiO₂) |
| Standard (95 to 99.5%) |
| Low-Purity (less than 95%) |
By End-user Industry
| Glass Manufacturing |
| Foundry |
| Chemical Production |
| Construction |
| Paints and Coatings |
| Ceramics and Refractories |
| Filtration |
| Oil and Gas |
| Other End-user Industries |
By Geography
| Asia-Pacific | China |
| India | |
| Japan | |
| South Korea | |
| Indonesia | |
| Australia | |
| Rest of Asia-Pacific | |
| North America | United States |
| Canada | |
| Mexico | |
| Europe | Germany |
| United Kingdom | |
| Italy | |
| France | |
| Russia | |
| Rest of Europe | |
| South America | Brazil |
| Argentina | |
| Rest of South America | |
| Middle-East and Africa | Saudi Arabia |
| United Arab Emirates | |
| South Africa | |
| Rest of Middle-East and Africa |
| By Purity Level | High-Purity (more than 99.5% SiO₂) | |
| Standard (95 to 99.5%) | ||
| Low-Purity (less than 95%) | ||
| By End-user Industry | Glass Manufacturing | |
| Foundry | ||
| Chemical Production | ||
| Construction | ||
| Paints and Coatings | ||
| Ceramics and Refractories | ||
| Filtration | ||
| Oil and Gas | ||
| Other End-user Industries | ||
| By Geography | Asia-Pacific | China |
| India | ||
| Japan | ||
| South Korea | ||
| Indonesia | ||
| Australia | ||
| Rest of Asia-Pacific | ||
| North America | United States | |
| Canada | ||
| Mexico | ||
| Europe | Germany | |
| United Kingdom | ||
| Italy | ||
| France | ||
| Russia | ||
| Rest of Europe | ||
| South America | Brazil | |
| Argentina | ||
| Rest of South America | ||
| Middle-East and Africa | Saudi Arabia | |
| United Arab Emirates | ||
| South Africa | ||
| Rest of Middle-East and Africa | ||


Key Questions Answered in the Report
What is the current volume of the silica sand market and its expected growth rate?
The silica sand market stands at 391.33 million tons in 2026 and is forecast to reach 501.21 million tons by 2031, delivering a 5.08% CAGR.
Which region leads global consumption of silica sand?
Asia-Pacific commands 40.21% of 2025 demand and is also the fastest-growing region at a 6.27% CAGR through 2031.
Which end-user segment is expanding fastest in silica sand demand?
Chemical production exhibits the highest growth, with a 5.32% CAGR expected between 2026 and 2031 as sodium silicate and specialty silica plants scale.
Why is high-purity silica gaining strategic importance?
Ultra-pure grades are essential for solar glass and semiconductor crucibles, and capacity expansions in North America, Australia, and China aim to meet stringent 99.995% SiO? requirements.
How are new environmental regulations affecting silica sand mining?
Lower exposure limits under MSHA and proposed ECHA rules are raising compliance costs and elongating permit timelines, which could favor miners with advanced dust-control systems and ISO-certified processes.
Page last updated on:


