Market Overview
| Study Period | 2021 - 2031 |
|---|---|
| Forecast Data Period | 2026 - 2031 |
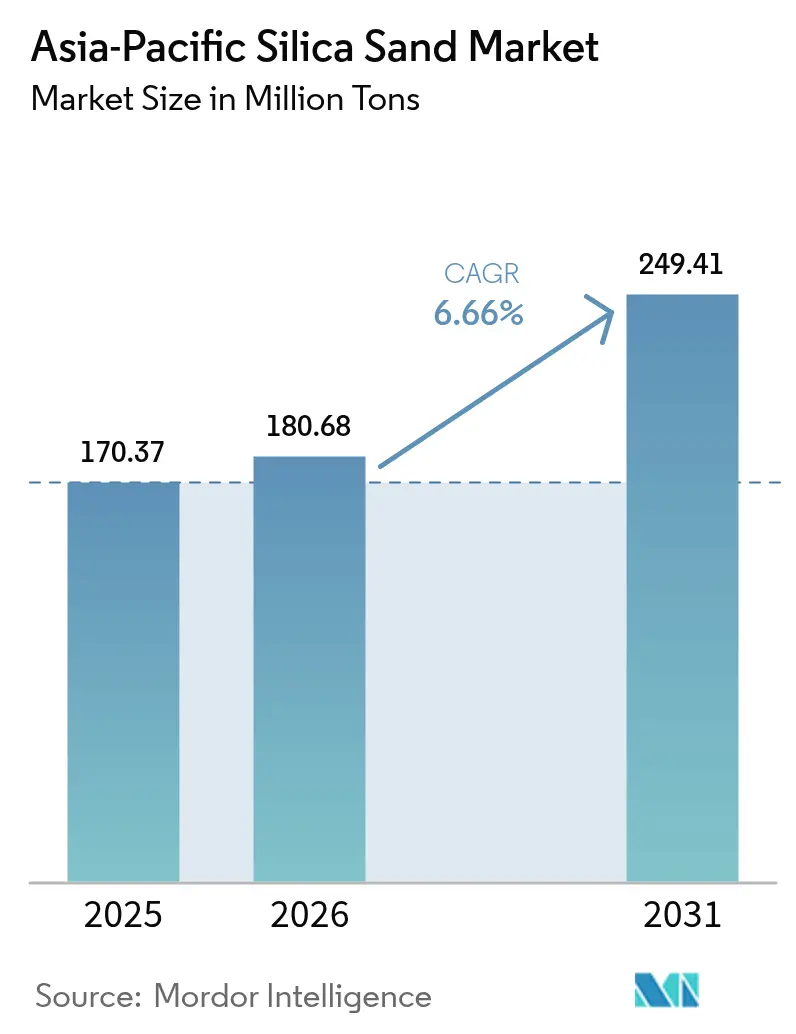
| Base Year Market Size (2025) | 170.37 Million tons |
| Market Volume (2026) | 180.68 Million tons |
| Market Volume (2031) | 249.41 Million tons |
| Growth Rate (2026 - 2031) | 6.66% CAGR |
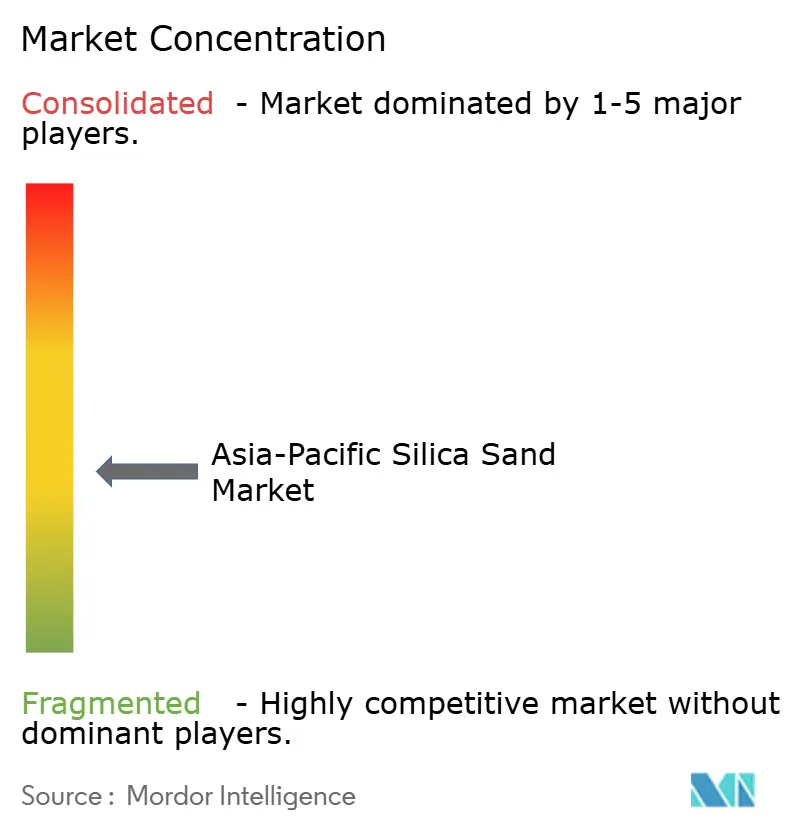
| Market Concentration | Medium |
Major Players *Disclaimer: Major Players sorted in no particular order Image © Mordor Intelligence. Reuse requires attribution under CC BY 4.0. | |
Asia-Pacific Silica Sand Market Analysis by Mordor Intelligence
The Asia-Pacific Silica Sand Market size was valued at 170.37 Million tons in 2025 and is estimated to grow from 180.68 Million tons in 2026 to reach 249.41 Million tons by 2031, at a CAGR of 6.66% during the forecast period (2026-2031). This expansion rests on four pillars: surging solar-glass capacity additions, semiconductor fabrication growth, infrastructure-led construction, and the rapid formalization of sand-mining rules across India, Indonesia, Vietnam, and the Philippines. China remains the gravitational center of the Asia-Pacific silica sand market because its solar-glass furnaces consume ultra-low-iron feedstock in volumes unmatched elsewhere. India stands out as the fastest-growing major geography, propelled by the National Infrastructure Pipeline and by domestic module-glass investments that require captive silica supply. Regulatory scrutiny is trimming informal river-sand extraction throughout ASEAN, pushing buyers toward licensed miners who invest in beneficiation, flotation, and magnetic-separation circuits to achieve sub-150-ppm iron content demanded by modern glass plants. Integrated producers that lock in long-term leases and environmental permits are therefore capturing margin across mining, processing, and logistics.
Key Report Takeaways
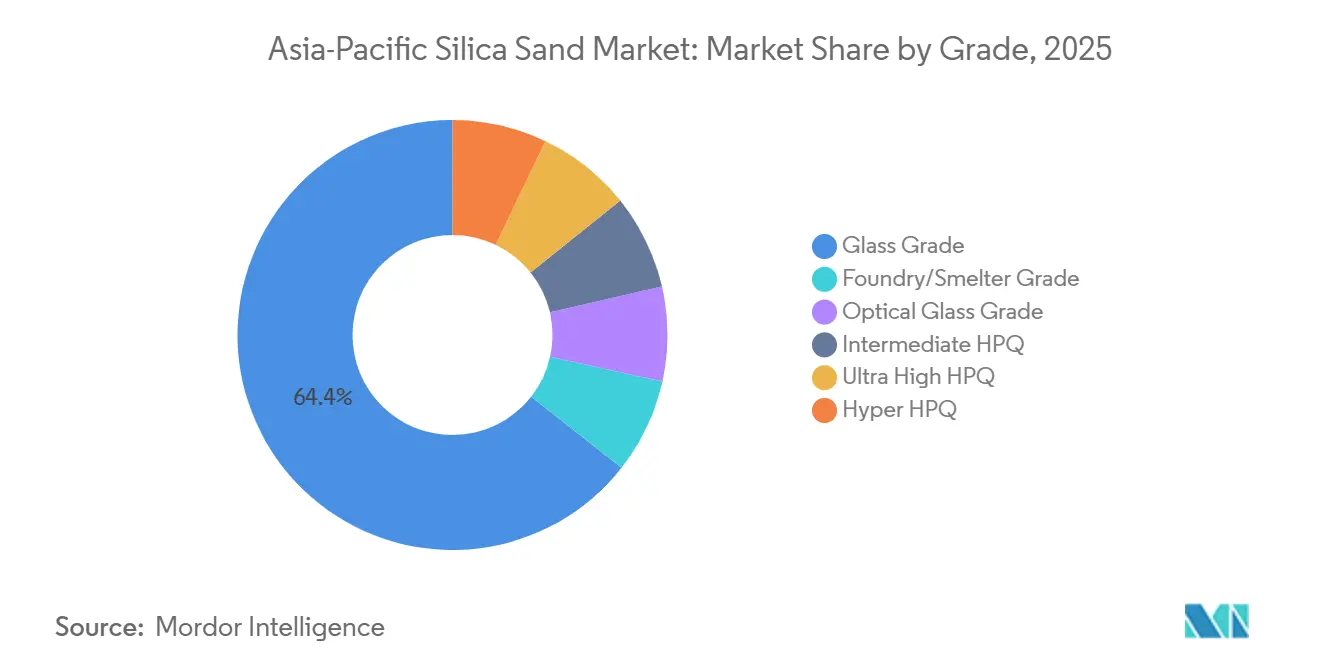
- By grade, glass grade held 64.41% of the Asia-Pacific silica sand market share in 2025, while hyper HPQ is projected to post the fastest 11.32% CAGR through 2031.
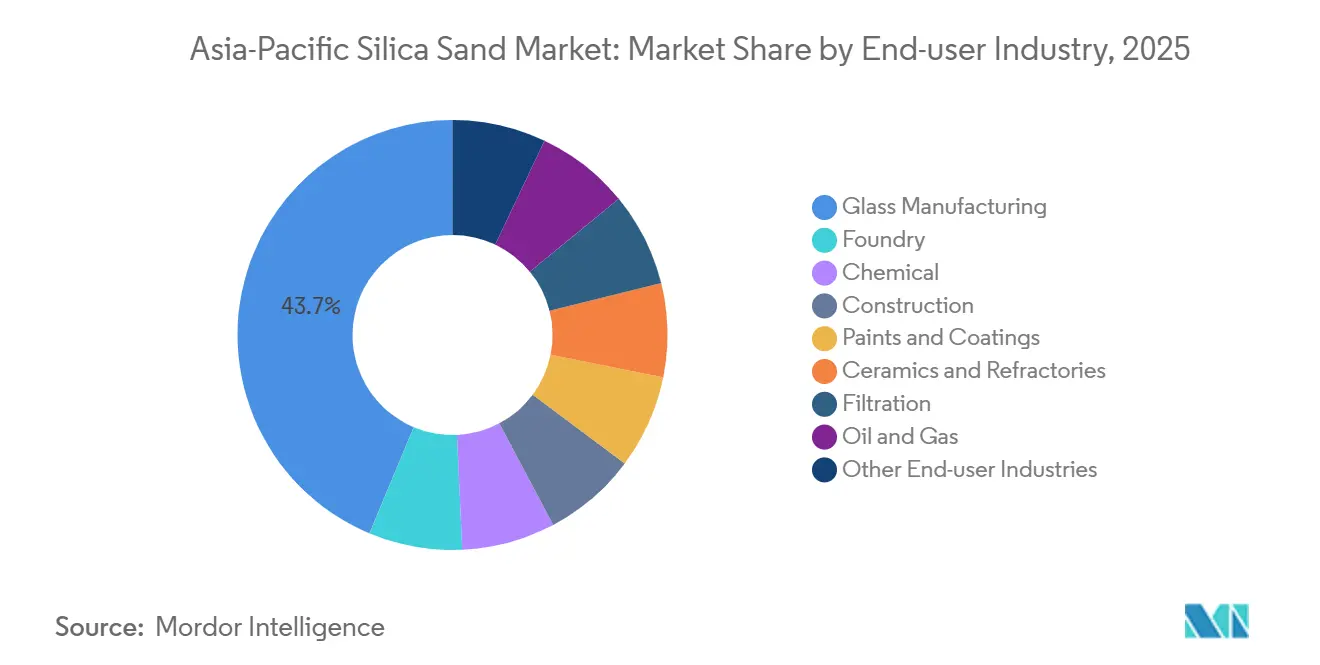
- By end-use industry, glass manufacturing commanded 43.69% of the Asia-Pacific silica sand market share in 2025 and is poised to expand at a 7.44% CAGR to 2031.
- By geography, China accounted for 73.75% of the Asia-Pacific silica sand market size in 2025, whereas India is advancing at an 8.59% CAGR to 2031.
Note: Market size and forecast figures in this report are generated using Mordor Intelligence’s proprietary estimation framework, updated with the latest available data and insights as of 2026.
Asia-Pacific Silica Sand Market Trends and Insights
Drivers Impact Analysis*
| Driver | (~) % Impact on CAGR Forecast | Geographic Relevance | Impact Timeline |
|---|---|---|---|
| Construction-led flat and container glass demand surge | +1.8% | China, India, ASEAN (Indonesia, Vietnam, Thailand, Philippines) | Medium term (2-4 years) |
| Rapid infrastructure spending across ASEAN countries | +1.5% | ASEAN core (Indonesia, Thailand, Vietnam, Malaysia, Philippines) | Long term (≥4 years) |
| Foundry revival for EV and wind-power castings | +1.2% | China, India, Japan, South Korea | Medium term (2-4 years) |
| Shift to energy-efficient low-iron solar glass | +1.4% | China dominant, spill-over to India, Malaysia, Vietnam | Short term (≤2 years) |
| Data-center boom: immersion-cooling and thermal-storage grade HP-silica | +0.9% | Singapore, Japan, India, China (tier-1 cities) | Long term (≥4 years) |
| Source: Mordor Intelligence | |||


Construction-Led Flat and Container Glass Demand Surge
Flat-glass requirements for skylights, curtain walls, and energy-efficient façades are accelerating across India, Indonesia, Vietnam, and the Philippines as urban rail, airport, and smart-city projects advance. India alone expects flat-glass consumption to top 800 million square meters by 2027 under its Housing for All and Smart Cities programs. Because silica constitutes 60-70% of a float-glass batch, proximity to clean feedstock now dictates furnace siting, leading Thai container-glass makers to secure multi-year supply contracts with integrated silica miners in Chonburi and Rayong. Within ASEAN, more than a dozen metro systems and 18 airport expansions scheduled before 2030 will funnel additional demand into architectural glass, reinforcing the Asia-Pacific silica sand market as the world’s most dynamic glass-grade hub.
Rapid Infrastructure Spending Across ASEAN Countries
ASEAN governments allocated USD 13.2 billion to transport corridors, grid upgrades, and municipal water treatment in the first half of 2024, all of which embed silica sand as fine aggregate in concrete and asphalt. Indonesia’s Nusantara capital-city build alone is forecast to consume 50 million cubic meters of sand this decade, intensifying enforcement against illegal dredging in the Java Sea. Vietnam’s North-South Expressway requires tight gradation control to satisfy long-life pavement standards, steering contractors toward certified quarries that supply washed and size-classified material. The outcome is a consolidation of demand around compliant operators, deepening vertical integration and reinforcing the Asia-Pacific silica sand market as a strategic raw-material backbone for the region’s infrastructure ambitions.
Foundry Revival for EV and Wind-Power Castings
Asia produced 14.2 million electric vehicles in 2024, and their lightweight drivetrain housings rely on aluminum and magnesium cast in silica-based molds that deliver precise cavities and superior surface finish. Wind-turbine components for 5+ MW nacelles demand equally high-silica content and low clay to suppress mold defects. India’s foundry sector consumed roughly 4.5 million tons of foundry sand in 2024, with suppliers upgrading washing circuits and refractory test labs to meet stricter automotive and turbine specifications. The transition from internal combustion to electric powertrains therefore lifts demand for premium foundry grades, supporting the value-shift already evident in the Asia-Pacific silica sand market.
Shift to Energy-Efficient Low-Iron Solar Glass
Solar-module makers now specify glass with less than 120 ppm Fe₂O₃ to maximize photon transmission, eliminating many conventional deposits from consideration. China’s solar-glass capacity exceeded 18 million tons per year in 2024, dominated by Xinyi Solar, Flat Glass Group, and CSG Holding, which collectively export low-iron sheets to India and Vietnam. The International Energy Agency forecasts 500 GW of annual solar installations by 2028, translating into a call for 15-18 million tons of premium silica feedstock. Beneficiation specialists that master magnetic separation and acid leaching to reach sub-150 ppm iron now command premium pricing and drive qualitative change across the Asia-Pacific silica sand market[1]Asian Development Bank, “Meeting Asia’s Infrastructure Needs,” adb.org .
Restraints Impact Analysis*
| Restraint | (~) % Impact on CAGR Forecast | Geographic Relevance | Impact Timeline |
|---|---|---|---|
| Illegal and unregulated sand-mining curbs | -1.3% | India, Indonesia, Vietnam, Philippines, localized in China | Short term (≤2 years) |
| Substitution by engineered sand-free building materials | -0.7% | India, China (urban centers), early adoption in Singapore | Medium term (2-4 years) |
| Govt-led consolidation of small mines | -0.5% | China, India (state-level enforcement) | Long term (≥4 years) |
| Source: Mordor Intelligence | |||
Illegal and Unregulated Sand Mining Curbs
India’s Supreme Court imposed a nationwide ban on unauthorized river-sand extraction in 2024, redirecting demand toward licensed quarries and boosting landed costs for contractors. Indonesia intensified patrols in the Riau Archipelago, Vietnam canceled 47 licenses, and the Philippines suspended extraction across 12 provinces. As coastal mining faces tighter environmental scrutiny, buyers source inland or import from Australia and Malaysia, raising freight costs yet accelerating formalization across the Asia-Pacific silica sand market[2]International Energy Agency, “Renewables 2025,” iea.org .
Substitution by Engineered Sand-Free Building Materials
Manufactured sand, now 25-30% of aggregate demand in India and up to 20% in China, wins share on the back of river-sand scarcity and updated construction codes. India’s IS 383:2024 standard legitimizes M-sand in structural concrete, while Chinese precast producers trial geopolymer cements that reduce virgin fine-aggregate loads. Although crusher fines lack the purity for glass or foundry use, their penetration into low-grade construction segments tempers overall volume growth in commodity grades within the Asia-Pacific silica sand industry.
*Our forecasts treat driver/restraint impacts as directional, not additive. The impact forecasts reflect baseline growth, mix effects, and variable interactions.
Segment Analysis
By Grade: Ultra-High Purity Grades Redefine Value Capture
Hyper HPQ expanded at an 11.32% CAGR through 2031. It's a 300-500% price premium that reshapes exploration budgets and capital deployment. Glass grade retained 64.41% of 2025 volume, driven by float and container furnaces able to tolerate 300-500 ppm iron, yet solar-glass makers are shifting toward intermediate high-purity sand to lift module efficiency. Exploration now targets pegmatite-hosted quartz veins and high-silica sandstone where lower innate impurities cut processing costs, a strategic shift underscoring how value, not volume, is defining the future Asia-Pacific silica sand market size for upstream investors.
Regulatory standards such as China’s GB/T 32649 for high-purity quartz and Japan’s JIS R 3503 for optical glass tighten impurity ceilings further. Companies including Xinyi Golden Ruite deploy acid-leaching and flotation in Guangdong, while VRX Silica’s Arrowsmith North project focuses on 99.99% SiO₂ output for semiconductor crucibles. These investments translate directly into a premium positioning across the Asia-Pacific silica sand market, elevating beneficiation technology to a core competitive differentiator.


By End-use Industry: Glass Manufacturing Dominates, Foundry Gains
Glass manufacturing captured 43.69% of volume in 2025 and is advancing at 7.44% CAGR, fuelled by annual solar-module installations that add 80-100 GW of capacity across China, India, and Southeast Asia. The Asia-Pacific silica sand market size for glass remains anchored in China’s solar-glass capacity, but new furnaces in Malaysia and India point to geographical diversification. Foundry applications are rebounding, energized by electric-vehicle drivetrain casings and 5 MW wind-turbine hubs that demand precisely graded, low-clay sand. The Asia-Pacific silica sand market share pulled by these higher-purity foundry grades is set to widen as automakers target lighter, intricately cast housings.
Chemical end users consume silica in silicon-metal, sodium-silicate, and silicone rubber production, aligning with China’s 3 million-ton silicon-metal output in 2024. Construction retains large, if slowing, tonnage owing to the rise of M-sand. Minor yet differentiated outlets such as paints, filtration, and ceramics prize customized gradations, delivering margin that often outstrips bulk sales volumes, another indicator of the Asia-Pacific silica sand industry’s pivot toward value-added niches.
Geography Analysis
China accounted for 73.75% of volume in 2025 as its solar-glass lines, float-glass furnaces, polysilicon capacity, and silicon-metal smelters absorbed vast silica quantities. Green Mining policies cut active mines by two-thirds, but integrated producers secure environmental permits and capture long-term offtake with glassmakers. Xinyi Solar, for instance, logged HKD 43.7 billion revenue for 1H 2024 and expanded Malaysian capacity, thereby exporting the Asia-Pacific silica sand market’s influence to Southeast Asia.
India advances at 8.59% CAGR, underpinned by a USD 1.4 trillion National Infrastructure Pipeline and Production-Linked Incentives for solar modules. Competitive auctions in Rajasthan, Gujarat, and Andhra Pradesh grant mining leases only to operators committing to beneficiation and reclamation, formalizing a supply chain historically fragmented. Domestic tile production consumed 8 million tons of silica in 2024, while Borosil Renewables and HNG Float Glass inaugurate furnaces that rely on captive Rajasthan and Gujarat deposits, tightening regional demand in the Asia-Pacific silica sand market.
Japan, South Korea, Singapore, and ASEAN-5 collectively round out the landscape. Japan and South Korea import high-purity quartz from Australia to feed semiconductor and optical fiber industries, while Singapore acts as a transshipment node feeding Malaysian and Vietnamese electronics corridors. Indonesia’s Nusantara city builds and Vietnam’s expressway projects spike construction-grade demand, yet face permit scrutiny. Thailand and Malaysia grow glass capacity, sourcing locally from Chonburi, Rayong, and Perak. Australia becomes a critical supplier of ultra-high-purity quartz, underscoring the cross-border integration that defines the Asia-Pacific silica sand market.
Competitive Landscape
The Asia-Pacific silica sand market features moderate fragmentation: the five largest suppliers control roughly 33% of volume, while hundreds of smaller quarries serve localized buyers. Vertical integration is the prime strategy; Sibelco and Imerys operate beneficiation plants in China, India, and Australia, synchronizing logistics to arbitrage regional price spreads. Mitsubishi and Tochu leverage trading arms to aggregate supply from Southeast Asia and Australia into Japanese and South Korean glass and semiconductor hubs.
Chinese groups such as Chongqing Changjiang River Moulding Material and Xinyi Golden Ruite benefit from preferential permitting close to solar-glass clusters. Australian juniors VRX Silica and Diatreme Resources push into 99.99% SiO₂ feedstock for semiconductors, supported by project finance earmarked for offtake into Taiwan, Japan, and South Korea. Patent filings tracked by the World Intellectual Property Organization show rising interest in plasma-assisted purification and microwave-assisted drying, two methods that lower energy intensity and increase yield, reinforcing technology as a barrier to entry.
Compliance with ISO 9001 and ISO 14001 is becoming a contractual prerequisite for major buyers, marginalizing artisanal miners unable to fund certification audits. As a result, the Asia-Pacific silica sand market tilts toward fewer, capitalized operators capable of meeting ultra-low-iron benchmarks and strict environmental metrics.
Asia-Pacific Silica Sand Industry Leaders
Mitsubishi Corporation
Sibelco
Chongqing Changjiang River Moulding Material Group Co., Ltd.
JFE Mineral & Alloy Company,Ltd.
Covia Holdings LLC
- *Disclaimer: Major Players sorted in no particular order

Recent Industry Developments
- September 2025: VRX Silica secured Part V works approval from the Department of Water and Environmental Regulation (DWER) for its Arrowsmith North Silica Sand Project in Western Australia. This approval permitted the construction and operation of the processing plant and associated infrastructure, following environmental and mining approvals, with first production targeted for H2 2026.
- June 2025: Diatreme Resources Limited’s Northern Silica Project (NSP) in Queensland, Australia, was awarded Major Project Status, providing federal facilitation support to expedite approvals for the high-purity silica sand development. Located near Cape Flattery, the project is significant for its role in supplying materials for solar panels and green energy, with an annual production target of 3-5 million tons.


Asia-Pacific Silica Sand Market Report Scope
Silica sand, also known as industrial sand, is a durable and heat-resistant mineral primarily composed of silicon dioxide, commonly in the form of quartz. It is extensively used in glass manufacturing, metal casting (foundries), construction (concrete), water filtration, and horticultural applications.
The Asia-Pacific silica sand market is segmented by grade, end-user industry, and geography. By grade, the market is segmented into glass grade, foundry/smelter grade, optical glass grade, intermediate HPQ, ultra high HPQ, and hyper HPQ. By end-use industry, the market is segmented into glass manufacturing, foundry, chemical, construction, paints and coatings, ceramics and refractories, filtration, oil and gas, and other end-user industries. The report also covers the market size and forecasts for silica sand in 10 countries across the region. For each segment, the market sizing and forecasts have been done on the basis of volume (tons).
By Grade
| Glass Grade |
| Foundry/Smelter Grade |
| Optical Glass Grade |
| Intermediate HPQ |
| Ultra High HPQ |
| Hyper HPQ |
By End-use Industry
| Glass Manufacturing |
| Foundry |
| Chemical |
| Construction |
| Paints and Coatings |
| Ceramics and Refractories |
| Filtration |
| Oil and Gas |
| Other End-user Industries |
By Geography
| China |
| India |
| Japan |
| South Korea |
| Indonesia |
| Thailand |
| Malaysia |
| Singapore |
| Philippines |
| Vietnam |
| Rest of Asia-Pacific |
| By Grade | Glass Grade |
| Foundry/Smelter Grade | |
| Optical Glass Grade | |
| Intermediate HPQ | |
| Ultra High HPQ | |
| Hyper HPQ | |
| By End-use Industry | Glass Manufacturing |
| Foundry | |
| Chemical | |
| Construction | |
| Paints and Coatings | |
| Ceramics and Refractories | |
| Filtration | |
| Oil and Gas | |
| Other End-user Industries | |
| By Geography | China |
| India | |
| Japan | |
| South Korea | |
| Indonesia | |
| Thailand | |
| Malaysia | |
| Singapore | |
| Philippines | |
| Vietnam | |
| Rest of Asia-Pacific |


Key Questions Answered in the Report
How large is the Asia-Pacific silica sand market?
The Asia-Pacific silica sand market stands at 180.68 million tons in 2026 and is projected to reach 249.41 million tons in 2031, on track for a 6.66% CAGR to 2031.
Which country dominates demand?
China leads with 73.75% of the 2025 volume due to its solar-glass, float-glass, and silicon-metal capacity.
Which grade grows fastest through 2031?
Hyper HPQ expands at 11.32% CAGR as semiconductor and battery supply chains lift purity standards.
Why is low-iron glass sand in short supply?
Solar modules now specify less than 120 ppm Fe₂O₃ glass, limiting qualifying deposits and driving beneficiation investment.
Page last updated on:


