Mesoporous Silica Market Size and Share
Market Overview
| Study Period | 2019 - 2030 |
|---|---|
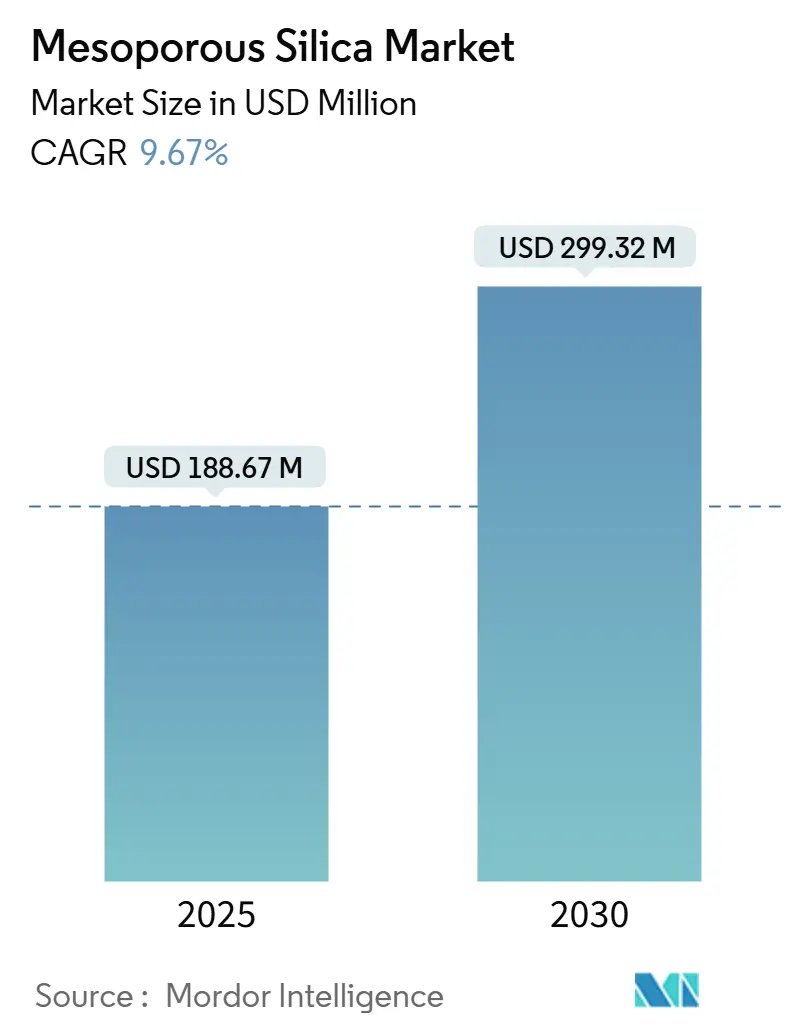
| Market Size (2025) | USD 188.67 Million |
| Market Size (2030) | USD 299.32 Million |
| Growth Rate (2025 - 2030) | 9.67% CAGR |
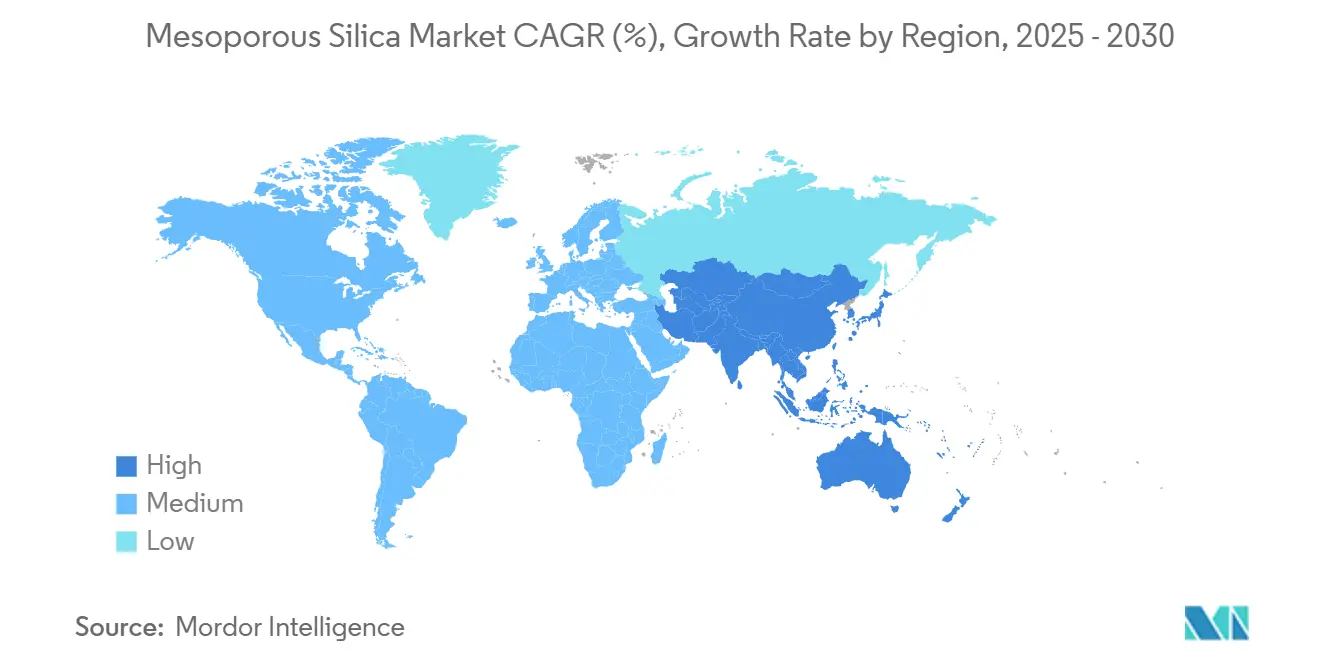
| Fastest Growing Market | Asia Pacific |
| Largest Market | Asia Pacific |
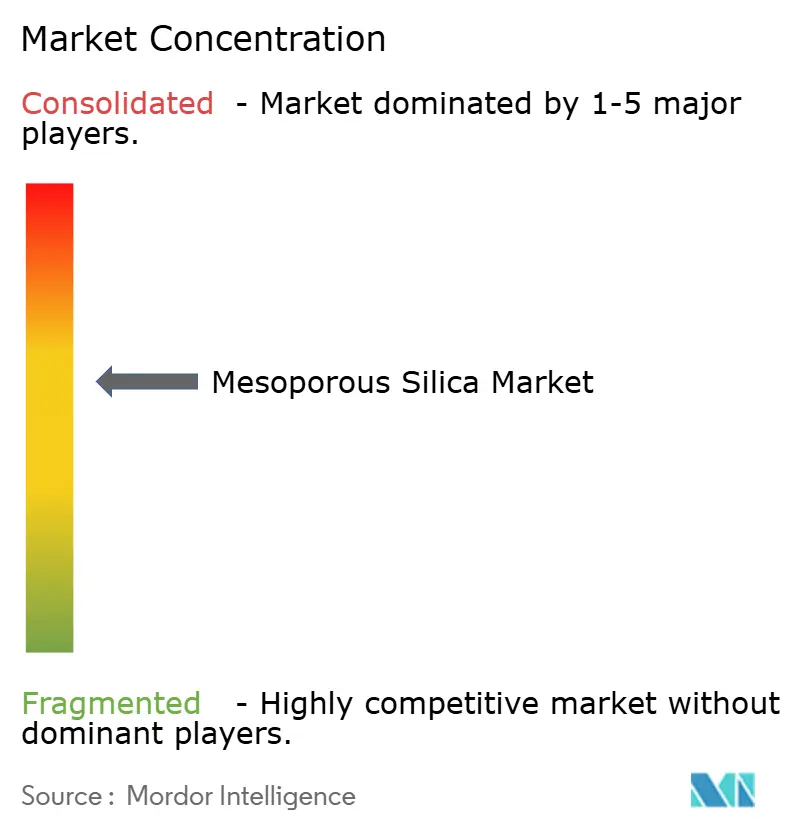
| Market Concentration | Medium |
Major Players *Disclaimer: Major Players sorted in no particular order Image © Mordor Intelligence. Reuse requires attribution under CC BY 4.0. | |
Mesoporous Silica Market Analysis by Mordor Intelligence
The Mesoporous Silica Market size is estimated at USD 188.67 Million in 2025, and is expected to reach USD 299.32 Million by 2030, at a CAGR of 9.67% during the forecast period (2025-2030). Demand acceleration is anchored in pharmaceutical, catalytic, and environmental domains where the material’s high surface area, tunable pore architecture, and proven biocompatibility outperform legacy alternatives. Intensifying precision-medicine pipelines, refinery efficiency upgrades, and stricter global water-quality mandates collectively bolster revenue prospects. On the supply side, mid-tier players scale continuous-flow synthesis while Integrated Chemical Majors (ICMs) consolidate assets to streamline cost and technology transfer. As funding for nanotechnology surges and sustainable-production incentives multiply, innovators that deliver template-free routes and application-specific functionalization capture outsized growth.
Key Report Takeaways
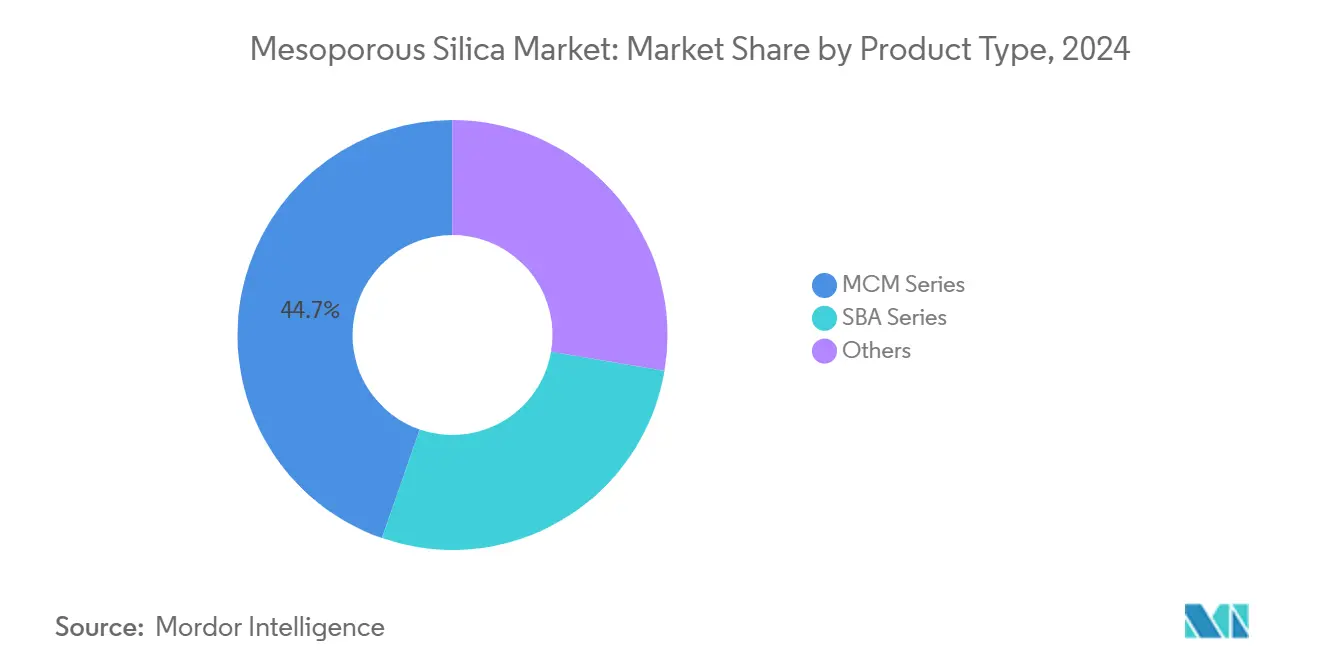
- By product type, the MCM Series held 44.68% of the Mesoporous Silica market share in 2024. The SBA Series is projected to expand at a 9.82% CAGR through 2030.
- By application, drug-delivery and theranostics accounted for 30.12% share of the 2024 Mesoporous Silica market size and is advancing at a 9.96% CAGR through 2030.
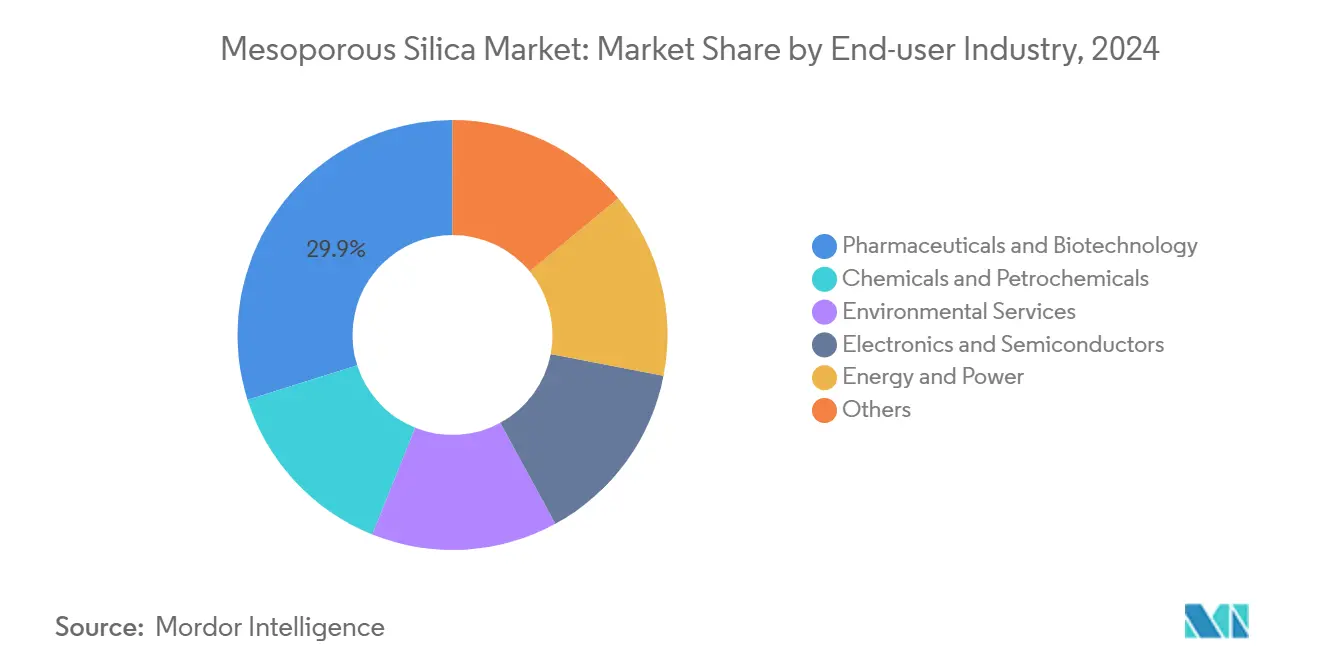
- By end-user industry, pharmaceuticals and biotechnology led with 29.89% revenue share in 2024. Moreover, pharmaceuticals and biotechnology recorded the next-highest projected CAGR at 9.5% through 2030.
- By geography, Asia-Pacific had the highest revenue share of 34.33% in 2024. Asia-Pacific is also set to register the fastest regional CAGR of 9.88% during 2025-2030.
Global Mesoporous Silica Market Trends and Insights
Drivers Impact Analysis*
| Driver | (~) % Impact on CAGR Forecast | Geographic Relevance | Impact Timeline |
|---|---|---|---|
| Rising Demand for Advanced Drug-delivery Carriers | +2.8% | Global, with concentration in North America & Europe | Medium term (2-4 years) |
| Surge in Catalytic and Adsorptive Refinery Upgrades | +2.1% | APAC core, spill-over to Middle East | Long term (≥ 4 years) |
| Expansion of High-throughput Nanotechnology Funding | +1.9% | North America & EU, emerging in APAC | Short term (≤ 2 years) |
| Stricter Water-quality Directives Favouring Eco-adsorbents | +1.6% | Global, with early adoption in EU & North America | Medium term (2-4 years) |
| Adoption as Solid-state Electrolyte Host in Li-S Batteries | +1.3% | APAC leading, with North America & Europe following | Long term (≥ 4 years) |
| Source: Mordor Intelligence | |||
Rising Demand for Advanced Drug-delivery Carriers
Pharmaceutical developers increasingly rely on mesoporous silica nanoparticles to overcome solubility limits that impede almost 40% of new chemical entities[1]Si-Han Wu, “Overcoming the Blood–Brain Tumor Barrier with Docetaxel-Loaded Mesoporous Silica Nanoparticles,” ACS Applied Materials & Interfaces, pubs.acs.org. Clinical-phase momentum grows as the Food and Drug Administration (FDA) clears a widening slate of silica-enabled formulations, reinforcing industry confidence. Patent activity, exemplified by Sigrid Therapeutics’ 2025 U.S. patent for the SiPore platform, confirms commercial viability beyond oncology into metabolic care. Customizable pore geometry underlies precise loading and pH-responsive release, aligning with precision-medicine protocols and raising adoption across North American and European markets where supportive nanomedicine frameworks prevail.
Surge in Catalytic and Adsorptive Refinery Upgrades
Energy-transition imperatives push refineries to cut sulfur and maximize propylene yields. Mesoporous silica-supported catalysts deliver faster mass transfer and higher conversion than conventional zeolites, driving capital allocations across Asia-Pacific complexes. Modifying mesoporous HZSM-5 elevates propylene selectivity from 24.7% to 44%, illustrating quantifiable ROI for process licensors. The Middle East follows with investments to valorize heavy feeds through stable dehydrogenation pathways, cementing long-run demand for engineered mesoporous supports.
Expansion of High-throughput Nanotechnology Funding
The U.S. National Nanotechnology Initiative earmarked USD 2.16 billion in 2024 for materials science, accelerating translational research on mesoporous platforms[2]NSET Subcommittee, “National Nanotechnology Initiative Supplement to the President’s 2024 Budget,” nano.gov. NIH oncology programs parallel this focus, spurring academia-industry alliances that fast-track surface-functionalization breakthroughs. Europe mirrors these efforts via Horizon-funded consortia, while Japan’s METI (Ministry of Economy, Trade and Industry) bolsters synthesis automation. The resulting knowledge spillover compresses commercialization lead times and underwrites a robust patent pipeline.
Stricter Water-quality Directives Favoring Eco-adsorbents
Regulators worldwide now target per- and polyfluoroalkyl substances (PFAS), heavy metals, and pharma residues that evade legacy treatment. The Environmental Protection Agency (EPA)’s 2024 nanosensor grant program underscores official endorsement of advanced adsorbents. Functionalized mesoporous silica surpasses activated carbon on selectivity indices, enabling municipalities to hit discharge thresholds and industries to recycle process water. Adoption accelerates in chronically water-stressed regions where conservation economics magnify technology value.
Restraints Impact Analysis*
| Restraint | (~) % Impact on CAGR Forecast | Geographic Relevance | Impact Timeline |
|---|---|---|---|
| High Template-removal and Scale-up Costs | -1.8% | Global, particularly affecting emerging markets | Short term (≤ 2 years) |
| Competition from MOFs and Zeolites | -1.4% | Global, with varying intensity by application | Medium term (2-4 years) |
| Energy-intensive Post-processing | -1.2% | Global, with higher impact in regions with expensive energy | Medium term (2-4 years) |
| Source: Mordor Intelligence | |||
High Template-removal and Scale-up Costs
Surfactant templates and calcination at 550°C inflate unit costs by 20-30% relative to amorphous silica, restraining penetration into price-sensitive sectors. Industrial scale-up compounds complexity, as pore order can collapse without precise thermal profiles. Evonik’s 2025 North American plant closures and European capacity upgrades show how incumbents chase efficiency via asset rationalization. While continuous-flow and template-free routes emerge, commercial maturity remains two to three years out.
Competition from MOFs and Zeolites
Metal-organic frameworks now achieve industrial price points near USD 29.5 kg for 1,000-tpa output, eroding mesoporous silica’s historical cost edge. Hierarchical zeolites retain advantages in thermal stability during hydrocracking and dewaxing. In biomedical fields, though, silica’s biocompatibility and regulatory familiarity defend share. Competitive pressure consequently drives silica innovators toward hybrid composites and pore-surface engineering to sustain relevance.
*Our forecasts treat driver/restraint impacts as directional, not additive. The impact forecasts reflect baseline growth, mix effects, and variable interactions.
Segment Analysis
By Product Type: MCM Series Maintains Lead Amid SBA Upswing
MCM Series captured 44.68% of the 2024 Mesoporous Silica market share, underscoring entrenched utility in catalytic and drug-delivery arenas where its hexagonal pores optimize molecular transport. Mature batch synthesis confers cost predictability that scales efficiently to industrial reactors. SBA Series, benefiting from 9.82% forecast CAGR, leverages thicker walls and larger pore diameters that withstand hydrothermal rigors, ideal for bulky biopharma compounds and environmental adsorbents. Accelerating continuous-flow SBA-15 output from 5.3 g L⁻¹ h⁻¹ derisks commercial commitments and trims OPEX.
Cost-advantaged MCM remains the incumbent in high-throughput refinery catalysts, yet SBA’s performance edge in demanding applications spurs product line diversification. Suppliers exploit modular reactors to switch between series with minimal downtime, enabling an agile response to order variation. Incremental demand from hybrid organosilicas further enriches the revenue pool and multiplies cross-selling opportunities within the mesoporous silica market.


By Application: Drug-delivery Sets the Pace as Use Cases Multiply
Drug-delivery & theranostics accounted for 30.12% of 2024 revenues and leads segment growth at a 9.96% CAGR. Controlled release profiles extend bioavailability up to three-fold versus spray-dried dispersions, securing clinician buy-in for oncology and metabolic indications. Catalysis remains pivotal, upheld by refinery modernizations that deploy silica supports to drive desulfurization efficacy. Adsorbent demand rises as water utilities adopt selective contaminant capture to meet newly codified discharge standards.
Emerging niches in energy storage validate application breadth. Mesoporous hosts immobilize polysulfides, retaining 80% capacity after 200 battery cycles and marking a significant milestone toward lithium-sulfur commercialization. Similarly, sensors embedded with functionalized silica detect volatile organics at ppb sensitivity, unlocking industrial safety and air-quality dashboards. Diversification tempers market-cycle risk and channels innovation synergies from one application into another.
By End-user Industry: Pharmaceuticals Drive Premium Uptake
Pharmaceuticals & biotechnology held 34.33% of the mesoporous silica market size in 2024 and is slated for a 10.02% CAGR to 2030. High margin tolerance supports the adoption of advanced carriers that might be cost-prohibitive elsewhere. Chemicals & petrochemicals rely on mesoporous catalysts to decarbonize legacy assets, while environmental services scale eco-adsorbents for municipal and industrial water treatment mandates.
Electronics & semiconductors constitute a value-rich niche where monodisperse silica spheres pare wafer roughness down to 0.979 nm, elevating yield in advanced node processing. Energy & power segments build on battery and fuel-cell breakthroughs, securing strategic offtake agreements with material suppliers. The breadth of end-use verticals provides revenue resiliency and channels continual feedback into customized product-development roadmaps.
Geography Analysis
Asia-Pacific registers the fastest CAGR of 9.88% through 2030. China’s rising therapeutic export pipeline and Japan’s synthesis know-how anchor regional dominance. Indonesia’s silica downstreaming policy, projecting USD 45.74 Billion in investment by 2040, signals long-run feedstock availability and domestic demand expansion. Concurrently, high-purity silica ventures in South Korea sustain semiconductor supply chains.
North America retains the technology spearhead, amplified by USD 2.16 Billion in 2024 federal nanotechnology outlays that underwrite translational R&D. Environmental compliance around PFAS accelerates municipal trials of mesoporous adsorbents, complementing strong pharma pull. Strategic plant consolidations, typified by Evonik’s asset optimization, reflect a maturing yet innovation-driven landscape.
Europe leverages stringent water directives and net-zero pledges to cultivate demand for advanced catalysts and adsorbents. Sibelco’s USD 200 Million high-purity quartz expansion underscores confidence in specialty silica trajectory. Robust precision-medicine infrastructure widens deployment of drug-delivery carriers, while cross-border research consortia disseminate process know-how across the bloc.

Competitive Landscape
The Mesoporous Silica market is moderately concentrated as ICMs integrate vertically while specialist firms carve application-specific niches. Evonik’s 2025 “Smart Effects” merger unifies silica and silanes expertise into a 3,500-employee unit focused on cross-sector sustainability, signaling accelerated consolidation. Start-ups exploit template-free synthesis and photocatalytic calcination to slash production energy by up to 18%, positioning for joint ventures with battery and water-treatment OEMs. As competitive intensity elevates, alliance structures shift toward long-term offtake contracts paired with joint R&D.
Mesoporous Silica Industry Leaders
Merck KGaA
BASF
W. R. Grace & Co.
JNC Corporation
Evonik Industries AG
- *Disclaimer: Major Players sorted in no particular order

Recent Industry Developments
- January 2025: Evonik Industries announced the merger of its Silica and Silanes business lines into "Smart Effects,". The merger aims to leverage molecular silane chemistry expertise with silica particle design capabilities to deliver advanced solutions for green technologies and CO2 capture applications. This can also benefit the company’s mesoporous silica business.
- December 2024: The Swedish healthtech company, Sigrid Therapeutics, announced that it has been granted a US patent for its SiPore platform technology. The patent supports the use of Sigrid’s mesoporous SiPore silica particles. SiPore can be used to reduce the risk of developing metabolic syndrome, type 2 diabetes, insulin resistance, or hyperglycaemia.


Global Mesoporous Silica Market Report Scope
| MCM Series |
| SBA Series |
| Others |
| Drug-Delivery and Theranostics |
| Catalysis |
| Adsorbents |
| Sensors |
| Energy Storage and Conversion |
| Others |
| Pharmaceuticals and Biotechnology |
| Chemicals and Petrochemicals |
| Environmental Services |
| Electronics and Semiconductors |
| Energy and Power |
| Others |
| Asia-Pacific | China |
| Japan | |
| India | |
| South Korea | |
| ASEAN Countries | |
| Rest of Asia-Pacific | |
| North America | United States |
| Canada | |
| Mexico | |
| Europe | Germany |
| United Kingfom | |
| France | |
| Italy | |
| Spain | |
| Russia | |
| Rest of Europe | |
| South America | Brazil |
| Argentina | |
| Rest of South America | |
| Middle-East and Africa | Saudi Arabia |
| UAE | |
| South Africa | |
| Rest of Middle-East and Africa |
| By Product Type | MCM Series | |
| SBA Series | ||
| Others | ||
| By Application | Drug-Delivery and Theranostics | |
| Catalysis | ||
| Adsorbents | ||
| Sensors | ||
| Energy Storage and Conversion | ||
| Others | ||
| By End-user Industry | Pharmaceuticals and Biotechnology | |
| Chemicals and Petrochemicals | ||
| Environmental Services | ||
| Electronics and Semiconductors | ||
| Energy and Power | ||
| Others | ||
| By Geography | Asia-Pacific | China |
| Japan | ||
| India | ||
| South Korea | ||
| ASEAN Countries | ||
| Rest of Asia-Pacific | ||
| North America | United States | |
| Canada | ||
| Mexico | ||
| Europe | Germany | |
| United Kingfom | ||
| France | ||
| Italy | ||
| Spain | ||
| Russia | ||
| Rest of Europe | ||
| South America | Brazil | |
| Argentina | ||
| Rest of South America | ||
| Middle-East and Africa | Saudi Arabia | |
| UAE | ||
| South Africa | ||
| Rest of Middle-East and Africa | ||


Key Questions Answered in the Report
What is the expected value of Mesoporous Silica market in 2030?
Forecasts indicate the expected value of Mesoporous Silica market to reach USD 299.32 Million by 2030 based on a 9.67% CAGR.
Which product series leads current revenue?
The MCM Series holds 44.68% of 2024 revenue due to cost-efficient synthesis and established catalytic performance.
Why is drug-delivery a high-growth application?
Tunable pores enable controlled release, improving bioavailability up to three-fold versus conventional formulations, propelling a 9.96% CAGR.
Which region is expanding fastest?
Asia-Pacific is projected to grow at 9.88% through 2030 on the back of pharmaceutical capacity build-out and materials R&D.
How are costs being reduced in production?
Continuous-flow and template-free synthesis lower energy use and template expenses, cutting unit costs by up to 18%.
Page last updated on:


