Specialty Silica Market Size and Share
Market Overview
| Study Period | 2021 - 2031 |
|---|---|
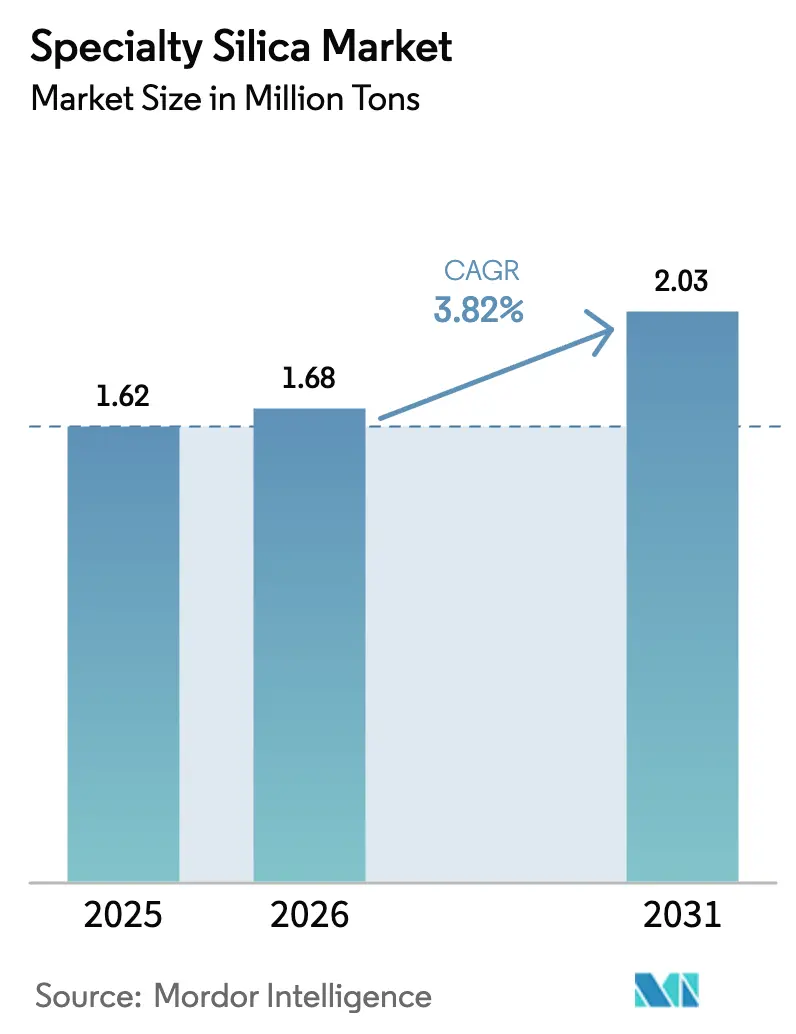
| Market Volume (2026) | 1.68 Million tons |
| Market Volume (2031) | 2.03 Million tons |
| Growth Rate (2026 - 2031) | 3.82% CAGR |
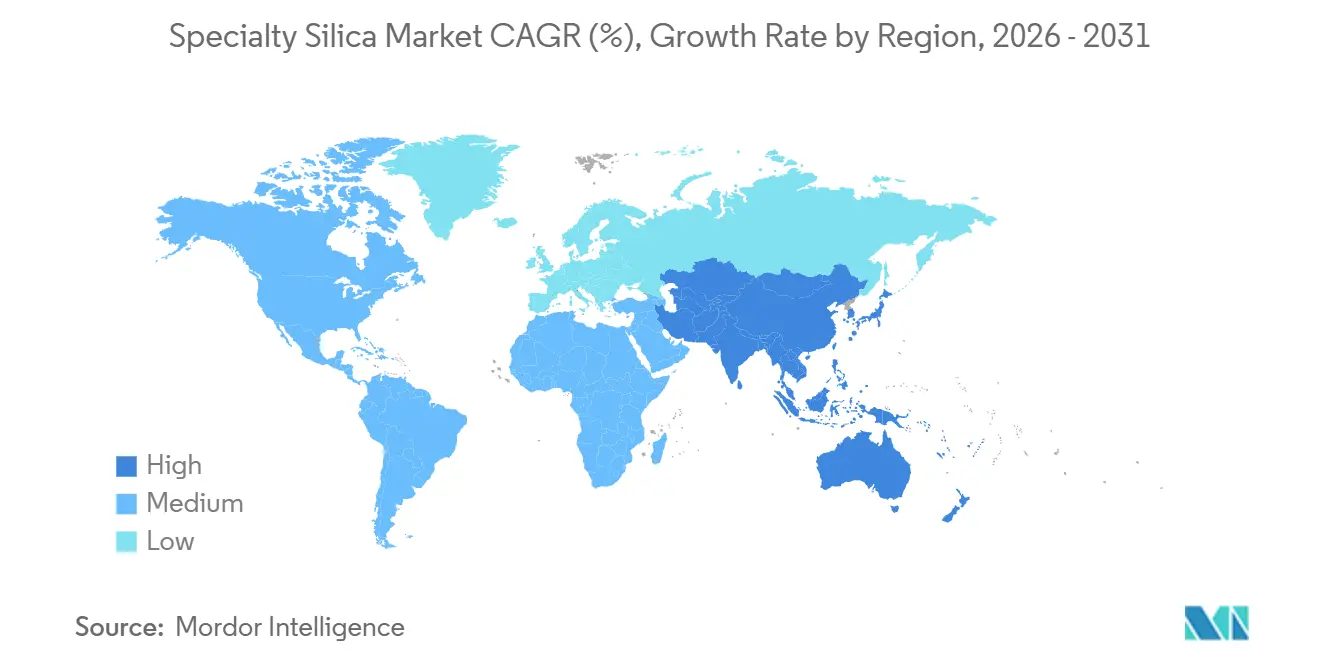
| Fastest Growing Market | Asia Pacific |
| Largest Market | Asia Pacific |
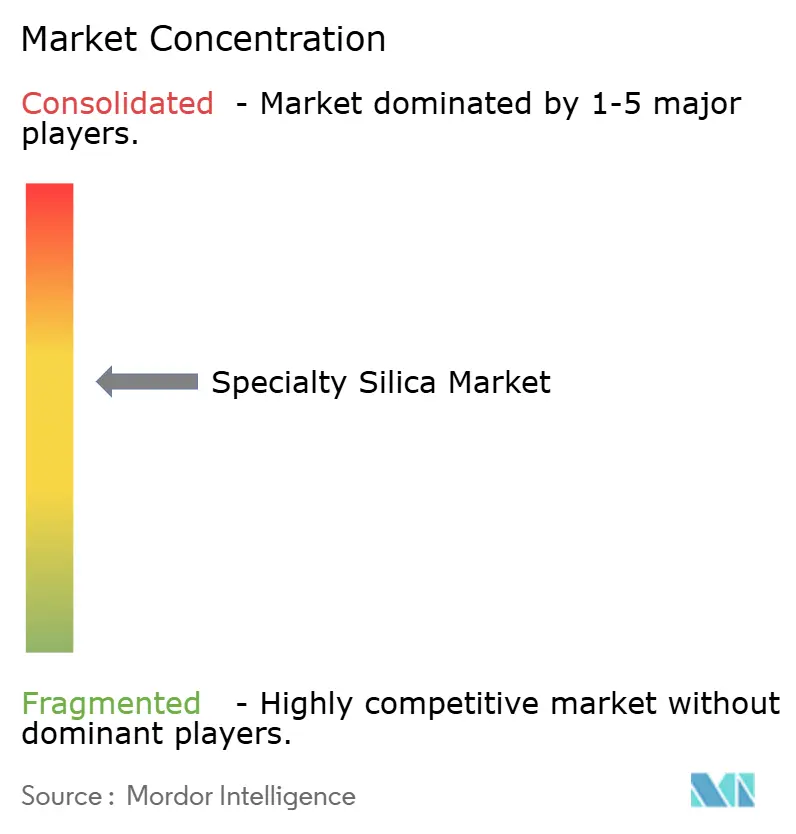
| Market Concentration | Medium |
Major Players *Disclaimer: Major Players sorted in no particular order Image © Mordor Intelligence. Reuse requires attribution under CC BY 4.0. | |
Specialty Silica Market Analysis by Mordor Intelligence
The Specialty Silica Market size is projected to be 1.62 million tons in 2025, 1.68 million tons in 2026, and reach 2.03 million tons by 2031, growing at a CAGR of 3.82% from 2026 to 2031. Demand remains anchored in tire reinforcement, yet margin-accretive niches such as battery-separator coatings and mesoporous vaccine adjuvants are reshaping the value pool. Asia-Pacific dominates current volumes on the back of China’s green-tire mandates and is set to outpace North America and Europe through 2031. Precipitated grades retain scale advantage, though bio-silica derived from rice-husk ash is emerging as the fastest-growing route as circular-economy economics gain traction in India and Southeast Asia. Incumbent suppliers face a delicate capital-allocation puzzle, funding pharmaceutical-grade cleanrooms while defending commoditized markets against low-cost Asian entrants.
Key Report Takeaways
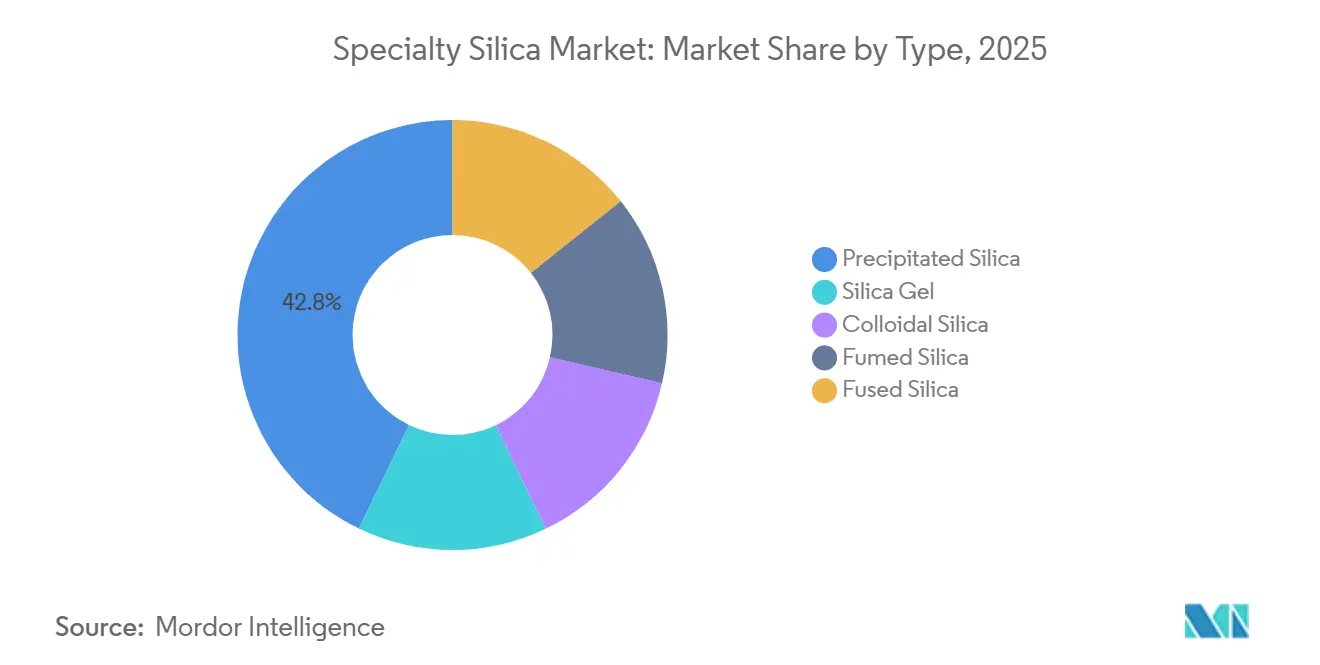
- By type, precipitated silica held 42.84% of the specialty silica market share in 2025 and is projected to advance at a 4.18% CAGR through 2031.
- By production process, wet/precipitated routes commanded 65.15% share in 2025; bio-silica from Rice-Husk Ash is set to expand at a 5.08% CAGR to 2031.
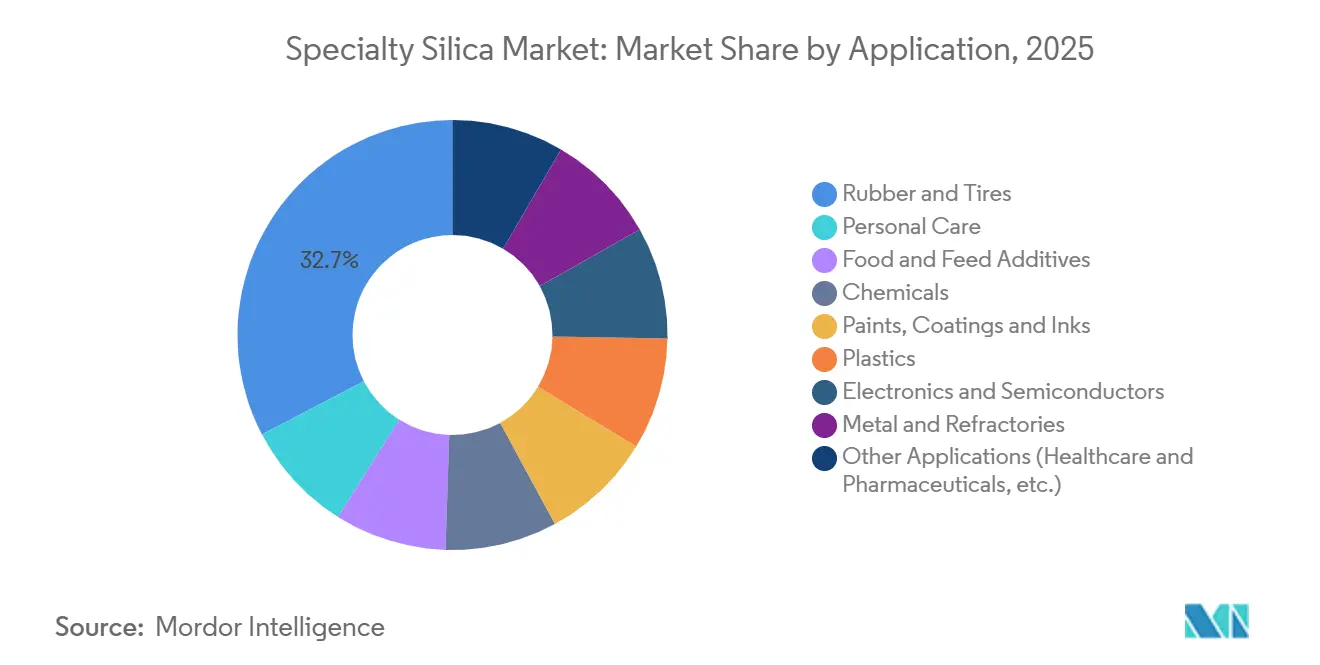
- By application, rubber and tires led with 32.66% revenue share in 2025; electronics and semiconductors are forecast to grow at a 4.67% CAGR through 2031.
- By geography, Asia-Pacific accounted for 45.52% share in 2025 and is expected to post a 4.55% CAGR to 2031.
Note: Market size and forecast figures in this report are generated using Mordor Intelligence’s proprietary estimation framework, updated with the latest available data and insights as of January 2026.
Global Specialty Silica Market Trends and Insights
Drivers Impact Analysis*
| Driver | (~) % Impact on CAGR Forecast | Geographic Relevance | Impact Timeline |
|---|---|---|---|
| Increasing Demand from Rubber Industry | +1.2% | Global, with concentration in Asia-Pacific (China, India, Thailand) and spillover to Europe | Long term (≥ 4 years) |
| Growing Penetration from Personal-Care Rheology and Matting Agents | +0.6% | North America and EU, emerging in APAC urban centers | Medium term (2-4 years) |
| Shift Toward Low-VOC/High-Performance Industrial Coatings Requiring Specialty Silica | +0.7% | EU (REACH compliance zones), California, Canada | Medium term (2-4 years) |
| Increasing Usage in EV Battery Separators and Solid-State Electrolytes | +0.9% | Global, led by China, South Korea, Japan, with North America scaling | Long term (≥ 4 years) |
| Growing Emphasis on Mesoporous Silica as Next-Gen Vaccine Adjuvant Carrier | +0.3% | North America, EU (regulatory-approved markets) | Long term (≥ 4 years) |
| Source: Mordor Intelligence | |||
Increasing Demand from Rubber Industry
Tire makers now blend 80-100 parts per hundred rubber of precipitated silica to satisfy rolling-resistance targets that cut fuel consumption by 3-5% per vehicle. Chinese OEMs adopted Evonik’s ULTRASIL grades in 2025 to prepare for China 7 rules that mirror Euro 7 thresholds. The silica-silane coupling system improves wet grip and lowers heat buildup, though it requires strict surface-area control, prompting several Chinese tire plants to co-locate near silica facilities. Replacement-tire demand in India and Southeast Asia is amplifying volume as motorists shift from bias-ply to radial designs. Fleet operators report tread-life gains of 15-20%, making silica-rich tires economically attractive despite an 8-10% price premium.
Growing Penetration from Personal-Care Rheology and Matting Agents
Cosmetic brands are replacing talc with colloidal and precipitated silica amid litigation over asbestos contamination and rising clean-label preference. Silica absorbs up to 2.5 times its weight in oil, delivering a matte finish without compromising skin feel. L’Oréal and Estée Lauder launched silica-rich foundations in 2025 that command price premiums in the prestige segment. Aerogel forms support controlled-release fragrance spheres that sell for USD 15-20 per kilogram, versus USD 2-3 for commodity precipitated grades. EU Cosmetics Regulation 1223/2009 mandates purity traceability, favoring established silica suppliers with ISO 22716 certification.
Shift Toward Low-VOC/High-Performance Industrial Coatings Requiring Specialty Silica
EU Directive 2004/42/EC and California Rule 1113 cap VOC content at 50-100 g/L, pushing formulators to water-borne systems that need silica for matting and rheology control. Hydrophilic grades require silane pre-treatment to disperse in water, spurring joint R&D programs between silica suppliers and paint majors. PPG and AkzoNobel reported 10-15% formulation cost savings after switching from wax-based to silica-based matting agents in 2025. Offshore wind-turbine coatings using colloidal silica now extend recoat intervals to eight years, improving asset uptime. Peak growth is expected in the medium term as OEMs finish reformulations and regulatory approvals.
Increasing Usage in EV Battery Separators and Solid-State Electrolytes
Lithium-ion cell makers apply 2-4 micron silica layers on polyolefin separators to raise thermal-runaway thresholds from 130 °C to 160 °C. LG Energy Solution and CATL expanded coated-separator lines in 2025, targeting packs above 300 Wh/kg. Solid-state programs embed mesoporous silica into sulfide electrolytes to reduce interfacial resistance by 30%. Pharmaceutical-grade fumed silica with less than 10 ppm metal contamination is required to avoid capacity fade, leaving only a handful of qualified producers. North American adoption will accelerate under the Inflation Reduction Act domestic-content rules.
Restraints Impact Analysis*
| Restraint | (~) % Impact on CAGR Forecast | Geographic Relevance | Impact Timeline |
|---|---|---|---|
| High Production Cost and Energy Intensity | -0.8% | Global, acute in EU due to carbon pricing; moderate in North America | Medium term (2-4 years) |
| Availability of Substitutes | -0.4% | Global, with higher substitution in cost-sensitive applications (Asia-Pacific, South America) | Short term (≤ 2 years) |
| Limited Supply of High-Purity Quartz Feedstock in Key Regions | -0.5% | North America, EU; indirect impact on Asia-Pacific through supply-chain disruption | Long term (≥ 4 years) |
| Source: Mordor Intelligence | |||
High Production Cost and Energy Intensity
Flame-hydrolysis consumes 8-10 MWh per ton, and EU electricity prices of EUR 150-200/MWh in 2026 lift cash costs by 35-40% at Wacker’s Burghausen site[1]Wacker Chemie AG, “Sustainability Report 2025,” wacker.com . Carbon-border levies add EUR 80-100 per ton to imported silica, prompting a EUR 120 million onsite renewables program to cut emissions by 50% by 2028. Asian producers with coal-based baseload power undercut European fumed-silica prices by 25%, steering EU suppliers toward ultra-high-purity niches. Wet-precipitated routes use only 2-3 MWh per ton yet still face higher natural-gas prices for spray-drying. The narrowing margin forces Western firms to prioritize premium grades over commodity volumes.
Availability of Substitutes
Carbon black remains dominant in truck-tire reinforcement where silica’s wet-grip edge is less valued and its cost premium hard to justify. Personal-care chemists are trialing rice starch and tapioca powders that absorb oil at 60-70% of silica’s cost, though heat stability is inferior. Coatings formulators in low-gloss interior paints employ calcium carbonate and kaolin replacements when abrasion resistance is non-critical. Substitution risk is highest in price-sensitive markets representing roughly 20% of silica volumes, tempering overall growth by 0.4%. Suppliers defend share by offering custom surface treatments that cheaper fillers cannot replicate.
*Our forecasts treat driver/restraint impacts as directional, not additive. The impact forecasts reflect baseline growth, mix effects, and variable interactions.
Segment Analysis
By Type: Precipitated Grades Retain Scale, Bio-Silica Accelerates
Precipitated silica accounted for 42.84% volume in 2025, underscoring its entrenched role in tire compounds and coatings that value a cost-to-performance ratio unattainable for higher-priced fumed grades, thereby anchoring specialty silica market size leadership. The segment is projected to post a 4.18% CAGR through 2031 as green-tire penetration deepens and wet-masterbatch processing raises loadings per tire. Silica gel demand grows steadily in pharmaceutical desiccants and chromatography media for single-use bioprocessing, while colloidal grades ride CMP-slurry expansion in advanced semiconductors. Fumed silica stays niche yet indispensable in silicone sealants, adhesives, and low-dielectric encapsulants that require less than 40 nm particle distributions. Fused silica commands the highest prices as it enables optical-fiber preforms and EUV photomasks with near-zero thermal expansion.


By Production Process: Wet Precipitation Dominates, Bio-Silica Scales Fastest
Wet/precipitated yielded 65.15% of 2025 output, reflecting decades of optimization that bring cash costs as low as USD 0.80-1.20 per kilogram, securing specialty silica market share across cost-sensitive rubber and coatings sectors. Flame hydrolysis, while energy-intensive, remains irreplaceable for semiconductor-grade purity, pricing at USD 4-8 for standard fumed and USD 15-25 for pharma-grade variants. Sol-gel methods occupy strategic niches in aerogels and mesoporous carriers where pore-size architecture justifies USD 10-50 price points.
Bio-silica from rice-husk ash, though embryonic, scales at a 5.08% CAGR as rice-husk valorization gains policy backing, notably India’s 2025 guidelines encouraging agricultural-waste upcycling. Pilot plants show 160-180 m²/g surface areas achievable after acid leaching and spray-drying, narrowing performance gaps with conventional precipitated grades. ASEAN capacity expansions by Chinese producers also underline cost arbitrage efforts as they bypass anti-dumping tariffs in Western markets. Process diversification thus mirrors a broader industry pivot toward security of supply and sustainability metrics, even as wet precipitation holds overarching dominance in specialty silica industry capacity.

By Application: Electronics Surges, Tires Sustain Core Volume
Rubber and tires delivered 32.66% of specialty silica market size in 2025, preserving the backbone of global demand in lockstep with vehicle-production trends. OEM mandates for low-rolling-resistance tires cement silica’s role as a non-negotiable filler, while Asian replacement-tire upgrades add incremental volume. Electronics and semiconductors, at a smaller base, expand at a 4.67% CAGR and are poised to absorb high-value fumed silica, particularly for CMP slurries polishing copper interconnects on 3 nm and 2 nm nodes. Each advanced logic wafer uses 20-25 g of silica in multiple slurry passes, a figure set to rise as backside-power-delivery architectures grow in complexity.
Personal care advances on talc substitution, leveraging silica’s oil-absorption and rheology benefits to meet clean-label claims, while food and feed maintain incremental gains through anti-caking adoption in powdered ingredients. Paints and coatings benefit from low-VOC rules, with silica matting agents pushing gloss levels below 20 units and improving scratch resistance. Plastics and composites integrate hydrophobic fumed grades for thickening liquid silicone rubber, whereas metals and refractories rely on fused silica for investment-casting molds in aerospace turbines. The application mix is therefore tilting toward high-margin niches, lifting average selling prices even though commodity tire volumes still dominate specialty silica market share.
Geography Analysis
Asia-Pacific held 45.52% of specialty silica market size in 2025 and is projected to expand at a 4.55% CAGR through 2031, driven by China’s production of 650 million tires that increasingly specify silica-silane compounds to meet impending China 7 standards. India emerges as a bio-silica front-runner with Tata Chemicals inaugurating a 20,000-ton Punjab plant that monetizes rice-husk waste and supplies domestic tire makers[2]Tata Chemicals, “Bio-Silica Plant Commissioning,” tatachemicals.com . Japan and South Korea remain global hubs for semiconductor-grade fumed and fused silica, leveraging stringent metal-contamination controls to serve 3 nm logic and EUV photomask markets. Vietnamese and Thai facilities built by Shandong Link Silica illustrate a migration of precipitated capacity toward lower-cost ASEAN locations that still access regional rubber demand.
North America captures incremental growth from EV battery-separator coatings and vaccine-grade mesoporous silica, segments where regulatory familiarity and cGMP infrastructure underpin premium pricing. Cabot’s Tuscola, Illinois plant supplies 60% of regional fumed-silica needs for silicone rubber and CMP, while Mexican tire assemblies under USMCA rules boost precipitated-silica imports from Brazil. Europe’s share growth rate is low due to elevated power prices and carbon levies that squeeze commodity margins, yet the region carves defensible niches in pharmaceutical and battery-grade grades where quality trumps cost. Capacity rationalization such as Solvay’s 2025 divestment of commodity lines to Orbia underscores this shift.
South America centers on Brazil’s tire and agricultural machinery sectors, with Imerys’ São Paulo plant feeding Michelin and Bridgestone facilities. Middle East and Africa remain import-oriented, purchasing precipitated silica for coatings and construction fillers in Saudi Arabia and South Africa given the absence of high-purity quartz deposits. Geopolitical resource security and sustainability credentials will likely reinforce Asia-Pacific’s quantitative lead, yet North America and Europe will continue to command a disproportionate share of value through specialized high-purity and pharmaceutical niches.

Competitive Landscape
Moderate concentration characterizes the specialty silica market, with Evonik, Wacker, Cabot, Solvay, and QEMETICA controlling 53% of global volume in 2025. These leaders pursue a barbell strategy, expanding large-scale precipitated plants in Asia while commissioning cleanroom lines in Europe and the United States for mesoporous vaccine adjuvants and battery-separator coatings. Evonik’s EUR 200 million Chinese expansion paired with a EUR 80 million German pharmaceutical line typifies this dual path. Cabot’s 2024 U.S. patent for silane-treated fumed silica underpins a seven-year supply pact with LG Energy Solution worth USD 150 million, securing downstream integration in coated separators. Wacker invests EUR 120 million in renewables at Burghausen to mitigate carbon-border costs and retain European purity leadership.
Regional entrants harness local feedstocks and sustainability narratives to erode incumbent pricing power. Indian bio-silica producers like Orind Impex undercut precipitated pricing by 15-20% domestically, prompting incumbents to deepen customer contracts that favor supply assurance over spot economics. Technology differentiation also widens the gap: plants deploying inline laser diffraction and automated pH adjustment hit 98-99% first-pass yield, trimming waste by 8-10% versus legacy batch processes. Regulatory moats remain formidable; only twelve firms hold FDA Drug Master Files for pharma-grade fumed silica and fewer than eight meet SEMI CMP standards, shielding high-value niches from pure price competition. The market therefore trends toward a bifurcated structure of scale-heavy commodity producers and agile specialty suppliers, with sustainability-driven bio-silica adding a third disruptive tier.
Specialty Silica Industry Leaders
Evonik industries AG
Cabot Corporation
Wacker Chemie AG
Solvay
QEMETICA
- *Disclaimer: Major Players sorted in no particular order

Recent Industry Developments
- November 2025: Tata Chemicals invested INR 775 crore to expand the precipitated silica capacity at its Cuddalore facility in India. The facility currently produces 13.8 kilotonnes per annum at an 86% utilization rate and expansion will add 50 kilotonnes of specialty silica annually at Cuddalore over the next 27 months.
- January 2024: Evonik Industries AG increased the production capacity of precipitated silica at its Charleston, US site by 50%. This expansion addressed the growing demand for silica in the tire, oral care, and other industries across North America.


Global Specialty Silica Market Report Scope
Specialty silica is a very pure kind of silicon dioxide that is utilized in rubber, plastics, and other industrial products as a reinforcing agent. It helps to increase these materials' mechanical qualities and lengthen their useful lives.
The specialty silica market is segmented by type, production process, application, and geography. By type, the market is segmented into precipitated silica, silica gel, colloidal silica, fumed silica, and fused silica. By production process, the market is segmented into wet/precipitated, flame hydrolysis, sol-gel, and bio-silica from rice-husk ash. By application, the market is segmented into rubber and tires, personal care, food and feed additives, chemicals, paints, coatings, and inks, plastics, electronics and semiconductors, metal and refractories, and other applications (healthcare and pharmaceuticals, etc.). The report also covers the market size and forecasts for the specialty silica market in 15 countries across major regions. For each segment, the market sizing and forecasts have been done on the basis of volume (tons).
| Precipitated Silica |
| Silica Gel |
| Colloidal Silica |
| Fumed Silica |
| Fused Silica |
| Wet/Precipitated |
| Flame Hydrolysis |
| Sol-Gel |
| Bio-silica from Rice-Husk Ash |
| Rubber and Tires |
| Personal Care |
| Food and Feed Additives |
| Chemicals |
| Paints, Coatings and Inks |
| Plastics |
| Electronics and Semiconductors |
| Metal and Refractories |
| Other Applications (Healthcare and Pharmaceuticals, etc.) |
| Asia-Pacific | China |
| India | |
| Japan | |
| South Korea | |
| ASEAN Countries | |
| Rest of Asia-Pacific | |
| North America | United States |
| Canada | |
| Mexico | |
| Europe | Germany |
| United Kingdom | |
| France | |
| Italy | |
| Rest of Europe | |
| South America | Brazil |
| Argentina | |
| Rest of South America | |
| Middle East and Africa | Saudi Arabia |
| South Africa | |
| Rest of Middle East and Africa |
| By Type | Precipitated Silica | |
| Silica Gel | ||
| Colloidal Silica | ||
| Fumed Silica | ||
| Fused Silica | ||
| By Production Process | Wet/Precipitated | |
| Flame Hydrolysis | ||
| Sol-Gel | ||
| Bio-silica from Rice-Husk Ash | ||
| By Application | Rubber and Tires | |
| Personal Care | ||
| Food and Feed Additives | ||
| Chemicals | ||
| Paints, Coatings and Inks | ||
| Plastics | ||
| Electronics and Semiconductors | ||
| Metal and Refractories | ||
| Other Applications (Healthcare and Pharmaceuticals, etc.) | ||
| By Geography | Asia-Pacific | China |
| India | ||
| Japan | ||
| South Korea | ||
| ASEAN Countries | ||
| Rest of Asia-Pacific | ||
| North America | United States | |
| Canada | ||
| Mexico | ||
| Europe | Germany | |
| United Kingdom | ||
| France | ||
| Italy | ||
| Rest of Europe | ||
| South America | Brazil | |
| Argentina | ||
| Rest of South America | ||
| Middle East and Africa | Saudi Arabia | |
| South Africa | ||
| Rest of Middle East and Africa | ||


Key Questions Answered in the Report
How large is the specialty silica market in 2026?
The market reached 1.68 million tons in 2026 and is on track to hit 2.03 million tons by 2031.
Which region leads consumption of specialty silica?
Asia-Pacific holds 45.52% of volume in 2025 thanks to China’s dominant tire industry and fast-growing electronics manufacturing.
Which application segment is growing fastest?
Electronics and semiconductors are expanding at a 4.67% CAGR due to rising demand for fumed-silica CMP slurries in advanced chip fabrication.
What production route is gaining the most momentum?
Bio-silica from rice-husk ash shows the highest forecast CAGR at 5.08%, propelled by circular-economy incentives in India and Southeast Asia.
Page last updated on:


