North America Silica Sand Market Size and Share
Market Overview
| Study Period | 2021 - 2031 |
|---|---|
| Forecast Data Period | 2026 - 2031 |
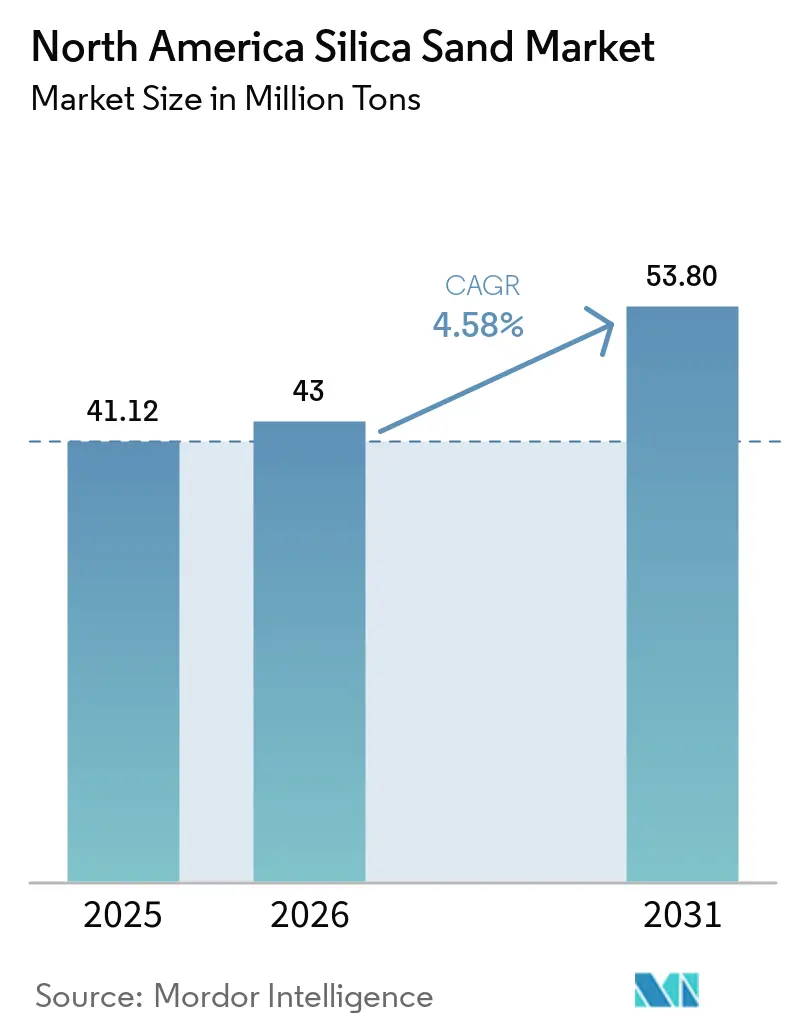
| Base Year Market Size (2025) | 41.12 Million tons |
| Market Volume (2026) | 43 Million tons |
| Market Volume (2031) | 53.80 Million tons |
| Growth Rate (2026 - 2031) | 4.58% CAGR |
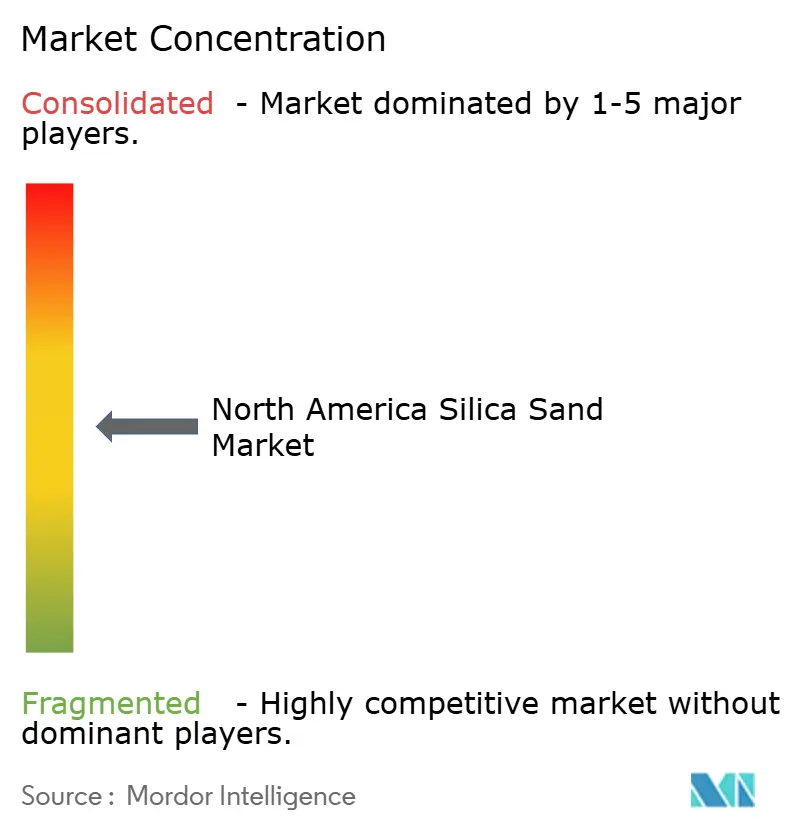
| Market Concentration | Medium |
Major Players *Disclaimer: Major Players sorted in no particular order Image © Mordor Intelligence. Reuse requires attribution under CC BY 4.0. | |
North America Silica Sand Market Analysis by Mordor Intelligence
The North America Silica Sand Market size is projected to expand from 41.12 Million tons in 2025 and 43 Million tons in 2026 to 53.80 Million tons by 2031, registering a CAGR of 4.58% between 2026 to 2031. The shift away from a hydraulic-fracturing-only demand base toward higher-margin industrial outlets is underway as rig counts soften and federal incentives spur semiconductor-grade capacity. Oil and gas completions still dominate absolute volume, yet permits for new foundry, filtration, and glass lines point to wider downstream pull. Public works spending is translating into steadier construction sand offtake, while CHIPS Act grants awarded to Corning and Hemlock Semiconductor underscore the long-run role of high-purity grades in value creation. Pricing spreads between Northern White and in-basin brown sand narrowed in 2025, but logistics volatility and dust-exposure regulations continue to weigh on delivered-cost economics for distant mines. Producers that integrate wet and dry circuits, lock in rail capacity, and secure NSF/ANSI 61 or SEMI certifications are better positioned to ride the 4.58% growth path of the North America silica sand market.
Key Report Takeaways
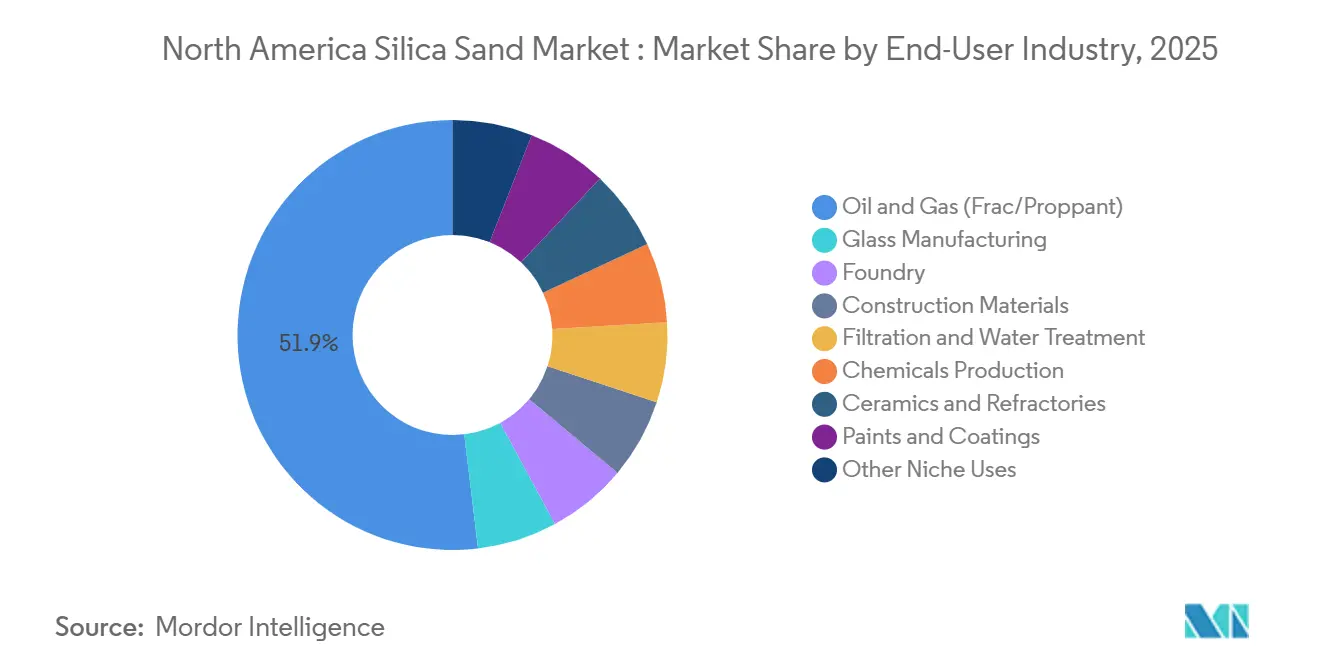
- By end-user industry, oil and gas applications led with a 51.89% share of the North American silica sand market in 2025, while filtration and water treatment are projected to post the highest CAGR of 5.31% during the forecast period (2026-2031).
- By product form, Northern White Sand accounted for 40.88% of the North America silica sand market size in 2025, and high-purity silica grades are forecast to expand at a 5.51% CAGR during the forecast period (2026-2031).
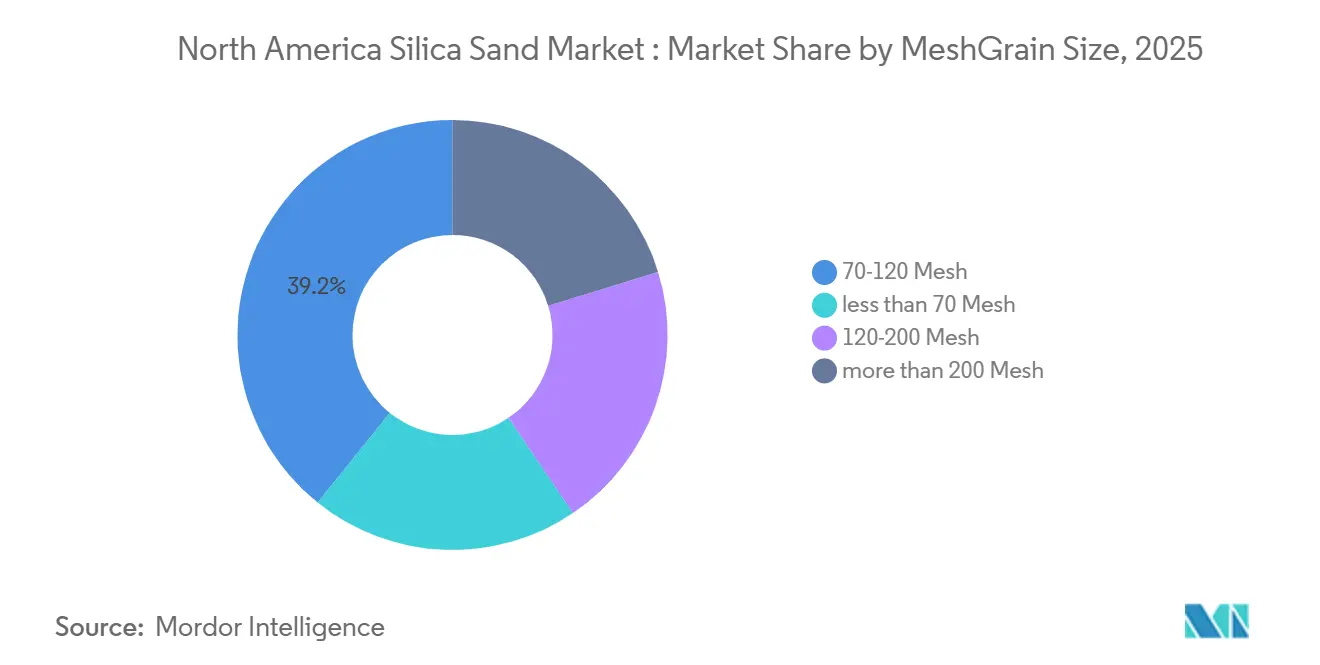
- By mesh/grain size, the 70-120-mesh category captured 39.20% share of the North America silica sand market size in 2025; more than 200-mesh grades are advancing at a 5.10% CAGR during the forecast period (2026-2031).
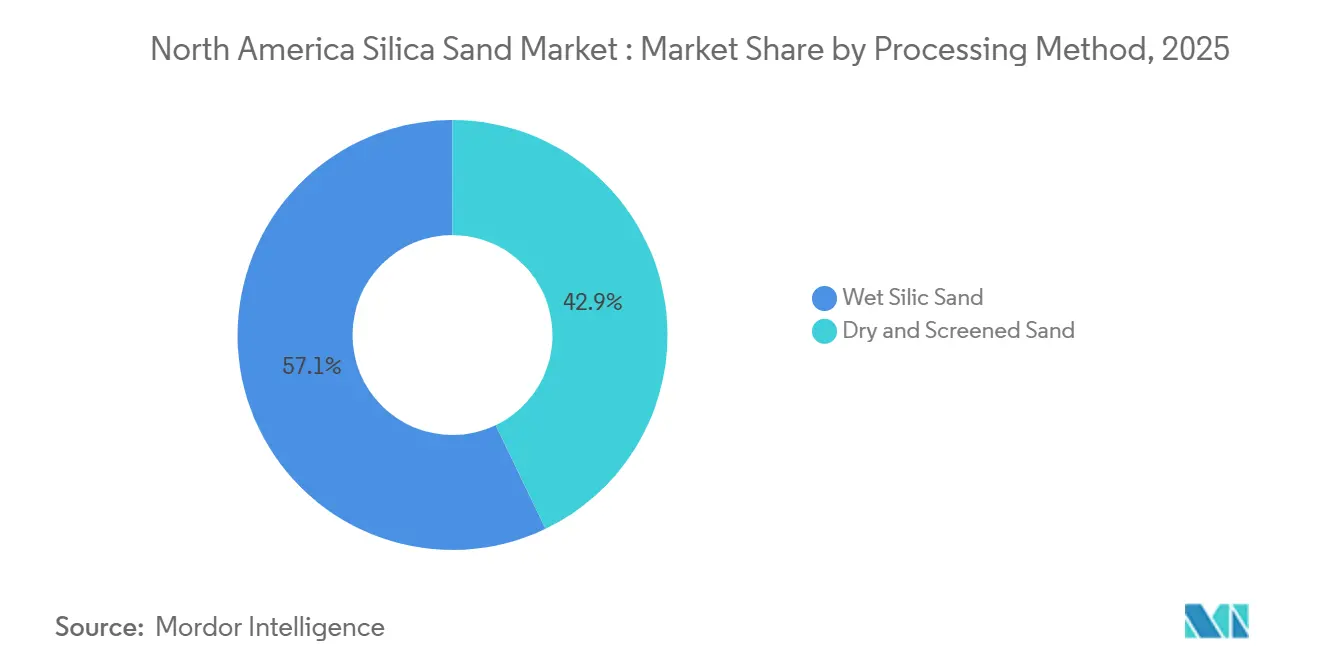
- By processing method, wet-processed silica held a 57.12% revenue share in 2025, and dry and screened sand is projected to grow at a 4.98% CAGR during the forecast period (2026-2031).
- By geography, the United States commanded a 77.99% market share in 2025, whereas Mexico is set to register the fastest 4.85% CAGR during the forecast period (2026-2031).
Note: Market size and forecast figures in this report are generated using Mordor Intelligence’s proprietary estimation framework, updated with the latest available data and insights as of 2026.
North America Silica Sand Market Trends and Insights
Drivers Impact Analysis*
| Driver | (~) % Impact on CAGR Forecast | Geographic Relevance | Impact Timeline |
|---|---|---|---|
| Foundry-casting output recovery | +0.80% | United States (Ohio, Michigan, Wisconsin, Pennsylvania) | Medium term (2-4 years) |
| Shale rig-count up-cycle and in-basin frac sand | +1.20% | United States (Permian, Eagle Ford, Marcellus) | Short term (≤ 2 years) |
| Infrastructure-led construction sand needs | +0.90% | United States, Canada, Mexico | Medium term (2-4 years) |
| Semiconductor-grade HP-silica reshoring | +1.10% | United States (North Carolina, New York, Michigan) | Long term (≥ 4 years) |
| Closed-loop sand-reuse pilots at E&Ps | +0.30% | United States (Permian, Marcellus, Eagle Ford) | Medium term (2-4 years) |
| Source: Mordor Intelligence | |||


Foundry-Casting Output Recovery
The American Foundry Society projects casting sales to rise 1.9% in 2025 and 4.1% in 2026, then average 4.6% a year to 2030[1]American Foundry Society, “2025-2030 Market Forecast,” afsinc.org. Forty-one percent of US foundries reported order gains tied to reshoring, and 96% plan capital spending in 2026, signaling sustained silica demand for molds. Foundry-grade sand usage tracks ton-for-ton with ferrous castings, so a USD 52 billion domestic foundry sector concentrated near Midwestern sand deposits cuts inbound freight and tightens supply chains. Smaller shops face higher gas costs that could temper sand intensity if electric-arc melting spreads, yet proximity advantages and rising automotive lightweighting favor steady growth in the North America silica sand market.
Shale Rig-Count Up-Cycle and In-Basin Frac Sand
Permian proppant needs climbed from 14 million tons in 2016 to almost 80 million tons in 2025, equaling 60% of US demand. Lateral lengths now average 10,000-15,000 tons of sand per well, keeping near-term pull firm despite a January 2026 rig count of 546, down 36 year-over-year[2]Baker Hughes, “North America Rig Count, Jan 30 2026,” bakerhughes.com. In-basin brown sand prices run USD 10-15 per ton below Northern White and meet crush thresholds for moderate depths, spurring capacity additions like Wallstreet Sand’s February 2026 Kermit plant. The dynamic compresses rail-delivered margins for Wisconsin mines and drives diversification into industrial niches within the North America silica sand market.
Infrastructure-Led Construction Sand Needs
The USD 1.2 trillion Infrastructure Investment and Jobs Act funnels USD 118 billion to the Highway Trust Fund through FY 2026, and highway outlays were up 8% in the first nine months of 2024. Construction-sand production, however, slipped to 890 million tons in 2024 amid high mortgage rates. Specialty silica supports bridge decks, masonry mortar, and asphalt fillers, with state transportation departments in Texas, California, and Florida fast-tracking tenders to obligate funds. Producers hesitate to green-light greenfield pits without multi-year offtake, but localized public spending cushions demand swings in the North America silica sand market.
Semiconductor-Grade HP-Silica Reshoring
Corning’s USD 32 million CHIPS Act grant for Canton, New York, and Hemlock Semiconductor’s USD 320 million award for ultra-high-purity polysilicon underpin domestic capacity. Spruce Pine, North Carolina, remains the world’s chief 99.99% SiO₂ source, yet the September 2024 Hurricane Helene shutdown exposed supply risk. High-purity grades fetched USD 500-17 000 per ton in 2024, reflecting tight SEMI PV17 specs and reinforcing the margin lift available to mines that install flotation, magnetic separation, and acid-leach circuits. As the North America silica sand market demand for semiconductor crucibles and photovoltaic wafers grows, producers that reach 99.999% purity can capture premium spreads.
Restraints Impact Analysis*
| Restraint | (~) % Impact on CAGR Forecast | Geographic Relevance | Impact Timeline |
|---|---|---|---|
| High logistics-cost volatility | -0.60% | United States (Permian, Eagle Ford), Canada | Short term (≤ 2 years) |
| Water-stress restrictions in arid basins | -0.40% | United States (Texas, New Mexico) | Medium term (2-4 years) |
| Cap-ex freeze among Tier-2 drillers | -0.50% | United States (Appalachia, Haynesville, Bakken) | Short term (≤ 2 years) |
| Source: Mordor Intelligence | |||
High Logistics-Cost Volatility
Rail rates for SCTG 11 industrial sand move with bulk-commodity cycles, eroding margins for northern mines shipping to Texas and Alberta. PropFlow’s wet-sand pipe claims USD 6 per-ton delivery costs yet requires fixed pipelines, limiting uptake. As operators pivot to in-basin dry sand, distant producers either swallow USD 40-60 per-ton rail spreads or pivot into filtration, glass, and specialty grades where quality premiums cover freight. Smaller firms that lack multi-year contracts absorb spot-rate spikes, tightening working capital in the North America silica sand market.
Water-Stress Restrictions in Arid Basins
Groundwater drawdown of more than 20 meters in parts of the Eagle Ford invites scrutiny under Texas Railroad Commission oversight, slowing permit turnaround. Operators recycle produced water, XRI treats 1.5 million bbl a day, to curb freshwater uptake, yet treatment costs hit USD 0.50-3.00 per bbl. OSHA’s 50 µg/m³ silica-dust exposure cap adds engineering controls that weigh heaviest on small mines. Together, these factors restrain proppant growth, though industrial users remain less exposed, moderating the overall drag on the North America silica sand market.
*Our forecasts treat driver/restraint impacts as directional, not additive. The impact forecasts reflect baseline growth, mix effects, and variable interactions.
Segment Analysis
By End-User Industry: Filtration Surges Amid Proppant Scale
Oil and Gas held 51.89% of the 2025 volume, confirming its anchor role in the North America Silica Sand market share. Filtration and Water Treatment, however, is set to outpace at 5.31% CAGR through 2031 as cities replace aging plants to meet Safe Drinking Water Act thresholds.
Glass manufacturing ranks second, demanding sand above 98% SiO₂ and iron below 0.03% Fe₂O₃, specs that in-basin brown sand rarely meets and which sustain Northern White premiums. Foundry applications were boosted with casting growth tied to automotive lightweighting and reshoring. Chemicals, ceramics, coatings, and niche recreational uses round out demand, each rewarding mesh-size and purity tailoring. The North America silica sand market size allocated to filtration and glass, therefore, looks positioned for consistent expansion, insulating miners from proppant cyclicality.


By Product Form: High-Purity Grades Lift Margins
Northern White supplied 40.88% of 2025 tonnage, anchoring deep-well proppant, glass, and foundry channels. High-purity silica exceeding 99.9% SiO₂ will grow 5.51% a year to 2031, buoyed by semiconductor and photovoltaic demand that values tight metal specs.
In-basin brown sand, selling USD 10-15 per ton cheaper, commands a proppant share for moderate depths but remains unsuitable for glass or semiconductor use. Value lies in beneficiation: magnetic separation, flotation, and acid-leach lines upgrade lower-grade feed into glass or high-purity outputs, capturing USD 50-100 per-ton margins. That margin lift shifts revenue mix across the North America silica sand industry even.
By Mesh/Grain Size: Ultra-Fine Demand Accelerates
The 70-120 mesh band contributed 39.20% of 2025 shipments, straddling proppant, foundry, and filter uses. Ultra-fine grades above 200 mesh will expand 5.10% CAGR through 2031 on growth in architectural coatings, CMP slurries, and 3D-print resins.
Sub-70 mesh volumes fade with shallow-well drilling decline, whereas 120-200 mesh bridges fiberglass and specialty concrete. Fumed silica at the nanoscale remains a tiny tonnage lever yet earns outsized pricing. Mesh versatility enables mines to swing between proppant and specialty contracts, keeping utilization high and stabilizing cash flow across the North America Silica Sand market.
By Processing Method: Wet Circuits Dominate but Dry Uptake Rises
Wet processing retained 57.12% of 2025 output for its low-clay, tight-grade profile favored in glass, filtration, and high-purity markets. Water and energy inputs add USD 3-5 per ton, but end-users pay USD 5-10 premiums.
Dry and screened sand is expected to grow with a 4.98% CAGR during the forecast period (2026-2031), as Permian operators value storage life and truck logistics; Wallstreet Sand’s Kermit plant opened in February 2026 with 1.5 million t/y capacity. Wet-plant owners that bolt on dry lines hedge demand swings, while compliance with OSHA dust caps raises capex for all operators. A hybrid approach best positions suppliers to capture the distributed growth of the North America silica sand market.
Geography Analysis
The United States delivered 77.99% of 2025 production, leveraging Wisconsin and Illinois Northern White reserves plus vast Permian and Eagle Ford in-basin capacity. US Silica posted USD 1.05 billion in revenue in the first nine months of 2024, with Industrial & Specialty Products up 7% year-over-year, illustrating the pivot toward stable margins. Highway outlays rising under the IIJA and CHIPS Act incentives for high-purity silica underpin multi-year domestic demand.
Canada trails on volume, constrained by slower oil-sands drilling and scarce high-purity quartz. Source Energy Services moved 3.53 million tons in 2024, blending Wisconsin imports with Alberta feed, yet rail adds USD 40-60 per ton, and rig counts slipped to 232 in January 2026. Construction sand for Ontario and British Columbia roads lacks the scale to offset oil-patch softness.
Mexico will rise at a 4.85% CAGR to 2031 as near-shoring inflates glass and construction demand. Vitro’s container and flat-glass lines consume 98% SiO₂ sand, much imported from Texas mines with rail or Gulf marine access. Industrial park expansions in Nuevo León, Guanajuato, and Jalisco catalyze specialty demand, offering US producers incremental outlets. This geographic mosaic broadens the customer base and underpins the long-run growth of the North America silica sand market.
Competitive Landscape
The North America Silica Sand market is moderately fragmented. Disrupters like Wallstreet Sand compete on in-basin dry supply, shaving trucking miles and shortening order cycles. Producers installing wet beneficiation plus dry circuits can pivot across glass, foundry, filtration, and proppant customers, smoothing utilization. Technical certifications such as SEMI PV17 or NSF/ANSI 61 act as moats; firms that secure both expand addressable share in the North America silica sand market without necessarily expanding tons.
North America Silica Sand Industry Leaders
Badger Mining Corporation
Covia Holdings LLC
U.S. Silica
Atlas Energy Solutions
SmartSand, Inc.
- *Disclaimer: Major Players sorted in no particular order

Recent Industry Developments
- February 2026: Sio Silica, an Alberta-based company, partnered with the University of Manitoba to launch a groundwater monitoring network. This move comes as Sio Silica intensifies its efforts to extract sand from the sandstone aquifer located beneath the Rural Municipality of Springfield in Manitoba.
- February 2026: India formally joined the Pax Silica agreement with the United States. This strategic partnership aims to secure the entire silicon supply chain, from mineral extraction to AI chip manufacturing, to counter China's dominance in the market.


North America Silica Sand Market Report Scope
Silica sand is a type of sand with high silicon dioxide (SiO2) content. It is a naturally occurring material that is found in many parts of the world. Silica sand is used in a variety of applications, including glassmaking, foundries, and fracking, among others.
The North America Silica Sand Market is segmented by end-user industry, product form, mesh/grain size, processing method, and geography. The end-user industry segment includes glass manufacturing, foundry, chemical production, construction materials, paints and coatings, ceramics and refractories, filtration and water treatment, oil and gas, and other niche uses. By product form, the market is segmented into natural frac sand, northern white sand, in-basin brown sand, glass-grade sand, foundry-grade sand, and high-purity sand (more than 99.9% SiO2). By mesh/grain size, the market is segmented into less than 70 mesh, 70-120 mesh, 120-200 mesh, and more than 200 mesh. By processing method, the market is segmented into wet silic sand and dry and screened sand. The report also covers the market size and forecasts for the North American silica sand market in 3 countries across the North American region. For each segment, the market sizing and forecasts are provided on the basis of volume (tons).
| Glass Manufacturing |
| Foundry |
| Oil and Gas (Frac/Proppant) |
| Construction Materials |
| Filtration and Water Treatment |
| Chemicals Production |
| Ceramics and Refractories |
| Paints and Coatings |
| Other Niche Uses |
| Natural Frac Sand |
| Northern White Sand |
| In-Basin Brown Sand |
| Glass-Grade Sand |
| Foundry-Grade Sand |
| High-Purity Silica (more than 99.9% SiO₂) |
| less than 70 Mesh |
| 70-120 Mesh |
| 120-200 Mesh |
| more than 200 Mesh |
| Wet Silic Sand |
| Dry and Screened Sand |
| United States |
| Canada |
| Mexico |
| By End-User Industry | Glass Manufacturing |
| Foundry | |
| Oil and Gas (Frac/Proppant) | |
| Construction Materials | |
| Filtration and Water Treatment | |
| Chemicals Production | |
| Ceramics and Refractories | |
| Paints and Coatings | |
| Other Niche Uses | |
| By Product Form | Natural Frac Sand |
| Northern White Sand | |
| In-Basin Brown Sand | |
| Glass-Grade Sand | |
| Foundry-Grade Sand | |
| High-Purity Silica (more than 99.9% SiO₂) | |
| By Mesh/Grain Size | less than 70 Mesh |
| 70-120 Mesh | |
| 120-200 Mesh | |
| more than 200 Mesh | |
| By Processing Method | Wet Silic Sand |
| Dry and Screened Sand | |
| By Geography | United States |
| Canada | |
| Mexico |


Key Questions Answered in the Report
How large is the North America silica sand market in 2026?
Supply stands at 43.00 million tons in 2026, on track to reach 53.80 million tons by 2031 at a 4.58% CAGR.
Which end-user is growing fastest in North America?
Filtration and Water Treatment leads growth at 5.31% CAGR to 2031 as utilities upgrade plants.
Why are high-purity silica grades gaining traction?
CHIPS Act funding for domestic semiconductor capacity and photovoltaic wafer demand is driving 5.51% CAGR in high-purity volumes.
What is the outlook for in-basin Permian sand?
Despite lower rig counts, completions and cost advantages keep in-basin dry sand in demand, supporting near-term shipments.
How will Mexican demand influence regional trade flows?
Near-shoring-driven glass and construction projects lift Mexican imports, benefiting Texas and New Mexico mines able to meet 98% SiO₂ specs.
Page last updated on:


