Fumed Silica Market Size and Share
Market Overview
| Study Period | 2021 - 2031 |
|---|---|
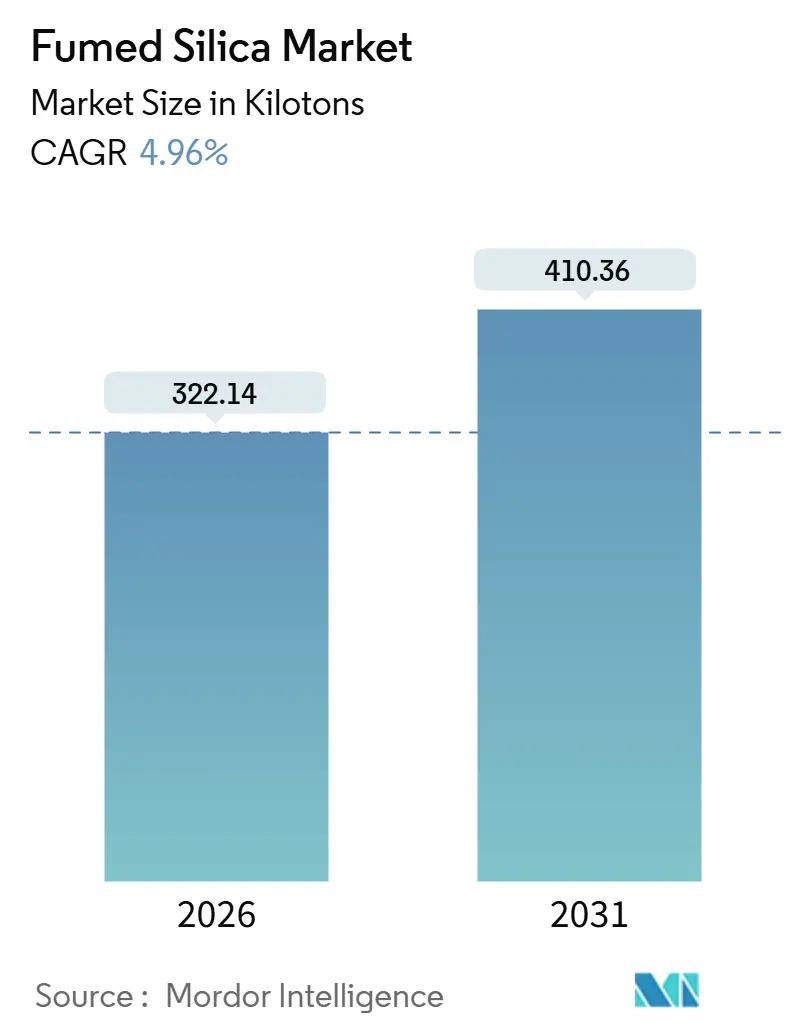
| Market Volume (2026) | 322.14 kilotons |
| Market Volume (2031) | 410.36 kilotons |
| Growth Rate (2026 - 2031) | 4.96% CAGR |
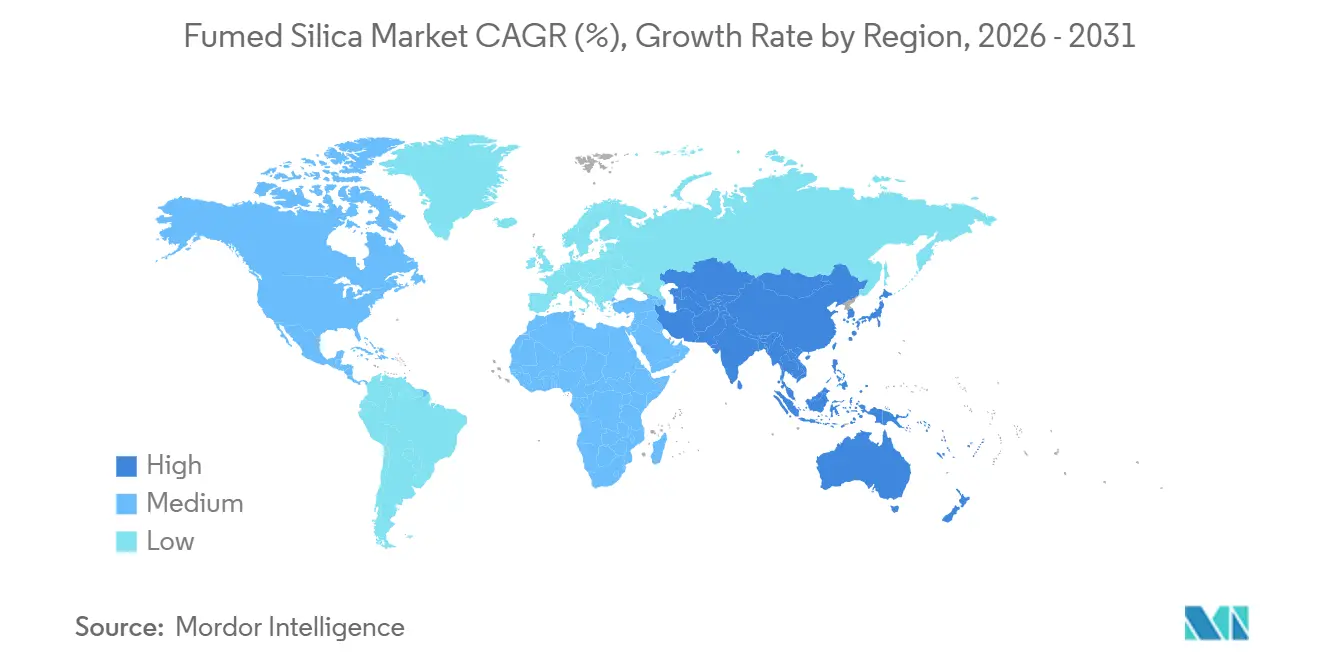
| Fastest Growing Market | Asia Pacific |
| Largest Market | Asia Pacific |
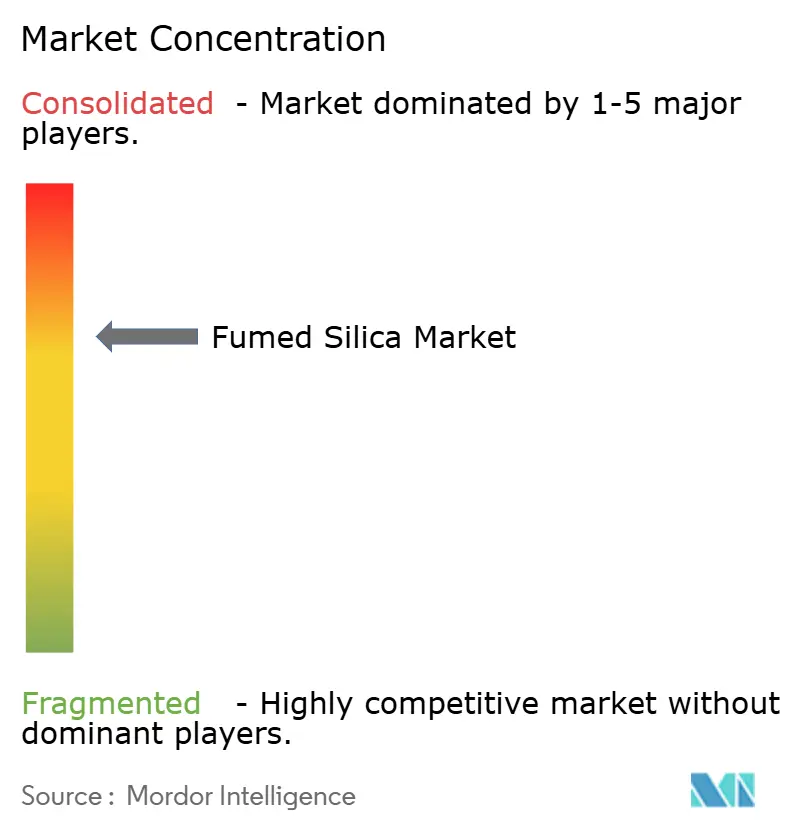
| Market Concentration | Medium |
Major Players *Disclaimer: Major Players sorted in no particular order Image © Mordor Intelligence. Reuse requires attribution under CC BY 4.0. | |
Fumed Silica Market Analysis by Mordor Intelligence
The Fumed Silica Market size is estimated at 322.14 kilotons in 2026, and is expected to reach 410.36 kilotons by 2031, at a CAGR of 4.96% during the forecast period (2026-2031). Momentum stems from rising silicone‐elastomer loading in consumer electronics, regulatory moves that favor waterborne coatings, and higher purity requirements across pharmaceutical and personal-care excipients. Flame hydrolysis keeps cost leadership in commodity grades, yet plasma and arc vapor oxidation are gaining traction in aerospace and semiconductor niches where impurity limits are tight. Asia-Pacific remains the demand epicenter thanks to electric-vehicle battery encapsulants and CMP slurries, while Europe wrestles with energy costs and looming carbon tariffs. Supply dynamics are shaped by Western consolidation in specialty grades, parallel capacity scale-ups in China, and persistent SiCl₄ feedstock volatility that compresses margins when polysilicon output stalls.
Key Report Takeaways
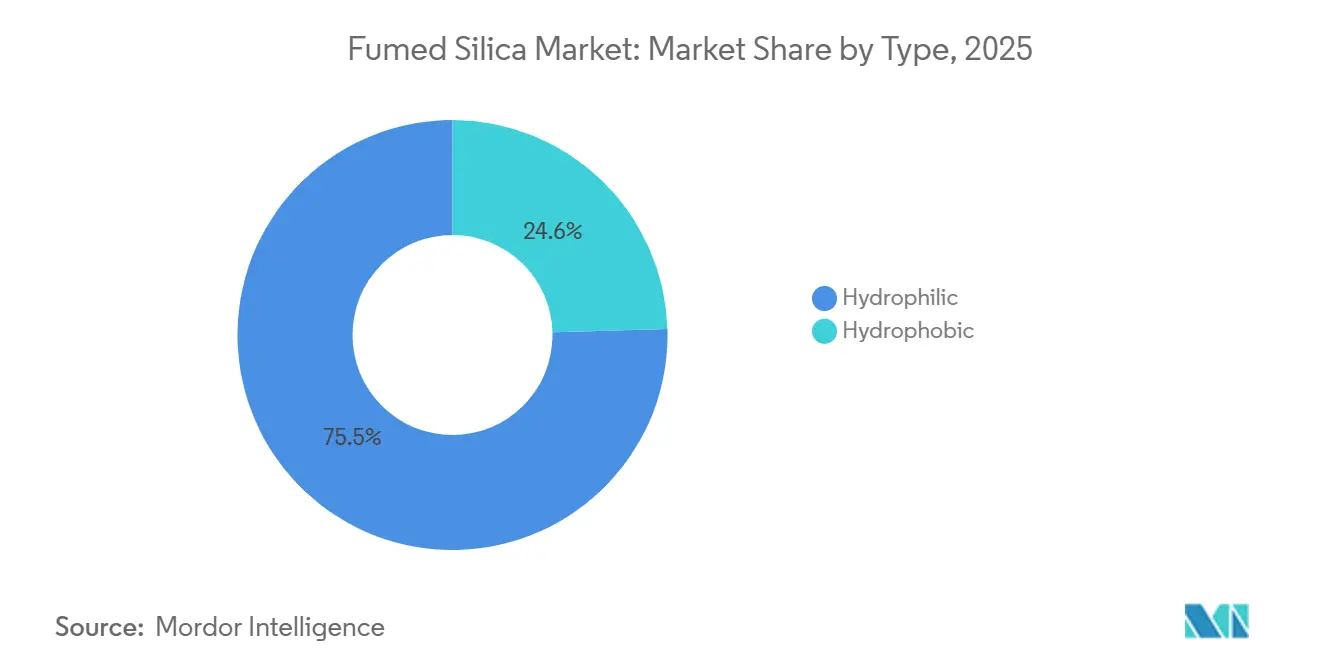
- By type, hydrophilic grades controlled 75.45% of 2025 volume and are forecast to advance at 5.45% annually through 2031.
- By production process, flame hydrolysis produced 72.36% of the 2025 output, yet plasma and arc vapor oxidation routes will post the fastest 5.92% CAGR to 2031.
- By function, rheology control and thickening functions captured 45.31% share in 2025 and are set to rise at 5.61% annually through 2031.
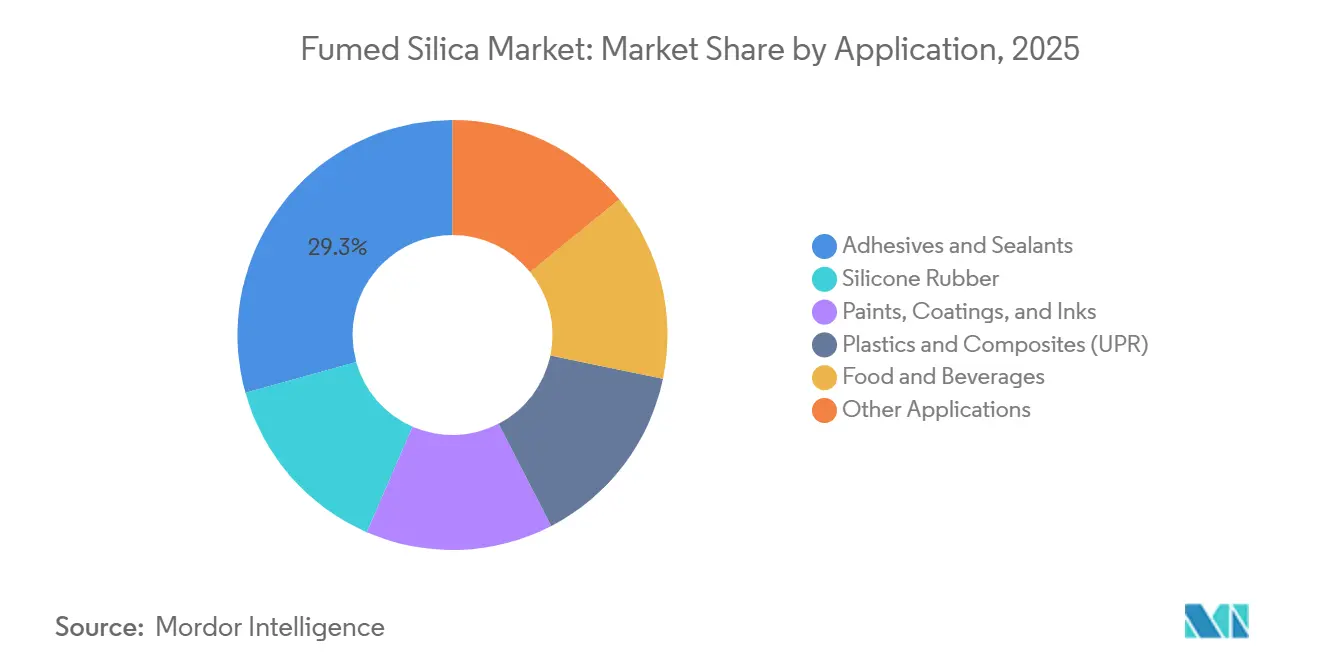
- By application, adhesives and sealants led absolute demand with a 29.33% share and a 5.78% CAGR outlook.
- Asia-Pacific accounted for 48.15% of the 2025 volume and is projected to grow at 5.18%.
Note: Market size and forecast figures in this report are generated using Mordor Intelligence’s proprietary estimation framework, updated with the latest available data and insights as of January 2026.
Global Fumed Silica Market Trends and Insights
Drivers Impact Analysis*
| Drivers | (~) % Impact on CAGR Forecast | Geographic Relevance | Impact Timeline |
|---|---|---|---|
| Consumer-electronics–led boom in silicone elastomers (Asia) | +1.2% | Asia-Pacific core, spill-over to North America | Medium term (2-4 years) |
| Demand surge from paints and coatings reformulations | +0.9% | Global, with EU and North America leading regulatory adoption | Short term (≤ 2 years) |
| Rapid growth in pharmaceuticals and personal-care formulations | +0.8% | Global, concentrated in North America, Europe, and India | Medium term (2-4 years) |
| Penetration of 3-D-printed photopolymer resins | +0.5% | North America and Europe, early adoption in Asia-Pacific | Long term (≥ 4 years) |
| Aerospace-grade aerogel composites require ultra-pure silica | +0.4% | North America and Europe, limited to defense and space sectors | Long term (≥ 4 years) |
| Source: Mordor Intelligence | |||


Consumer Electronics Boom in Silicone Elastomers
As smartphones, wearables, and automotive infotainment modules shrink in size, the demand for silicone encapsulants, specifically those with fumed silica loading for enhanced thixotropy and reinforcement, has surged. In Asia, assembly lines for electric two- and three-wheelers are now utilizing hydrophobic-grade thermal gap fillers, effectively preventing phase separation during the curing process.[1]SAE International, “Thermal Management of Electric Two-Wheeler Battery Modules,” sae.org In 2023, Elkem activated a production line in Shanghai, aiming to localize the supply of electronics-grade silicone adhesives. The rise of flexible OLEDs in South Korea is propelling the demand for ultra-low-viscosity silicone gels, which require nano-silica to maintain optical clarity during repetitive bending. Each hinge assembly demands precise rheology tuning, a feat that precipitated silica falls short of, leading to a deeper penetration of fumed silica in consumer devices.
Demand Surge from Paint and Coating Reformulations
Architectural and industrial formulators are pivoting to waterborne systems that depend on fumed silica to retain brushability without high-VOC solvents, a switch hastened by South Coast AQMD Rule 1113 limits. Evonik’s AEROSIL E2D grades, commissioned in June 2024, enable faster mixing in waterborne coatings. Draft EU Ecolabel criteria released in February 2025 emphasize low-dust raw materials, indirectly favoring pyrogenic silica over coarse precipitated grades. Automotive OEM coatings in China and India are migrating to high-solids polyurethane systems reinforced with hydrophobic silica to prevent sag on vertical panels. The cumulative shift sustains growth in the fumed silica market through the forecast period.
Rapid Growth in Pharmaceuticals and Personal-Care Formulations
The United States FDA and EFSA reaffirmed silica’s safety limits in food and nutraceuticals during 2024, unlocking broader use in powder blends and controlled-release tablets. Cosmetic makers face a 2025 EU nano-ingredient notice mandate that intensifies scrutiny of particle size, steering formulators toward consistently produced hydrophilic grades. Indian generics manufacturers are upgrading excipient technology to meet export benchmarks, spurring robust local uptake. Microencapsulation of probiotics now blends nano-silica with lipophilic carriers to improve shelf life under tropical conditions. These factors combine to add nearly a percentage point to the global CAGR.
Penetration of 3D-Printed Photopolymer Resins
In 2024, academic tests revealed that dental resins infused with nano-silica achieved a flexural strength suitable for interim crowns. Nano-silica is pivotal in balancing viscosity and cure depth for products like dental prosthetics, hearing-aid shells, and aerospace jigs crafted through DLP and SLA. Evonik's AEROSIL FP series bolsters the strength of green parts without causing viscosity fluctuations during extended print sessions. Meanwhile, resin manufacturers across Europe are now opting for hydrophobic grades to prevent moisture absorption during storage, thereby prolonging pot life. As the realm of additive manufacturing transitions from mere prototypes to full-scale serial production, the demand for fumed silica is witnessing a robust and sustained upswing.
Restraints Impact Analysis*
| Restraints | (~) % Impact on CAGR Forecast | Geographic Relevance | Impact Timeline |
|---|---|---|---|
| Price volatility of SiCl₄ feedstock | -0.6% | Global, with Asia-Pacific most exposed due to polysilicon co-production cycles | Short term (≤ 2 years) |
| Low-cost precipitated silica capacity additions | -0.5% | Asia-Pacific and China specifically, limited impact in specialty grades | Medium term (2-4 years) |
| High energy intensity of flame hydrolysis vs plasma reactors | -0.3% | Global, concentrated in regions with high electricity costs (Europe, Japan) | Long term (≥ 4 years) |
| Source: Mordor Intelligence | |||
Price Volatility of SiCl₄ Feedstock
SiCl₄ supply hinges on polysilicon utilization cycles, so fumed silica producers endure margin pressure when solar demand softens, and chlorosilane by-product output falls, lifting spot prices[2]Cabot Corporation, “Form 10-K 2024,” cabot-corp.com. Producers increasingly explore recycling loops that convert waste streams back into SiCl₄ to curb exposure. The absence of transparent benchmarks complicates long-term supply contracts, forcing many adhesive formulators onto quarterly adjustments that erode predictability.
Low-Cost Precipitated Silica Capacity Additions
Chinese plants, launching with lower capex, are bridging the cost-performance divide in basic rheology and anti-caking applications. Evonik is committed to a precipitated silica expansion in Charleston, South Carolina, starting operations in 2026 to serve tire rubber markets. While precipitated grades cannot replicate the reinforcement of hydrophobic fumed silica in high-performance silicone rubber, price-sensitive paint makers in Latin America blend both materials to reduce raw-material bills. The substitution risk is most visible in hydrophilic anti-settling uses where particle tolerances are broader.
*Our forecasts treat driver/restraint impacts as directional, not additive. The impact forecasts reflect baseline growth, mix effects, and variable interactions.
Segment Analysis
By Type: Hydrophilic Grades Dominate Pharma and Food
Hydrophilic grades captured 75.45% of 2025 demand, and this share aligns with a robust 5.45% CAGR to 2031 as pharmaceutical and nutraceutical makers favor unmodified surfaces governed by FDA 21 CFR 172.480 and EFSA E 551 rules. Hydrophobic variants, treated with silanes, address moisture-sensitive silicone rubber and non-polar coatings but grow at a slower clip due to a higher cost per reinforcement unit.
Hydrophilic expansion is evident in India, where tablet makers specify fine-grade silica to stabilize active ingredients during export transit. Hydrophobic adoption surges in wind-turbine blade adhesives and 3D-printing resins, aided by Tokuyama’s 2024 capacity boost in Zhejiang. Evonik’s easier-dispersing hydrophilic E2D line lets waterborne paint formulators cut mixing time by one-fifth, tightening process economics. The fumed silica market size for hydrophobic grades in silicone rubber still commands premiums because precipitated substitutes cannot match tensile strength targets above 8 MPa.

By Production Process: Plasma Routes Gain in Specialty Niches
Flame hydrolysis generated 72.36% of the 2025 output, keeping it dominant in rheology control. Plasma and arc vapor oxidation will, however, outpace at 5.92% CAGR as aerospace aerogels and CMP slurries demand ultra-pure particles free of metallic contaminants. Plasma units meet sub-10 ppm impurity thresholds required by semiconductor fabs in South Korea and Taiwan, reinforcing a specialty moat.
Despite higher capex, plasma modules integrate with renewable power and lower carbon footprints, attributes attractive under Europe’s impending CBAM tariff. Flame operators in Germany trial green hydrogen burners but face limited electrolyzer supply. Arc vapor oxidation throughput lags by roughly threefold versus flame, so its commercial deployment remains confined to high-value defense composites. The fumed silica market size for plasma grades should therefore remain small in absolute tonnage, though strategically important.
By Function: Rheology Control Leads Across Applications
Rheology control and thickening led 2025 demand with 45.31% share, supported by waterborne coatings and high-solids adhesives that need shear-thinning flow. This slice advances at 5.61% through 2031 and accounts for the largest fumed silica market size by function in 2031. Anti-settling and anti-caking trail with a significant share, serving powder foods and agrochemicals in humid climates.
Silicone rubber reinforcements see tempered growth, yet they command a premium due to hydrophobic grades achieving high tensile strengths with appropriate loadings. Evonik's grades showcase a leap in innovation, enabling a reduction in silica dosage to hit viscosity benchmarks, thus slashing costs. While paint formulators are turning to precipitated silica in budget-conscious segments, hydrophobic fumed silica continues to reign supreme in automotive refinishing, where even a slight vertical sag is unacceptable.
By Application: Adhesives and Sealants Lead Volume Growth
Adhesives and sealants absorbed 29.33% of the 2025 volume and will grow at 5.78%, underpinned by Asian construction and automotive lightweighting. In battery-electric vehicles, structural adhesives use silica to maintain bond-line thickness during robotic application. Silicone rubber is crucial for gaskets and medical tubing, ensuring biocompatibility at a continuous service temperature of 200 °C.
Paints and inks are poised for growth as European architectural formulators cut back on VOCs. While plastics and composites maintain their share, they grapple with competition from hollow glass microspheres. The food and beverage sector is gaining momentum, especially in instant drink mixes across Southeast Asia. Meanwhile, other lucrative segments like pharmaceuticals, personal care, and 3D printing are expanding rapidly, marking them as promising profit centers in the fumed silica market.

Geography Analysis
Asia-Pacific owned 48.15% of the 2025 volume and grew at 5.18% through 2031, driven by CMP slurry demand for logic fabs, battery encapsulants in China, and rising nutraceutical production in India. Tokuyama’s Zhejiang plant powers localized supply of surface-treated grades for automotive coatings, while OCI’s Gunsan unit feeds South Korean sealant and secondary battery lines. Japan experiments with green hydrogen for flame hydrolysis, yet faces scale constraints.
North America carried growth on the back of NASA aerogel projects and stricter VOC caps in architectural paints. Wacker’s Charleston, Tennessee, plant supplies silicone rubber compounds, and Evonik’s new precipitated silica line in South Carolina hints at substitution pressure in low-tier segments. Canada and Mexico trail but log near 5% growth linked to automotive assembly.
Energy costs and looming CBAM carbon tariffs limit Europe's growth. Evonik’s Rheinfelden E2D facility offers waterborne-friendly grades that cut mixing energy by one-fifth. Draft EU Ecolabel criteria and potential STOT RE 1 classification in the Netherlands raise compliance expenses for paint makers, yet aerospace aerogel funding under CORDIS keeps specialty demand resilient.

Competitive Landscape
The fumed silica market is moderately consolidated. Western leaders double down on high-margin niches while Chinese firms scale commodity hydrophilic output for anti-caking and basic rheology uses. Plasma-route entrants pursue ultra-pure aerogel and semiconductor applications, threatening flame hydrolysis incumbents long-term. Handling SiCl₄ price swings becomes decisive; closed-loop chlorosilane recycling pilots aim to steady margins. Bio-based rice-husk silica emerges as a sustainability wildcard but still falls short on impurity control. Overall, technology differentiation and regional proximity to downstream users guide investment, shaping how the fumed silica market evolves through the decade.
Fumed Silica Industry Leaders
Evonik Industries AG
Cabot Corporation
Wacker Chemie AG
Tokuyama Corporation
OCI Ltd.
- *Disclaimer: Major Players sorted in no particular order

Recent Industry Developments
- May 2025: HPQ Silicon Inc., confirmed pilot-scale production of fumed silica with its proprietary plasma reactor and plans to lift capacity to 50 tons/year.
- January 2025: Evonik Industries AG launched the Smart Effects business line after merging its Silica and Silanes units to target automotive, electronics, and consumer health markets
- June 2024: Evonik Industries AG commissioned a dispersion-technology plant in Rheinfelden for AEROSIL Easy-to-Disperse grades suitable for paint and coating formulations


Research Methodology Framework and Report Scope
Market Definitions and Key Coverage
Our study defines the fumed silica market as the global supply of pyrogenic, nano-scale amorphous silica powders produced through flame hydrolysis of silicon tetrachloride or quartz and sold in primary form to downstream users who disperse the material into silicone rubbers, coatings, inks, sealants, batteries, and pharmaceutical formulations. According to Mordor Intelligence analysts, this definition purposely excludes precipitated silica, silica gel, colloidal silica, and post-treated siloxane blends, so volume signals remain tied to the unique high-surface-area grade sold as "fumed" silica.
Scope exclusion: Our sizing removes precipitated silica, silica gel, and recycled siloxane derivatives.
Segmentation Overview
- By Type
- Hydrophilic
- Hydrophobic
- By Production Process
- Flame Hydrolysis
- Plasma/Arc Vapor Oxidation
- By Function
- Rheology Control/Thickening
- Anti-settling/Anti-caking
- Reinforcement/Filler
- By Application
- Silicone Rubber
- Adhesives and Sealants
- Paints, Coatings, and Inks
- Plastics and Composites (UPR)
- Food and Beverages
- Other Applications (Pharmaceuticals and Personal Care, etc.)
- By Geography
- Asia-Pacific
- China
- India
- Japan
- South Korea
- Rest of Asia-Pacific
- North America
- United States
- Canada
- Mexico
- Europe
- Germany
- United Kingdom
- France
- Italy
- Rest of Europe
- South America
- Brazil
- Argentina
- Rest of South America
- Middle-East and Africa
- Saudi Arabia
- South Africa
- Rest of Middle-East and Africa
- Asia-Pacific
Detailed Research Methodology and Data Validation
Primary Research
Multiple interviews with procurement managers at adhesive formulators, operations staff at regional fumed silica makers, and distributors across Asia, Europe, and the Americas helped us confirm average loading rates, emerging food-grade specifications, and regional demand shifts we have only glimpsed in secondary sources.
Desk Research
The desk phase began with our team compiling historic production, trade, and capacity data from sources such as UN Comtrade, Eurostat PRODCOM, USGS Mineral Yearbook, China Customs, and the Korea International Trade Association, which show country-level flows of silicon tetrachloride and finished fumed silica.
We then referenced industry association briefs (Silicone Industry Association of North America, Japan Silicones Industry Association), company 10-Ks, patent records fetched via Questel, and news archives on Dow Jones Factiva to benchmark technology adoption, plant debottlenecking, and typical selling prices. The sources listed are illustrative, and many additional documents were reviewed to validate patterns.
The sources listed are illustrative, and many additional documents were reviewed to validate patterns.
Market-Sizing & Forecasting
After operating rate adjustments have been cross-checked against electricity intensity benchmarks and year-end inventory shifts, the full supply balance emerges, and our top-down run sets the preliminary total in kilotons. Results are corroborated with selective bottom-up checks; for instance, sampled average selling price multiplied by shipments reported by three major suppliers, so totals never rely on a single view.
Key variables in the model include quarterly silicone rubber output, global housing completions as a proxy for sealant demand, adhesive and sealant production indices, pharmaceutical excipient consumption, and regional coatings output. A multivariate regression forecasts each driver to 2030 and then links them to per-application penetration curves, letting the model adjust if any one variable deviates materially.
Data Validation & Update Cycle
Every draft run passes a cross-tab that flags variance beyond five percentage points versus prior years or peer markets, and any anomaly triggers re-checks with respondents, followed by senior analyst review. Mordor updates the model annually, yet we are ready to run an interim refresh when material events reshape supply, so clients receive the most current baseline.
Why Our Fumed Silica Baseline Earns Decision-Makers' Confidence
Published figures for fumed silica rarely align because firms shift between value and volume lenses, fold in adjacent silica grades, or freeze their assumptions for several years, and we acknowledge these realities upfront, while Mordor's disciplined scope choice and yearly refresh provide a consistent yardstick for planning.
The main gap drivers we observe include differing inclusion of precipitated silica, inconsistent conversion factors between revenue and tonnage, reliance on unverifiable trade proxies, and optimistic capacity utilization scenarios. Our work avoids these pitfalls by anchoring inputs to verified production data and respondent-validated utilization ranges.
Benchmark comparison
| Market Size | Anonymized source | Primary gap driver |
|---|---|---|
| 320.03 kilotons (2025) | Mordor Intelligence | - |
| USD 2.0 billion (2024) | Global Consultancy A | Combines downstream dispersions and precipitated silica values and converts revenue to volume using assumed average prices |
| USD 1.59 billion (2025) | Industry Research B | Omits small Asian facilities and relies mainly on limited public company disclosures |
| USD 1.22 billion (2025) | Trade Journal C | Applies static end-use shares from 2020 and a conservative single-factor growth rate |
As the comparison shows, our current-year figure ties directly to transparent variables and is reviewed each season, giving clients a dependable midpoint that neither exaggerates upside nor underestimates demand shifts.


Key Questions Answered in the Report
How large is the fumed silica market in 2026?
It totaled 322.14 kilotons in 2026 and is forecast to reach 410.36 kilotons by 2031, registering a CAGR of 4.96%.
Which segment grows fastest through 2031?
Plasma and arc vapor oxidation, driven by aerospace and semiconductor purity needs, will post the highest 5.92% CAGR.
Why is Asia-Pacific the biggest consumer?
Regional electronics, battery, and CMP slurry demand give Asia-Pacific a 48.15% volume share in 2025 with a 5.18% growth trajectory.
What risk does SiCl₄ pricing pose?
Tight polysilicon cycles can raise SiCl₄ costs and shave as much as 0.6 percentage points off the global CAGR.
How will VOC regulations influence demand?
Tightening limits in coatings spur waterborne formulations that rely on fumed silica for sag control, adding 0.9 percentage points to forecast CAGR.
Page last updated on:


