Market Overview
| Study Period | 2020 - 2031 |
|---|---|
| Forecast Data Period | 2026 - 2031 |
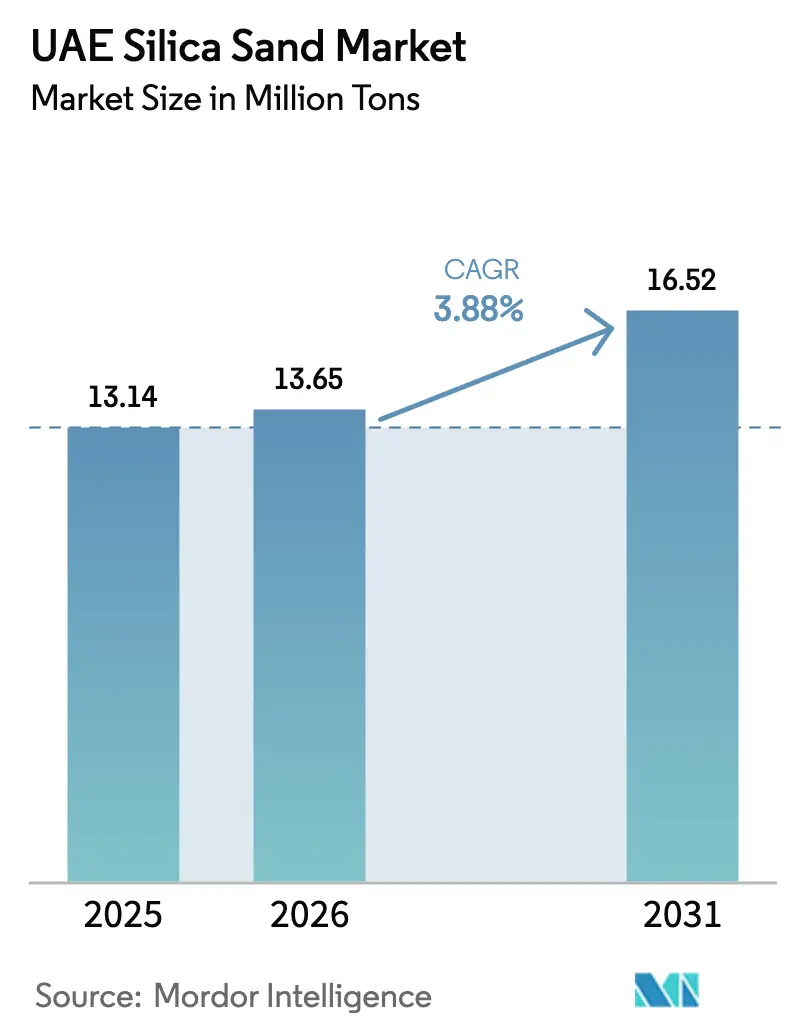
| Base Year Market Size (2025) | 13.14 Million tons |
| Market Volume (2026) | 13.65 Million tons |
| Market Volume (2031) | 16.52 Million tons |
| Growth Rate (2026 - 2031) | 3.88% CAGR |
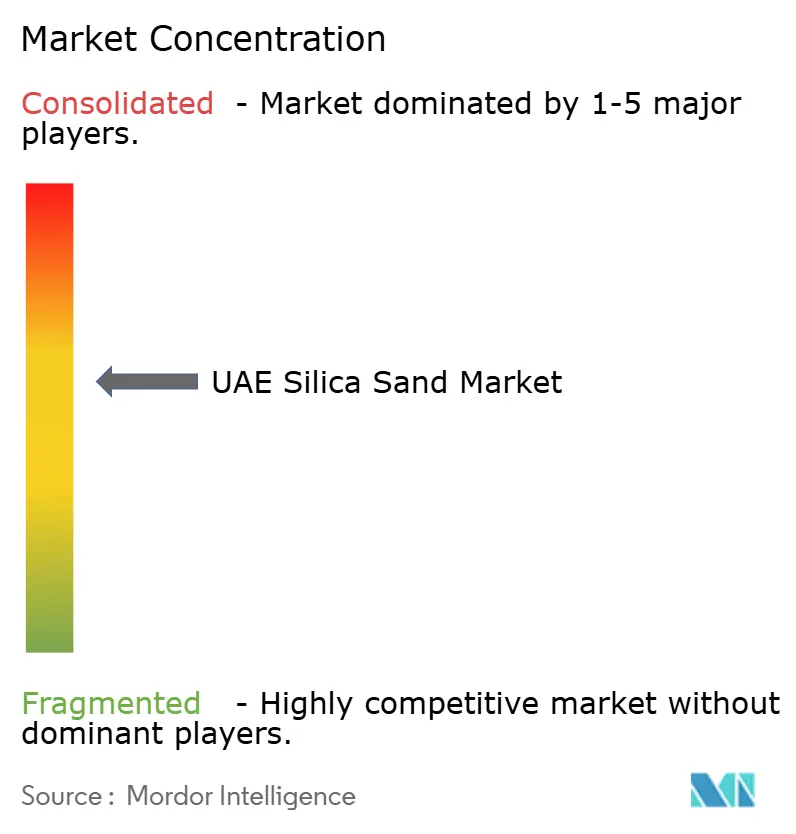
| Market Concentration | Medium |
Major Players *Disclaimer: Major Players sorted in no particular order Image © Mordor Intelligence. Reuse requires attribution under CC BY 4.0. | |
UAE Silica Sand Market Analysis by Mordor Intelligence
The UAE silica sand Market size is expected to grow from 13.14 million tons in 2025 to 13.65 million tons in 2026 and is forecast to reach 16.52 million tons by 2031 at 3.88% CAGR over 2026-2031. The demand trajectory is shifting away from bulk marine reclamation toward niche, specification-driven uses in unconventional oil and gas, solar-grade glass, and high-performance construction materials, underpinned by ADNOC’s USD 1.7 billion unconventional drilling program and Dubai’s 2040 Urban Master Plan. Record glass output from Dubai Investments, new solar glass capacity in Ras Al Khaimah, and a steady construction pipeline worth USD 130.8 billion by 2029 provide a durable demand base, while circular-economy mandates and tighter dredging rules reshape raw-material sourcing. Competitive intensity is moderate: three primary quarry operators supply most of the industrial-grade feedstock; however, emirate-level procurement policies, such as Emaar’s 99.5% local sourcing preference, drive high entry barriers. Environmental regulation is tightening under Federal Decree-Law 11/2024, creating compliance costs but also favoring players with low-carbon operations.
Key Report Takeaways
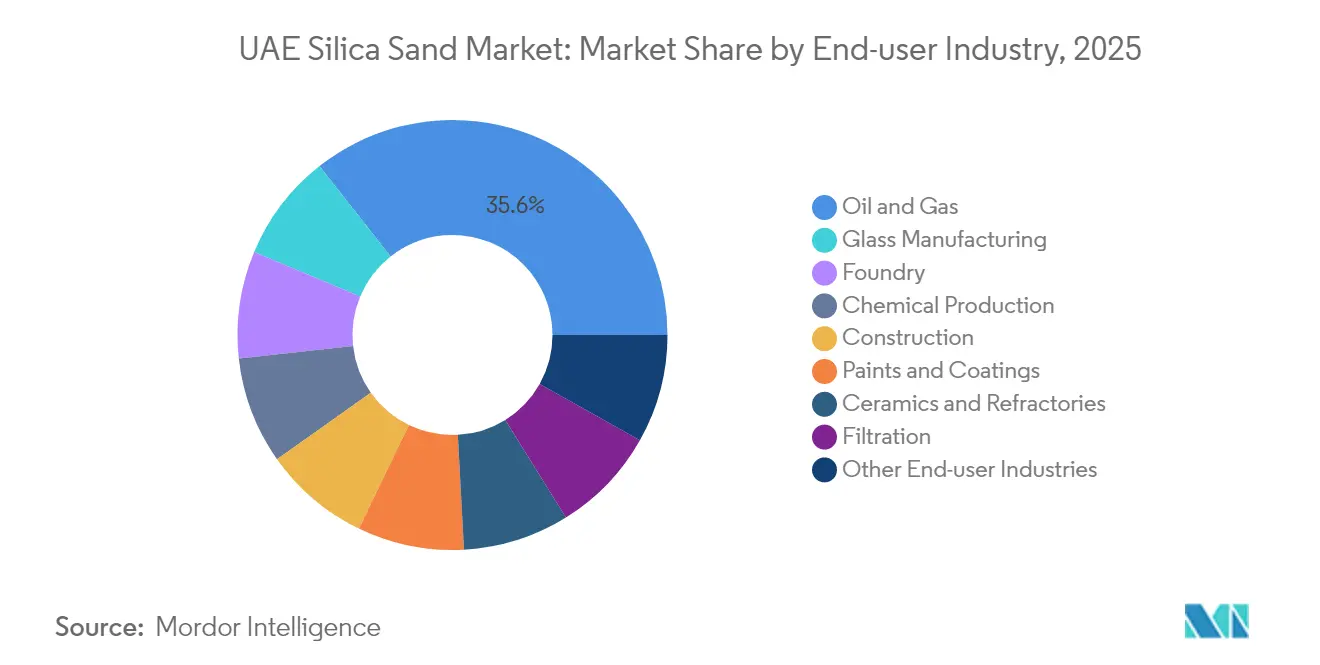
- By end-user industry, Oil and Gas held 35.62% of the UAE Silica Sand market share in 2025, supported by 144 unconventional wells scheduled for completion by Q4 2025, while Paints and Coatings is expected to expand at a 5.04% CAGR between 2026-2031, the highest among all segments.
Note: Market size and forecast figures in this report are generated using Mordor Intelligence’s proprietary estimation framework, updated with the latest available data and insights as of 2026.
UAE Silica Sand Market Trends and Insights
Drivers Impact Analysis*
| Drivers | (~) % Impact on CAGR Forecast | Geographic Relevance | Impact Timeline |
|---|---|---|---|
| Land reclamation and mega tourism projects | +0.8% | Dubai, Abu Dhabi | Medium term (2-4 years) |
| Solar-grade glass demand for PV expansion | +1.2% | Ras Al Khaimah, Dubai, Abu Dhabi | Long term ( ≥ 4 years) |
| 3D printing in construction | +0.3% | Dubai, Sharjah | Long term ( ≥ 4 years) |
| Rising frac-sand demand in oil and gas | +1.1% | Abu Dhabi onshore fields, Al Dhafra, Jebel Ali logistics hubs | Short term (≤ 2 years) |
| Infrastructure pipeline beyond Expo City | +0.9% | Dubai, Abu Dhabi, Northern Emirates | Medium term (2-4 years) |
| Source: Mordor Intelligence | |||
Land Reclamation and Mega Tourism Projects
Palm Jebel Ali’s relaunch repositions coastal engineering toward precision sand placement and beach profiling rather than indiscriminate offshore dredging, a shift codified in the Dubai 2040 Urban Master Plan[1]Gulf Business, “Jan De Nul Wins AED 810 Million Palm Jebel Ali Contract,” gulfbusiness.com. Nakheel’s AED 810 million contract, awarded to Jan De Nul in August 2024, covers 13.4 km² of reclaimed land but postpones additional offshore works until strategic environmental assessments conclude. The new approach reflects concerns over marine ecosystem stress following the development of 119 km² of reclaimed land between 2000 and 2021, with 70% of this area located in Dubai. As a result, the UAE Silica Sand market is seeing reduced low-grade bulk volumes but higher demand for processed sand that meets grain-size and environmental discharge criteria under the Dubai Environment and Climate Change Authority (DECCA) regime.
Solar-Grade Glass Demand for PV Expansion
The AED 350 million solar glass plant, inaugurated by Glass Technology FZ-LLC in April 2025, adds glass capacity sufficient for 5.5 million solar modules annually and plans to install a second furnace to double its output. The Ras Al Khaimah cluster, joined by Guardian Glass and Emirates Float Glass, consumes low-iron silica that must meet high solar transmittance standards. Dubai Investments recorded 14.8 million m² of flat glass output in 2024 and reached full utilization at its 12.6 million m² Emirates Float Glass facility. This specialized pull lifts the UAE Silica Sand market toward higher-purity product segments.
Rising Frac-Sand Demand in Oil and Gas
ADNOC’s unconventional drive, executed through the Turnwell Industries joint venture with SLB and Patterson-UTI, allocates USD 1.7 billion to drill 144 tight-reservoir wells by Q4 2025, each requiring high roundness 20/40-100 mesh frac sand. Abu Dhabi aims to produce 1 billion cubic feet per day from unconventional resources by 2030, redirecting silica demand away from low-value concrete sand to engineered proppants that can withstand high closure stresses. Regional suppliers in Saudi Arabia and Oman currently fill specification gaps, but domestic beneficiation opportunities are on the rise.
Infrastructure Pipeline Beyond Expo City
Dubai’s 2040 Urban Master Plan outlines a national housing budget of AED 65 billion, along with metro extensions and deep tunnel drainage, which will anchor multi-year demand for concrete aggregates, masonry sand, and specialty glass. The construction sector was valued at USD 107.2 billion in 2024 and is expected to reach USD 130.8 billion by 2029, bolstered by mega-schemes such as ADNOC’s USD 45 billion Al Ruwais refinery expansion, awarded in June 2024.
Restraints Impact Analysis*
| Restraints | (~) % Impact on CAGR Forecast | Geographic Relevance | Impact Timeline |
|---|---|---|---|
| Substitute aggregates and plastics | -0.6% | Abu Dhabi, Dubai, nationwide | Medium term (2-4 years) |
| Tighter dredging and environmental rules | -0.9% | Dubai coastal zones, nationwide | Short term (≤ 2 years) |
| Sand-free building materials (polymers) | -0.4% | Dubai, Abu Dhabi | Long term ( ≥ 4 years) |
| Source: Mordor Intelligence | |||
Substitute Aggregates and Plastics
MOCCAE Resolution 21/2019 permits contractors to fulfill up to 40% of road-paving and earth-filling material needs with recycled aggregates, undercutting virgin sand demand. Although Abu Dhabi generated 3.7 million tons of construction and demolition waste in 2019, uptake in circular sand remains below potential. The Circular Economy Policy 2021-2031 builds upon this mandate by layering 22 policies, incentivizing the use of lower-carbon and lower-cost secondary materials. Academic trials on the Dibba-Masafi roadway achieved a 70% cost savings and 87% landfill diversion through the use of recycled asphalt blends.
Tighter Dredging and Environmental Rules
Federal Decree-Law 11/2024 introduces mandatory greenhouse-gas measurement, reporting, and verification for all UAE entities, effective May 2025, with fines of up to AED 2 million for non-compliance[2]UAE Legislation Portal, “Federal Decree-Law 11/2024 on Climate Change,” uaelegislation.ae. Dubai’s Law 11/2024 established DECCA, centralizing environmental permitting and imposing a moratorium on offshore reclamation pending strategic assessments. Cabinet Resolution 67/2024 sets a 0.5 million tons CO₂-equivalent threshold for mandatory reporting and creates a National Carbon Credit Registry, adding compliance costs to sand extraction and processing.
*Our forecasts treat driver/restraint impacts as directional, not additive. The impact forecasts reflect baseline growth, mix effects, and variable interactions.
Segment Analysis
By End-User Industry: Oil and Gas Dominance Meets Paints and Coatings Acceleration
Oil and Gas captured 35.62% of UAE Silica Sand market share in 2025 on the back of ADNOC’s unconventional drilling program. This segment alone is projected to consume 650,000 tons of specialized proppant sand annually by 2027, reflecting the uptake of multi-stage hydraulic fracturing. Paints and coatings, although a smaller volume user, will expand at a 5.04% CAGR through 2031, driven by Industrial Decarbonization Roadmap incentives for low-VOC, silica-enhanced coatings that improve UV resistance and durability.
Construction remains one of the largest volume consumers in the UAE Silica Sand market, supported by a USD 65 billion housing fund and megaprojects such as the Blue Line metro extension. However, recycled aggregates now meet as much as 15% of base-course requirements, capping virgin volume growth. Glass Manufacturing contributes consistent demand, with Emirates Float Glass producing 12.6 million m² in 2024 and Glass Technology’s solar line adding significant additional pull from 2025 onward.


Geography Analysis
Dubai and Abu Dhabi account for 85% of the construction contract value and therefore anchor volume demand in the UAE silica sand market. Dubai’s transition from mass reclamation to densification shifts sand requirements toward higher-specification construction and glass products, evident from 91 km of Palm Jebel Ali beachfront profiling and record float-glass output. Abu Dhabi’s industrial nodes—KEZAD, Al Ruwais, and Al Taweelah—drive foundry, filtration, and refractories consumption; EGA’s 2.69 million tons of aluminium output in 2024 alone sustains hundreds of thousands of tons of foundry sand per year.
Ras Al Khaimah hosts a burgeoning glass cluster that demands low-iron silica for photovoltaic applications, while Fujairah remains the primary quarrying hub with an annual capacity of 20 million tons. Northern Emirates leverage Jebel Ali Port and Al Maktoum Airport to import specialty frac sand and high-purity silica when domestic supply falls short. New federal MRV rules create a uniform compliance landscape, although emirate-specific authorities, such as DECCA in Dubai or Abu Dhabi’s Department of Energy, retain local permitting oversight.
Competitive Landscape
The UAE Silica Sand market is moderately concentrated, with the top five companies supplying the bulk of industrial-grade feedstock. Procurement power, however, lies with mega-developers and state-linked entities such as Emaar, Nakheel, ADNOC, and DEWA, all of which require vendors to comply with ISO 14001, ISO 50001, and ICV standards. Vertical integration is gaining momentum: Dubai Investments operates the only ICV-certified float glass line, while EGA’s first commercial alumina deal with The Alumina Industrial Company secures a local refractories supply, aligning with the Operation 300bn goals. Low-carbon logistics and digital MRV readiness are becoming decisive advantages: EGA’s LNG-fueled bauxite shipments have cut shipping emissions by 28% and set a benchmark that other silica carriers may soon emulate.
UAE Silica Sand Industry Leaders
Adwan Chemical Industries Co. Ltd
Silica International (RAK)
National Ready Mix Concrete Co. LLC
Gulf Minerals
Delmon
- *Disclaimer: Major Players sorted in no particular order

Recent Industry Developments
- April 2025: Glass Technology FZ-LLC inaugurated a AED 350 million solar glass plant in Ras Al Khaimah, with a 5.5 million-module annual capacity and plans for a second furnace.
- January 2025: ADNOC, SLB, and Patterson-UTI launched Turnwell Industries to drill 144 unconventional wells by Q4 2025.


UAE Silica Sand Market Report Scope
Silica sand is quartz that has been broken down into tiny granules over time through the work of water and wind. In open-pit operations, silica sand deposits are most commonly surface-mined; however, dredging and underground mining are also employed.
By end-user industries, the market is segmented into glass manufacturing, foundry, chemical production, construction, paints and coatings, ceramics and refractories, filtration, oil and gas, and other end-user industries. For each segment, market sizing and forecasts have been done based on volume in tons.
By End-user Industry
| Glass Manufacturing |
| Foundry |
| Chemical Production |
| Construction |
| Paints and Coatings |
| Ceramics and Refractories |
| Filtration |
| Oil and Gas |
| Other End-user Industries |
| By End-user Industry | Glass Manufacturing |
| Foundry | |
| Chemical Production | |
| Construction | |
| Paints and Coatings | |
| Ceramics and Refractories | |
| Filtration | |
| Oil and Gas | |
| Other End-user Industries |


Key Questions Answered in the Report
What is the 2026 volume of the UAE Silica Sand market?
The market is estimated at 13.65 million tons in 2026.
How fast will UAE silica demand grow through 2031?
Volume is forecast to rise at a 3.88% CAGR, reaching 16.52 million tons by 2031.
Which segment uses the most silica sand in the UAE?
Oil and Gas leads with a 35.62% market share in 2025, driven by rising frac-sand needs.
Why is solar-grade silica demand increasing?
New solar glass capacity in Ras Al Khaimah and a record float-glass output in Dubai are driving the uptake of low-iron silica.
How do recycling mandates affect silica sand suppliers?
MOCCAE Resolution 21/2019 allows 40% recycled aggregates in road projects, reducing demand for virgin construction-grade sand.
What regulation poses the biggest compliance risk?
Federal Decree-Law 11/2024 enforces mandatory GHG MRV, with fines up to AED 2 million for non-compliance.
Page last updated on:


