Open-Source Software Security Market Size and Share
Market Overview
| Study Period | 2019 - 2030 |
|---|---|
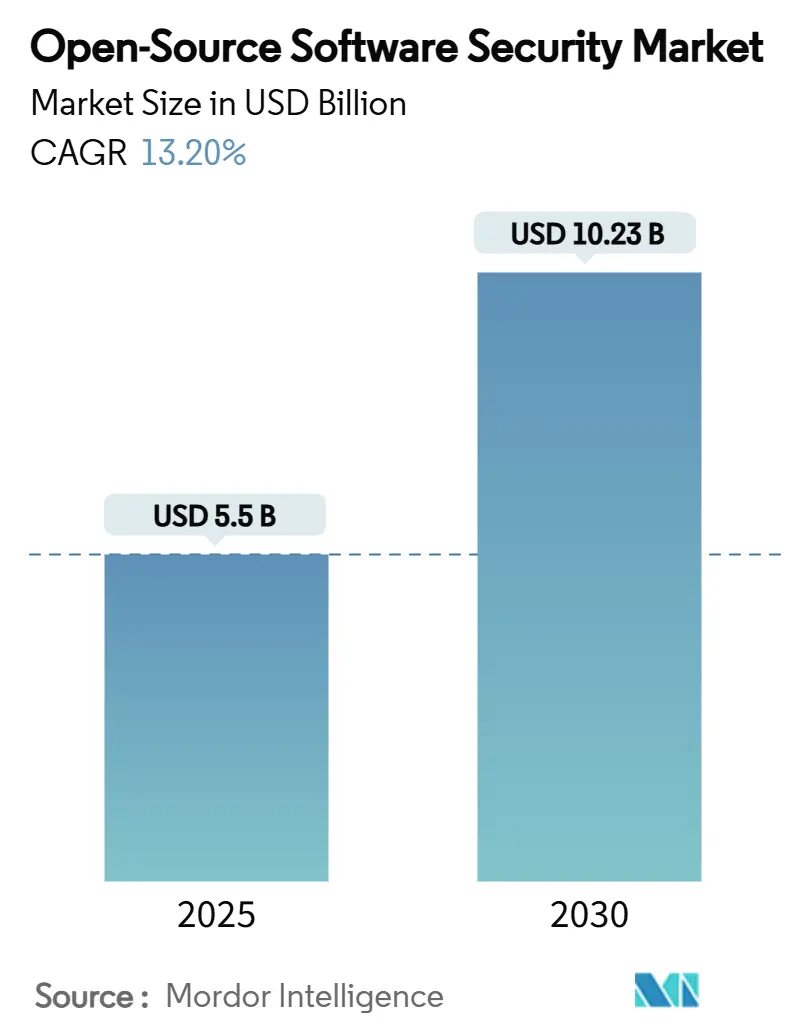
| Market Size (2025) | USD 5.5 Billion |
| Market Size (2030) | USD 10.23 Billion |
| Growth Rate (2025 - 2030) | 13.20% CAGR |
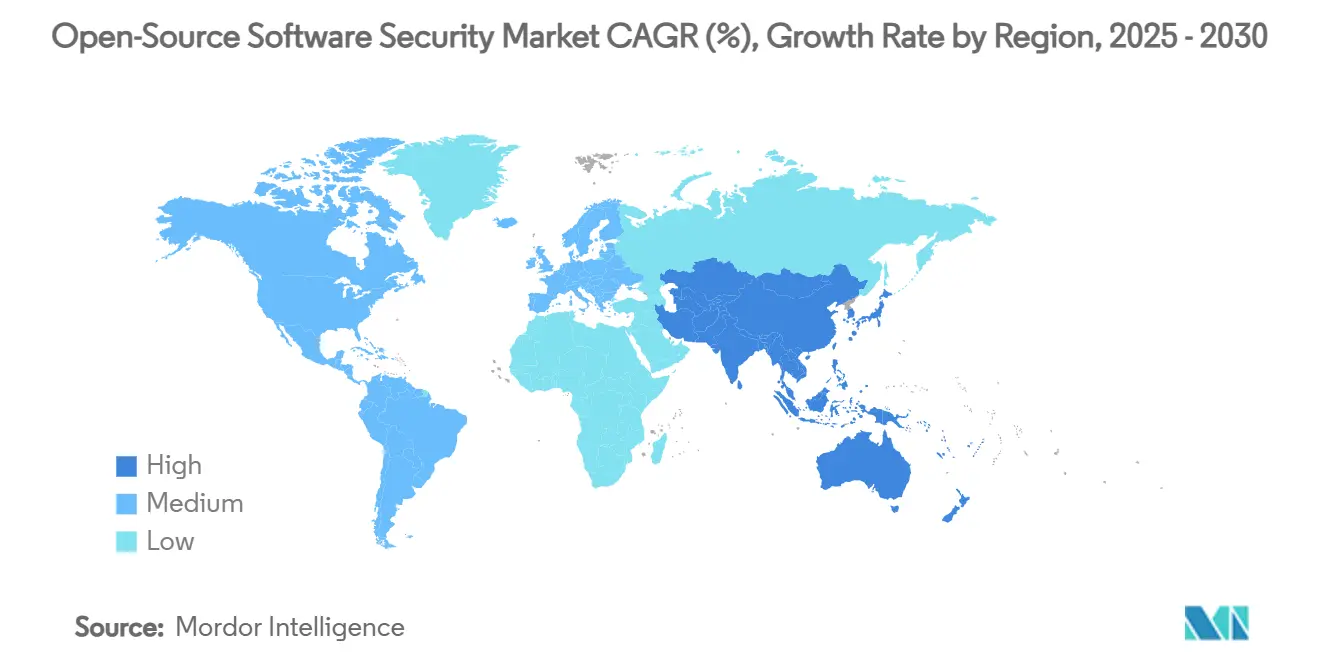
| Fastest Growing Market | Asia Pacific |
| Largest Market | North America |
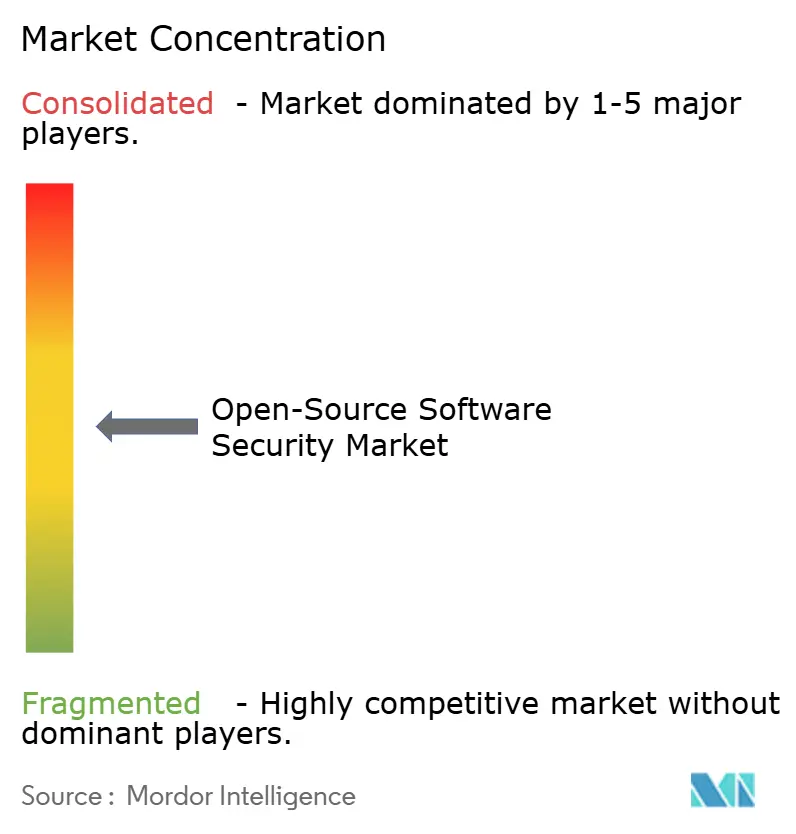
| Market Concentration | Medium |
Major Players *Disclaimer: Major Players sorted in no particular order Image © Mordor Intelligence. Reuse requires attribution under CC BY 4.0. | |
Open-Source Software Security Market Analysis by Mordor Intelligence
The open source software security market size stood at USD 5.50 billion in 2025 and is forecast to reach USD 10.23 billion in 2030, registering a 13.20% CAGR. Growing incidents of supply-chain attacks, expanding regulatory pressure for Software Bill of Materials (SBOM) adoption, and broader DevSecOps integration continue to shape demand patterns. Enterprises now prioritize platform-based controls that unify vulnerability scanning, malicious-package detection, and SBOM management, while services revenue accelerates because many organizations lack specialist talent. Deployment preferences remain mixed—on-premises implementations still dominate where data sovereignty is non-negotiable, yet cloud/SaaS models log double-digit growth as companies seek elastic scaling and lower administration overheads. Large enterprises drive current spending, but democratized pricing and community editions are enabling small and medium enterprises to boost adoption, especially in the Asia-Pacific, where security budgets are rising quickly. Competitive intensity is moderate: leading platform vendors pursue acquisitions to extend coverage, and specialist start-ups are carving out niches in secrets detection and real-time threat telemetry, ensuring the open source software security market retains healthy innovation dynamics.
Key Report Takeaways
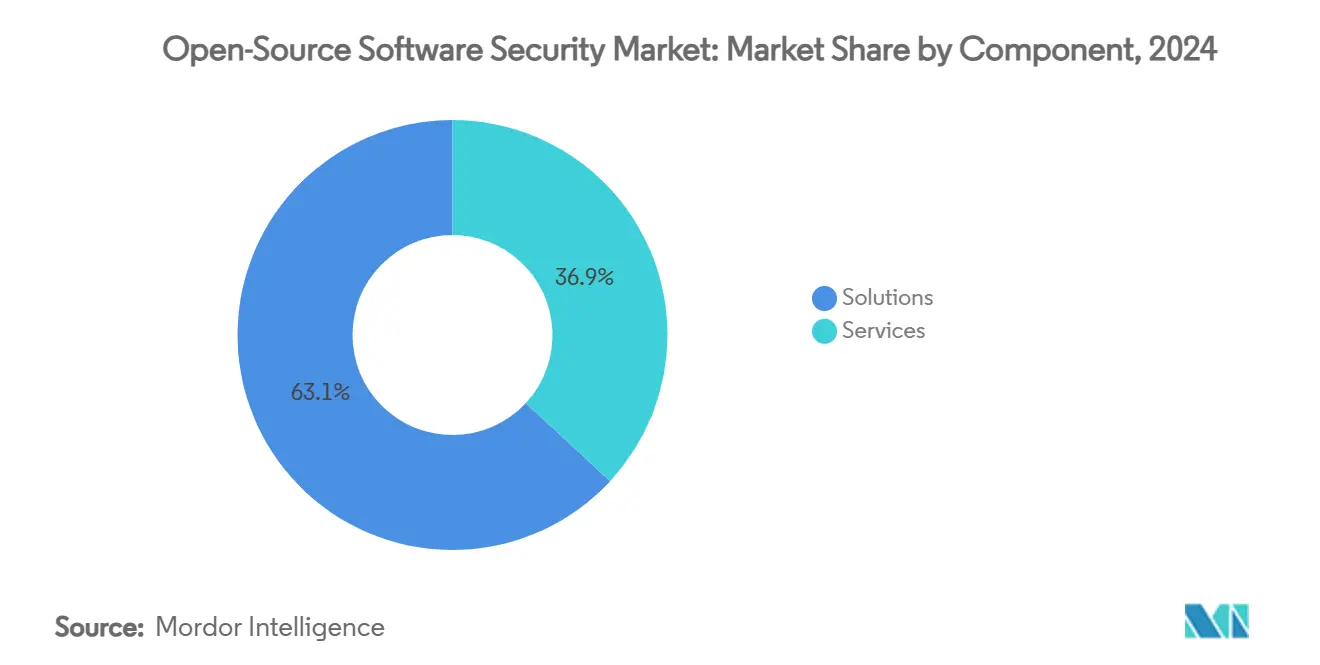
- By component, solutions led with 63.1% revenue share of the open source software security market in 2024, while services are projected to expand at a 14.8% CAGR through 2030.
- By deployment mode, on-premises retained a 55.7% share of the open source software security market in 2024, whereas cloud/SaaS is expected to advance at a 15.3% CAGR to 2030.
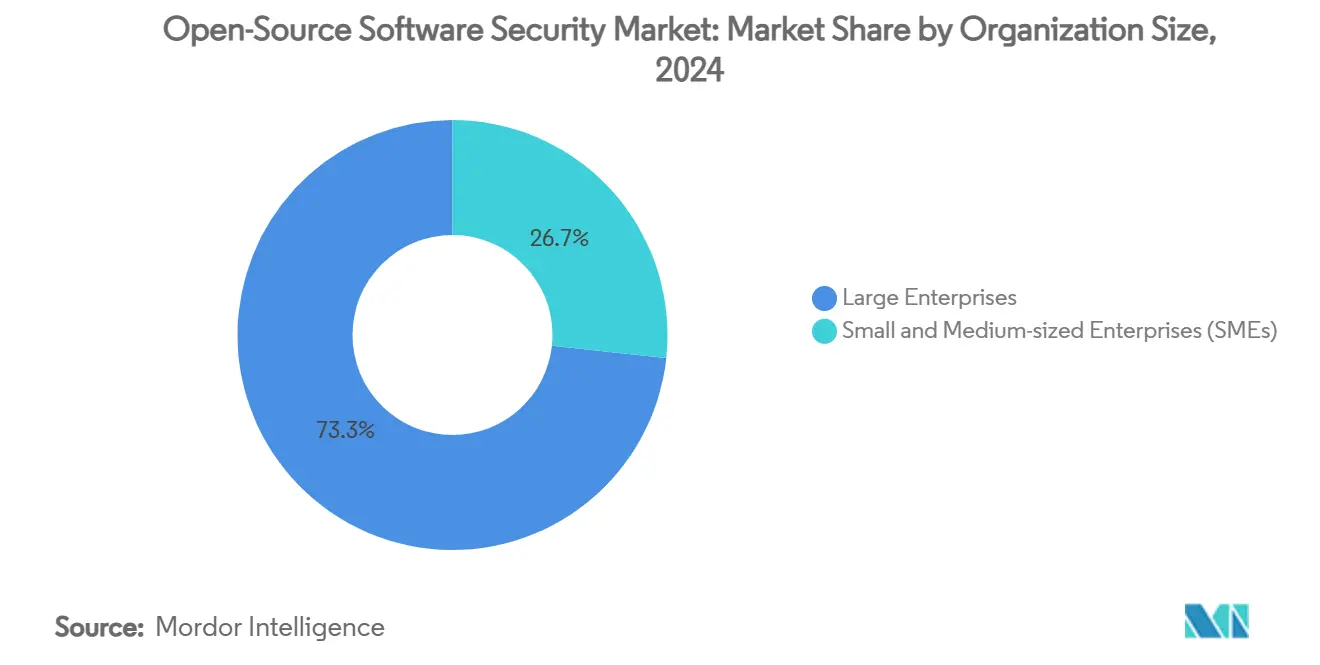
- By organization size, large enterprises commanded 73.3% of the open source software security market size in 2024, and small and medium enterprises are set to post the highest 15.1% CAGR over the forecast period.
- By security function, software composition analysis captured 41.7% share of the open source software security market in 2024; malicious-package detection is forecast to grow fastest at a 14.6% CAGR.
- By end-user industry, BFSI held 29.3% revenue share of the open source software security market in 2024, while government and defense are on track for the strongest 14.5% CAGR through 2030.
- By geography, North America accounted for 38.2% of revenue of the open source software security market in 2024, and Asia-Pacific is projected to log the fastest 14.7% CAGR to 2030.
Global Open-Source Software Security Market Trends and Insights
Drivers Impact Analysis*
| Driver | (~) % Impact on CAGR Forecast | Geographic Relevance | Impact Timeline |
|---|---|---|---|
| Rising frequency of software-supply-chain attacks | +2.1% | North America, EU, global repositories | Short term (≤ 2 years) |
| Regulatory mandates for SBOM | +1.8% | EU core, spreading to APAC and Americas | Medium term (2-4 years) |
| Rapid enterprise shift-left/DevSecOps adoption | +1.6% | North America, Western Europe | Medium term (2-4 years) |
| Expanding reliance on open-source components | +1.4% | Global | Long term (≥ 4 years) |
| AI-driven vulnerability discovery | +1.2% | Early adoption in North America and EU | Short term (≤ 2 years) |
| Demand for autonomous remediation | +1.0% | Tech-forward regions worldwide | Long term (≥ 4 years) |
| Source: Mordor Intelligence | |||
Rising Frequency of Software Supply-Chain Attacks
Major code repositories experienced unprecedented compromises throughout 2024, including malicious packages that blended cryptocurrency mining and data theft, prompting enterprises to reassess perimeter-centric defenses. The XZ Utils backdoor episode highlighted how long-term infiltration efforts can manipulate fundamental utilities undetected, and research teams from leading security vendors documented coordinated attempts against PyPI and npm that triggered temporary repository shutdowns. [1]Checkmarx, “PyPI Is Under Attack: Project Creation and User Registration Suspended,” checkmarx.com Incidents accelerated board-level conversations, leading to broader adoption of proactive safeguards spanning pre-commit scanning, real-time package reputation scoring, and automated dependency patching. As breaches increasingly target trusted developer workflows, demand grows for consolidated platforms that surface malicious behavior within hours of package publication. Organizations now treat supply-chain visibility as mandatory, not optional, reinforcing double-digit growth momentum in the open source software security market.
Regulatory Mandates for Software Bill of Materials (SBOM)
The EU Cyber Resilience Act has set a clear compliance deadline of December 2027 for SBOM submission, continuous vulnerability disclosure, and lifecycle security monitoring, with non-compliance penalties that can run into millions of euros. Similar obligations already apply to US federal suppliers, and regional payment standards now reference SBOM as a best practice. Atlassian’s automated SBOM service, which has generated more than 1 million inventories covering 1.8 billion packages, illustrates how large ecosystems are operationalizing the requirement. [2]Atlassian, “Producing Software Bill of Materials for Atlassian,” atlassian.com As a result, enterprises increasingly embed SBOM generators directly into CI/CD pipelines to maintain up-to-date component lists and to satisfy auditors quickly. Vendors offering machine-readable SBOM formats compatible with CycloneDX or SPDX are well-positioned to capture incoming budgets, supporting sustained expansion of the open source software security market.
Rapid Enterprise Shift-Left/DevSecOps Adoption
Security testing earlier in the development lifecycle lowers defect remediation costs and accelerates release velocity, encouraging organizations to adopt “shift-left” toolchains that integrate scanning at each commit. AI-powered static analysis engines now flag vulnerabilities within seconds, shortening feedback loops for developers and reducing friction between engineering and security teams. Snyk crossed the USD 100 million annual recurring revenue threshold after integrating AI-native SAST into developer workflows, confirming market readiness for code-centric security platforms. Parallel growth in managed detection and response services delivers complementary expertise, allowing talent-constrained teams to maintain continuous monitoring without scaling headcount linearly. With return-on-investment studies showing triple-digit paybacks for organizations that migrate to DevSecOps, adoption trajectories remain steep across all verticals, further propelling the open source software security market.
AI-Driven Vulnerability Discovery Exposing Zero-Days
Machine-learning models capable of autonomously reviewing large codebases are surfacing unknown vulnerabilities at record speed. Security labs have disclosed AI systems that identified critical flaws in mainstream open-source projects only hours after new commits landed. These discoveries illustrate the technology’s dual-use nature: defenders gain unprecedented visibility, while adversaries can potentially automate exploit development. Vendors now combine AI-assisted code reasoning with curated threat intelligence feeds to prioritize remediation tasks, reducing false positives. As enterprises witness measurable reductions in mean-time-to-detect, AI integration becomes a key buying criterion, reinforcing premium pricing for next-generation platforms within the open source software security market.
Restraints Impact Analysis*
| Restraint | (~) % Impact on CAGR Forecast | Geographic Relevance | Impact Timeline |
|---|---|---|---|
| High false-positive rates causing alert fatigue | -1.5% | Global SMEs most affected | Short term (≤ 2 years) |
| Shortage of skilled open-source security professionals | -1.2% | Global, acute in APAC | Long term (≥ 4 years) |
| Budget constraints among SMEs | -0.8% | Developing economies | Medium term (2-4 years) |
| Fragmented SBOM standards creating lock-in risk | -0.6% | Region-specific regulatory variations | Medium term (2-4 years) |
| Source: Mordor Intelligence | |||
High False-Positive Rates Causing Alert Fatigue
Security teams report that as much as 70% of daily alerts lack actionable value, diverting attention from genuine threats and elongating response times. GitGuardian’s 2025 study found 4.61% of public repositories contain secrets, yet many automated detections are duplicates or low-risk tokens. [3]GitGuardian, “State of Secrets Sprawl Report 2025,” gitguardian.com Overly sensitive rulesets overwhelm staff, while aggressive tuning can let critical breaches slip through, forcing organizations to refine thresholds iteratively. Vendors now embed contextual intelligence to correlate alerts with asset criticality, but smaller companies still struggle to staff 24/7 triage operations. Excess noise, therefore, slows adoption among resource-constrained buyers, trimming near-term growth in the open source software security market.
Shortage of Skilled Open-Source Security Professionals
Cybersecurity faces a 3.5 million-person skills deficit, and the subset with deep open-source expertise is even smaller. Asia-Pacific’s rapid digital expansion widens the gap: local wages inflate, project timelines stretch, and some initiatives stall. Governments and universities have begun funding specialized training, yet curricula lag behind evolving attack techniques and compliance obligations. Managed service providers partly bridge the gap, though their availability is uneven across regions. Persistent talent scarcity elevates total cost of ownership and tempers deployment velocity, exerting a moderating influence on the open source software security market’s long-range CAGR.
*Our forecasts treat driver/restraint impacts as directional, not additive. The impact forecasts reflect baseline growth, mix effects, and variable interactions.
Segment Analysis
By Component: Services Gain Momentum Amid Tool Consolidation
Solutions held 63.1% of the open source software security market in 2024 because integrated platforms—often anchored by software composition analysis—remain the first purchase for most enterprises. These platforms automate SBOM creation, license auditing, and vulnerability triage, unifying data for developers and security operations alike. However, services revenue is scaling faster, recording a forecast 14.8% CAGR to 2030. Managed security offerings cover 24/7 monitoring, threat hunting, and incident response, allowing companies to plug skills gaps without heavy internal hiring. Professional consulting further accelerates as organizations grapple with multiregional regulatory compliance and seek external guidance on SBOM governance models. Over time, recurring managed-service contracts are expected to constitute a rising share of the open source software security market size, fostering predictable revenue for providers and nurturing cross-sell opportunities into adjacent cloud security domains.
A parallel surge in training services addresses the talent bottleneck. Vendor-led academies now bundle certification programs into enterprise agreements, linking tool proficiency to customer success metrics. As SBOM audits become routine, auditors increasingly check whether teams possess validated competencies, driving additional demand for structured education. Collectively, the value-added services layer enhances stickiness around core platforms and intensifies competitive differentiation.


By Deployment Mode: Cloud/SaaS Accelerates Despite On-Premises Control
On-premises installations accounted for 55.7% of open source software security market share in 2024, supported by heavily regulated verticals that mandate local data residency. Financial institutions and public-sector agencies often integrate scanners into existing private datacenters to align with legacy governance frameworks. Conversely, cloud/SaaS deployments are forecast to outpace, recording a 15.3% CAGR, as enterprises migrate development pipelines to cloud-native architectures. Vendor-hosted solutions deliver elastic compute for deep scan workloads and stream global threat intelligence in near real time. They also remove patch-management overheads, a key benefit for small teams. Hybrid approaches are now mainstream: sensitive repositories remain on-premises, while analytics layers operate in the cloud, preserving confidentiality while exploiting scale.
Increasingly, cloud marketplaces streamline procurement via monthly consumption billing. Start-ups and regional integrators bundle open source software security market functionality into broader DevSecOps suites, lowering entry thresholds for SMEs. As confidence in encrypted multi-tenant environments strengthens, industry observers anticipate the cloud to surpass on-premises in total revenue contribution after 2028, though the absolute share will vary by geography and sector.
By Organization Size: SME Uptake Quickens Through Democratized Access
Large enterprises generated 73.3% of the open source software security market size in 2024 thanks to bigger budgets, complex portfolios, and mandated compliance audits. They often deploy multi-layer defenses, integrating pre-commit, CI/CD, and runtime scanners across thousands of repositories. Yet SMEs exhibit the steeper growth curve, with a 15.1% forecast CAGR to 2030.
Community editions and tiered SaaS pricing reduce cost barriers; query-based policy engines ship with sensible defaults, eliminating heavy configuration. Vendors also embed in-product tutorials, shortening time-to-value. These measures align with rising supplier-risk audits that compel smaller vendors to document SBOMs before selling into enterprise ecosystems. Consequently, SME share of the open source software security market is set to expand steadily, though absolute dollar contribution will still lag large-enterprise spend through the forecast horizon.
By Security Function: Malicious-Package Detection Outpaces Core SCA
Software composition analysis (SCA) claimed 41.7% of the open source software security market share in 2024, underpinned by its pivotal role in inventorying dependencies and flagging known CVEs. As repositories balloon in size, automated identification remains indispensable. Still, malicious-package detection is projected to grow fastest, at 14.6% CAGR, because attackers increasingly upload weaponized code containing hidden payloads. Real-time reputation networks and behavioral sandboxes now inspect packages at publication, enabling developers to block compromised components before ingestion.
Veracode’s purchase of Phylum exemplifies strategic moves to integrate such capabilities natively. Secrets-leakage prevention also gains prominence following annual reports of tens of millions of exposed credentials. AI-assisted correlation engines compare token patterns and validate against live APIs to eliminate false alarms. As regulatory deadlines close in, SBOM generation utilities enjoy sustained demand, often bundled into unified platforms to simplify workflow fragmentation. The trend toward all-in-one suites anticipates that enterprises will prefer fewer procurement points, shaping future competitive landscapes in the open source software security market.
By End-User Industry: Government Demand Surges Behind BFSI Leadership
BFSI retained leadership with 29.3% share of the open source software security market size in 2024, reflecting strict oversight, high-value data, and continuous threat activity. Banks integrate multilayer scanning across payment pipelines, and insurers increasingly require vendors to produce SBOM attestations before contract award. Government and defense, however, are set for the highest 14.5% CAGR, driven by national-security directives recognizing that software supply chains represent strategic assets vulnerable to nation-state exploitation.
Public-sector frameworks now mandate vulnerability disclosure timelines and component provenance tracking, sparking investment in enterprise-grade platforms. Healthcare looks to accelerate adoption following high-profile breaches affecting millions of patient records, prompting regulatory bodies to tighten incident-reporting windows. Manufacturing and energy utilities allocate rising budgets as OT environments converge with IT networks, creating new supply-chain exposure points. Collectively, vertical adoption diversity underpins sustained robustness in the open source software security market.
Geography Analysis
North America accounted for 38.2% of revenue in 2024, supported by mature DevSecOps cultures, strong venture funding, and early regulatory mandates such as US federal SBOM requirements. High-profile supply-chain incursions against national infrastructure catalyzed additional public-sector spending, while cyber-insurance frameworks now insist on demonstrable software supply-chain controls, further expanding regional demand. Established vendor ecosystems headquartered in the United States facilitate deep customer support and frequent feature rollouts that meet evolving compliance guidelines.
Europe exhibits solid momentum, propelled by the Cyber Resilience Act’s binding SBOM clauses applicable from 2027. Germany, France, and the United Kingdom lead commercial deployment, whereas Nordic nations spearhead automation best practices. Funding for open-source sustainability initiatives nonetheless remains inconsistent, prompting policy discussions around long-term financing to mitigate systemic risk. Market participants expect accelerating services revenue as continental manufacturers seek tailored consulting to navigate multilingual compliance documentation within the open source software security market.
Asia-Pacific delivers the fastest projected 14.7% CAGR through 2030. Government-backed digital-transformation programs, combined with a swelling developer population, drive dependency on open-source packages—and thus security tooling. South Korea’s mandatory security-software rules for financial institutions and Japan’s continuously updated national vulnerability databases exemplify region-specific catalysts. [4]Information-technology Promotion Agency, “Vulnerabilities: Japan Vulnerability Notes (JVN),” ipa.go.jp Venture funding into local cybersecurity start-ups is rising, fostering indigenous innovation that addresses language and regulatory nuances. India and China supply massive potential due to scale, yet market entry requires alignment with data-localization statutes. Overall, the open source software security market in Asia-Pacific offers the greatest incremental revenue upside over the next five years.

Competitive Landscape
The competitive arena remains moderately fragmented. Legacy application-security providers such as Synopsys, Sonatype, and Veracode maintain large installed bases by bundling open-source modules into broader portfolios. High-growth specialists—Snyk, GitGuardian, Chainguard, Cycode, Endor Labs—compete by emphasizing developer-first experiences and AI-driven analytics. Consolidation is a core strategy: Veracode’s integration of Phylum expands malicious-package visibility, and other vendors pursue similar tuck-in acquisitions to extend vertical coverage.
Platform convergence is intensifying. Customers request end-to-end functionality—SCA, secrets detection, SBOM management, and runtime monitoring—within a single console, pressuring smaller point-solution vendors to partner or merge. Differentiation, therefore, hinges on detection accuracy and workflow automation that cuts alert noise. Vendors tout machine-learning models trained on billions of dependency records to rank vulnerabilities by exploitability, helping enterprises triage faster. Open-core monetization also gains traction: community editions cultivate grassroots adoption before converting teams to paid plans with advanced policy engines. Services attach rates are climbing, as providers bundle managed detection, compliance guidance, and developer education to offset talent shortages, boosting recurring revenue streams throughout the open source software security market.
Geographic expansion remains top of mind. US-based leaders establish regional data centers in Europe and Asia-Pacific to satisfy residency laws, while local champions leverage language localization to win mid-market customers. Strategic alliances with cloud hyperscalers amplify reach, embedding scanners into marketplace catalogs and DevOps toolchains. Overall, sustained innovation, combined with selective consolidation, is expected to prevent rapid commoditization and preserve mid-teens revenue growth for the sector.
Open-Source Software Security Industry Leaders
Synopsys, Inc.
Sonatype, Inc.
Snyk Limited
Mend.io Ltd.
Checkmarx Ltd.
- *Disclaimer: Major Players sorted in no particular order

Recent Industry Developments
- January 2025: Veracode completed the acquisition of Phylum Inc., adding real-time malicious-package analytics to its application-security platform.
- January 2025: The Python Package Index (PyPI) temporarily suspended new project creation and user registration following coordinated supply-chain attacks targeting trusted maintainers.
- December 2024: Snyk surpassed USD 100 million in annual recurring revenue and purchased Reviewpad to deepen code-review automation within developer workflows.
- November 2024: Checkmarx researchers disclosed a year-long npm campaign that installed cryptomining payloads via @0xengine/xmlrpc, underscoring increasing attacker sophistication.


Global Open-Source Software Security Market Report Scope
| Solutions |
| Services |
| On-premises |
| Cloud/SaaS |
| Large Enterprises |
| Small and Medium-sized Enterprises (SMEs) |
| Software Composition Analysis (SCA) |
| Secrets Detection and Leakage Prevention |
| SBOM Generation and Management |
| Malicious-package and Supply-chain Detection |
| BFSI |
| IT and Telecom |
| Healthcare and Life Sciences |
| Retail and e-Commerce |
| Manufacturing |
| Government and Defense |
| Energy and Utilities |
| Other End-user Industries |
| North America | United States | |
| Canada | ||
| Mexico | ||
| South America | Brazil | |
| Argentina | ||
| Chile | ||
| Rest of South America | ||
| Europe | Germany | |
| United Kingdom | ||
| France | ||
| Italy | ||
| Spain | ||
| Rest of Europe | ||
| Asia-Pacific | China | |
| Japan | ||
| India | ||
| South Korea | ||
| Australia | ||
| Singapore | ||
| Malaysia | ||
| Rest of Asia-Pacific | ||
| Middle East and Africa | Middle East | Saudi Arabia |
| United Arab Emirates | ||
| Turkey | ||
| Rest of Middle East | ||
| Africa | South Africa | |
| Nigeria | ||
| Rest of Africa | ||
| By Component | Solutions | ||
| Services | |||
| By Deployment Mode | On-premises | ||
| Cloud/SaaS | |||
| By Organization Size | Large Enterprises | ||
| Small and Medium-sized Enterprises (SMEs) | |||
| By Security Function | Software Composition Analysis (SCA) | ||
| Secrets Detection and Leakage Prevention | |||
| SBOM Generation and Management | |||
| Malicious-package and Supply-chain Detection | |||
| By End-user Industry | BFSI | ||
| IT and Telecom | |||
| Healthcare and Life Sciences | |||
| Retail and e-Commerce | |||
| Manufacturing | |||
| Government and Defense | |||
| Energy and Utilities | |||
| Other End-user Industries | |||
| By Geography | North America | United States | |
| Canada | |||
| Mexico | |||
| South America | Brazil | ||
| Argentina | |||
| Chile | |||
| Rest of South America | |||
| Europe | Germany | ||
| United Kingdom | |||
| France | |||
| Italy | |||
| Spain | |||
| Rest of Europe | |||
| Asia-Pacific | China | ||
| Japan | |||
| India | |||
| South Korea | |||
| Australia | |||
| Singapore | |||
| Malaysia | |||
| Rest of Asia-Pacific | |||
| Middle East and Africa | Middle East | Saudi Arabia | |
| United Arab Emirates | |||
| Turkey | |||
| Rest of Middle East | |||
| Africa | South Africa | ||
| Nigeria | |||
| Rest of Africa | |||


Key Questions Answered in the Report
How big is the open source software security market in 2025?
The open source software security market size reached USD 5.50 billion in 2025 and is projected to grow steadily at a 13.20% CAGR.
Which component leads current spending?
Integrated solutions account for 63.1% revenue, reflecting demand for unified platforms that combine scanning, SBOM, and malicious-package detection.
What region shows the fastest growth?
Asia-Pacific is forecast to post a 14.7% CAGR through 2030, driven by rapid digital transformation and expanding regulatory mandates.
Why are services growing faster than software sales?
Organizations face skills shortages and complex compliance needs, so managed services and consulting are expanding at a 14.8% CAGR.
Which security function is gaining momentum beyond traditional SCA?
Malicious-package detection is the fastest-growing function, expected to register a 14.6% CAGR as attackers increasingly weaponize code repositories.
Page last updated on:


