Near-Eye Display Market Size and Share
Market Overview
| Study Period | 2020 - 2031 |
|---|---|
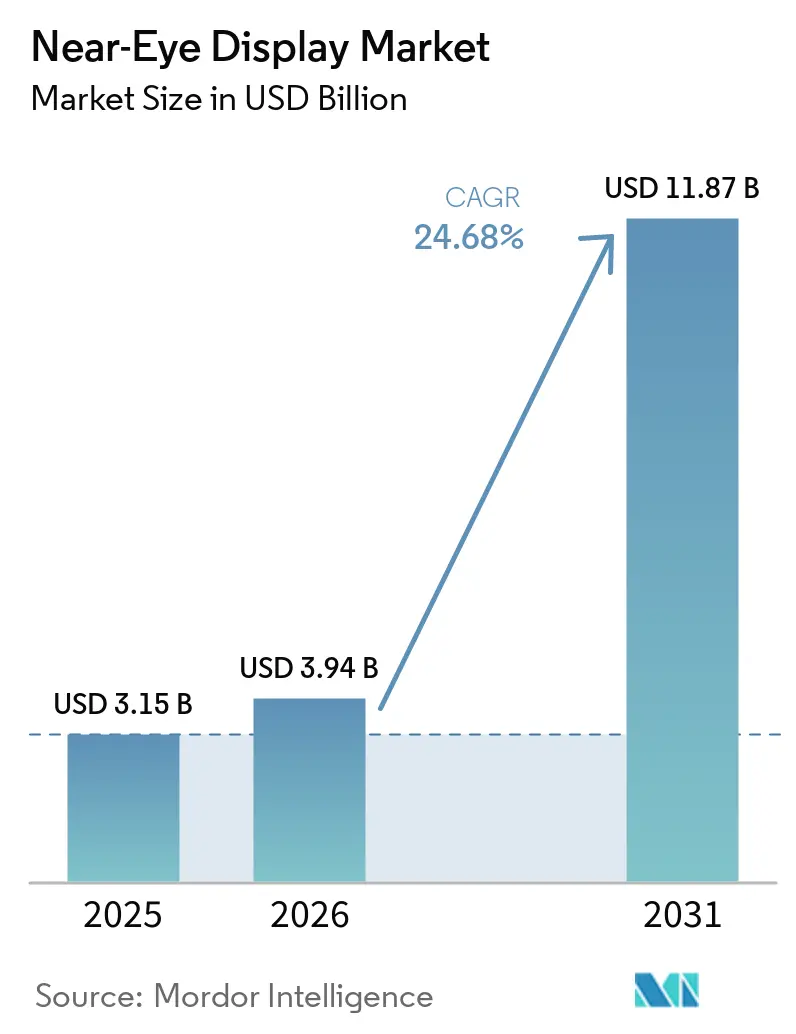
| Market Size (2026) | USD 3.94 Billion |
| Market Size (2031) | USD 11.87 Billion |
| Growth Rate (2026 - 2031) | 24.68% CAGR |
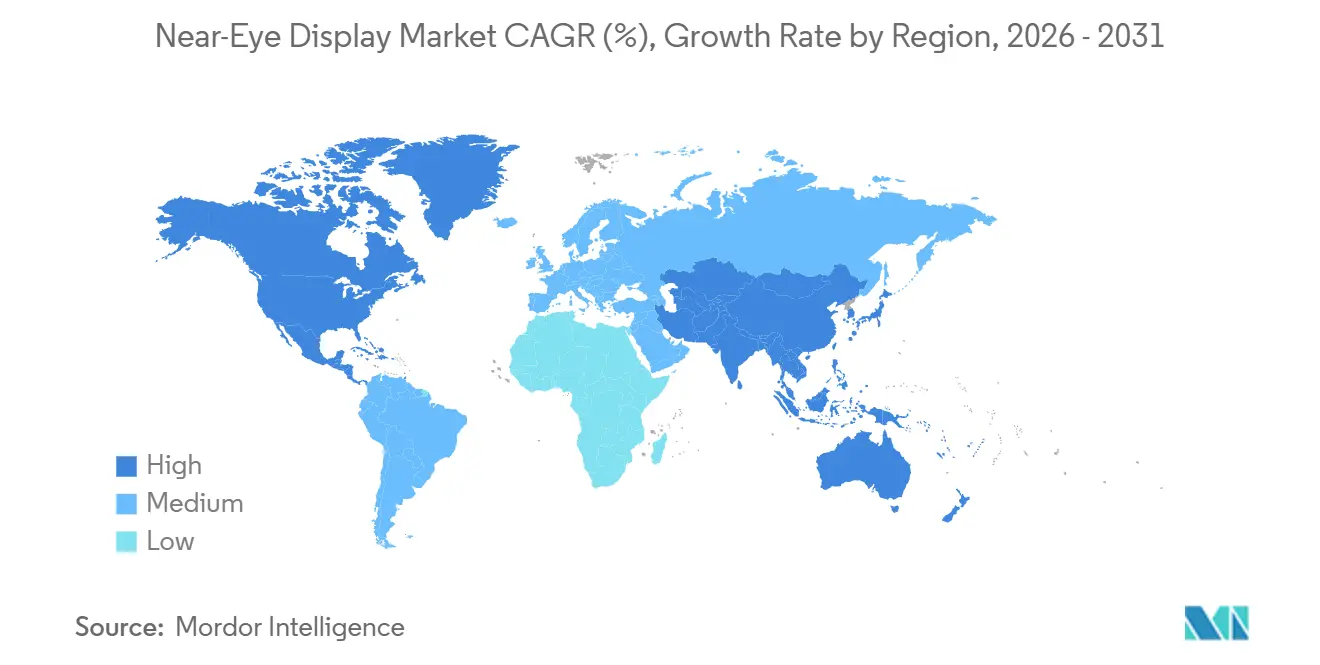
| Fastest Growing Market | Asia Pacific |
| Largest Market | Asia Pacific |
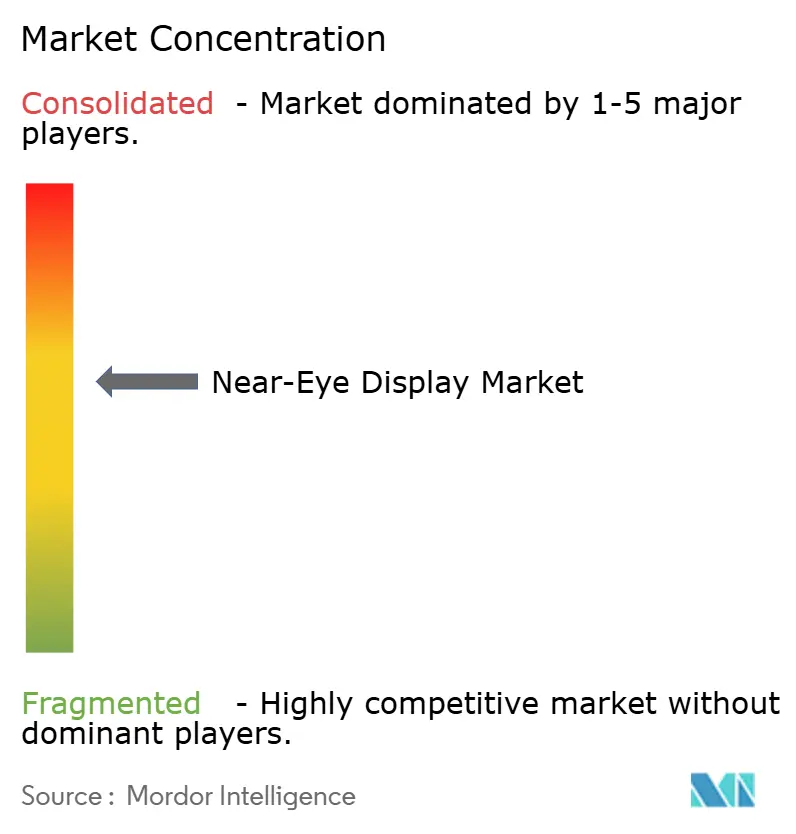
| Market Concentration | Medium |
Major Players *Disclaimer: Major Players sorted in no particular order Image © Mordor Intelligence. Reuse requires attribution under CC BY 4.0. | |
Near-Eye Display Market Analysis by Mordor Intelligence
The near-eye display market size is projected to expand from USD 3.15 billion in 2025 and USD 3.94 billion in 2026 to USD 11.87 billion by 2031, registering a CAGR of 24.68% between 2026 to 2031. The near-eye display market is accelerating as Micro-OLED manufacturing costs fall, pancake optics become the norm in virtual-reality (VR) headsets, and MicroLED pilot fabs cross the 5,000-nit brightness threshold needed for outdoor-readable augmented-reality (AR) smart glasses. Asia-Pacific retains manufacturing scale while North America anchors defense procurement, giving the near-eye display market a dual-engine growth model that balances consumer and military demand. Competitive differentiation now rests on who can combine high pixel density, thermal efficiency, and regulatory compliance at consumer price points. OEMs that close this tri-vector gap first will shape design wins for the next hardware cycle.
Key Report Takeaways
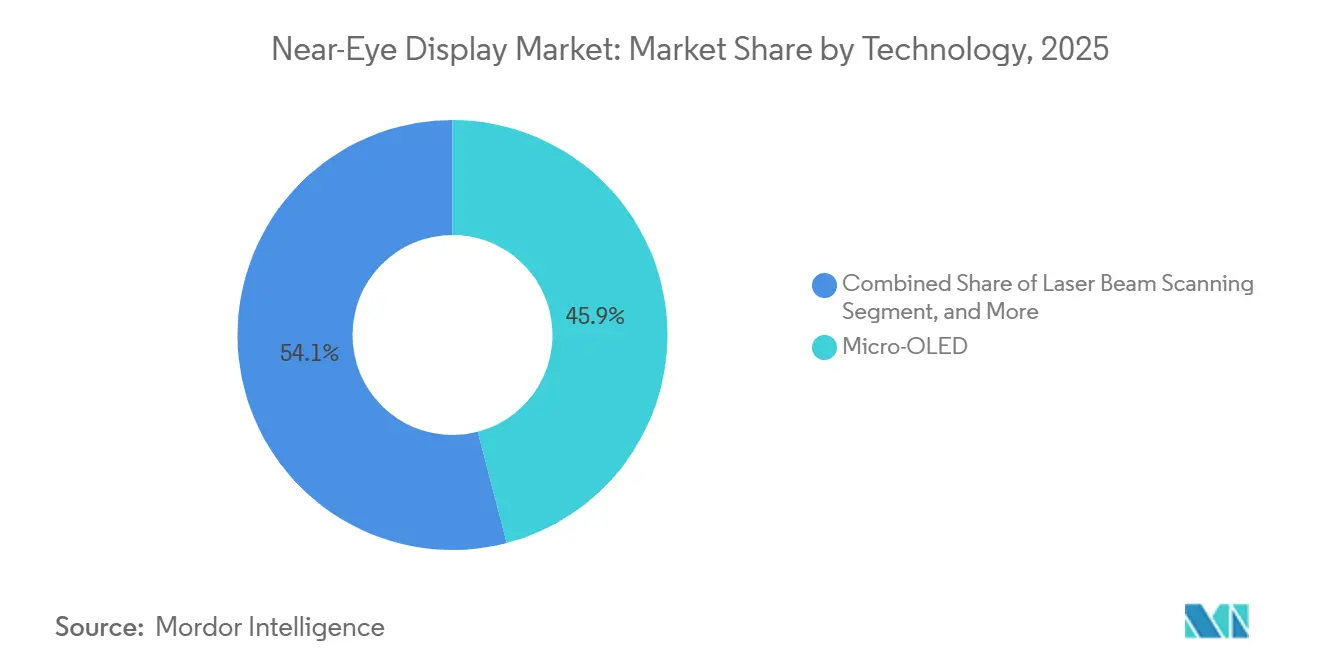
- By technology, Micro-OLED led with 45.92% of near-eye display market share in 2024, while MicroLED is projected to advance at a 24.93% CAGR through 2030.
- By application, virtual-reality head-mounted displays captured 63.41% revenue share in 2024; augmented-reality smart glasses are expected to expand at a 25.11% CAGR to 2030.
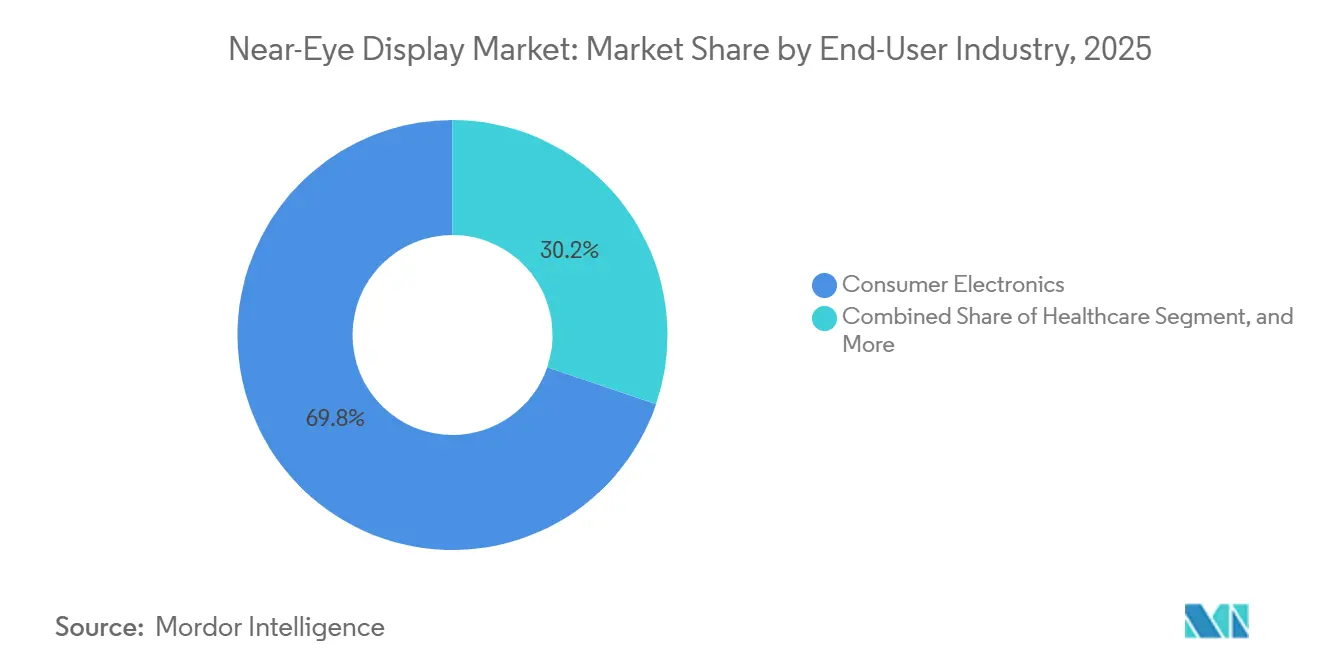
- By end-user industry, consumer electronics accounted for 69.73% of the 2024 near-eye display market size, whereas healthcare is forecast to grow at a 25.36% CAGR through 2030.
- By native resolution, Full-HD-class panels held 38.38% share of the near-eye display market size in 2024; 4K-plus displays are set to rise at a 25.48% CAGR between 2025-2030.
- By geography, Asia-Pacific commanded 46.82% of near-eye display market share in 2024 and is poised to maintain a 24.97% CAGR over the forecast period.
Note: Market size and forecast figures in this report are generated using Mordor Intelligence’s proprietary estimation framework, updated with the latest available data and insights as of January 2026.
Global Near-Eye Display Market Trends and Insights
Drivers Impact Analysis*
| Driver | (~) % Impact on CAGR Forecast | Geographic Relevance | Impact Timeline |
|---|---|---|---|
| Mainstream Cost-Down of Micro-OLED Manufacturing | +5.2% | Global, with concentration in Japan and South Korea | Medium term (2-4 years) |
| Widespread Adoption of Pancake Optics in VR/MR Headsets | +4.8% | North America and Asia-Pacific | Short term (≤ 2 years) |
| Surge in Gaming/Entertainment Content Ecosystems | +4.3% | Global, led by North America and Europe | Short term (≤ 2 years) |
| Emergence of MicroLED-on-Silicon Pilot Fabs | +3.9% | Asia-Pacific core, spill-over to North America | Long term (≥ 4 years) |
| AI-Generated Dynamic Foveated Rendering Algorithms | +3.1% | Global, early adoption in North America and Europe | Medium term (2-4 years) |
| U.S. DoD "Wearable Cockpit" Procurement Program | +2.4% | North America, with export potential to allied nations | Medium term (2-4 years) |
| Source: Mordor Intelligence | |||
Mainstream Cost-Down of Micro-OLED Manufacturing
Micro-OLED foundries shifting from 200 mm to 300 mm wafers are pushing die yields higher and slicing unit costs by as much as 20% each year, opening the near-eye display market to mid-tier headsets that once priced out OLED micro displays.[1]Sony Semiconductor Solutions, “4K OLED Microdisplay Roadmap,” sony-semicon.com Sony Semiconductor Solutions expanded its Kumamoto line in 2025, doubling 4K-capable output and shrinking lead times to eight weeks. Chinese rival SeeYA Technology unveiled a 1.03-inch panel with 4,000 PPI in 2025, signaling a cost-performance leap that undercuts Japanese incumbents by nearly 15%. Solution-processed polymer OLEDs promise additional savings because they avoid vacuum evaporation, though reliability data remains under validation. If sub-USD 100 modules materialize before 2028, mass-market AR glasses retailing below USD 500 become financially viable for the first time.
Widespread Adoption of Pancake Optics in VR/MR Headsets
Pancake lenses fold the light path, reducing headset depth by roughly 40% yet sacrificing up to 80% of light throughput, which forces displays past 1,500 nits. Meta standardized the approach in Quest 3, released in 2023, and is still the volume leader in 2025. Kopin’s 2.6K × 2.6K MicroLED prototype surpassed 10,000 nits in early 2025, proving that inorganic LEDs meet extreme brightness demand. Reflective LCOS suppliers such as Seiko Epson gain an interim advantage because their panels waste less light, giving OEMs a lower-cost bridge until MicroLED yields mature.
Surge in Gaming/Entertainment Content Ecosystems
Exclusive AAA titles on PlayStation VR2 propelled more than 2 million units within the first 12 months of launch.[2]Sony Interactive Entertainment, “PlayStation VR2 Sales Update,” playstation.com Meta’s USD 1 billion content fund circulated across 200 new titles that generated USD 2 billion in software revenue during 2025. AI content-creation toolkits from Unity and Unreal cut development time, enabling indie studios to supply niche experiences that keep attach rates above three paid titles per headset. In China, ByteDance leverages Douyin’s social graph to push localized games that anchor user retention in the near-eye display market.
Restraint (~) % Impact on CAGR Forecast Geographic Relevance Impact Timeline Persistent Thermal Management Challenges in High-Brightness NEDs -3.70% Global, acute in compact AR glasses Short term (≤ 2 years) Limited Lifetime of Blue Emitters in OLEDoS Panels -2.90% Global, particularly Japan and South Korea manufacturing Medium term (2-4 years) Supply-Chain Fragility for High-PPI Backplanes -2.30% Asia-Pacific and North America Medium term (2-4 years) EU Regulatory Scrutiny on Ocular Safety Limits for XR -1.80% Europe, with global compliance ripple effects Long term (≥ 4 years)
Guangdong Jade Bird Display reached mass production of 0.13-inch MicroLED panels in 2024, delivering 1 million-nit peak brightness needed for sunlit AR overlays.[3]Guangdong Jade Bird Display, “Mass Production Notice,” jbdisplay.com Samsung Display and Himax launched pilot lines in 2025, each targeting sub-5 µm pixel pitches that raise angular resolution above 60 pixels per degree. The hurdle remains mass-transfer yields, still below 85% in most pilot runs, yet industry consensus points to commercial-grade yields by 2028. Once costs align with Micro-OLED, the near-eye display market will pivot decisively toward MicroLED for consumer smart glasses.
Restraints Impact Analysis*
| Restraint | (~) % Impact on CAGR Forecast | Geographic Relevance | Impact Timeline |
|---|---|---|---|
| Persistent Thermal Management Challenges in High-Brightness NEDs | -3.7% | Global, acute in compact AR glasses | Short term (≤ 2 years) |
| Limited Lifetime of Blue Emitters in OLEDoS Panels | -2.9% | Global, particularly Japan and South Korea manufacturing | Medium term (2-4 years) |
| Supply-Chain Fragility for High-PPI Backplanes | -2.3% | Asia-Pacific and North America | Medium term (2-4 years) |
| EU Regulatory Scrutiny on Ocular Safety Limits for XR | -1.8% | Europe, with global compliance ripple effects | Long term (≥ 4 years) |
| Source: Mordor Intelligence | |||
Persistent Thermal Management Challenges in High-Brightness NEDs
Meta’s Quest Pro used vapor chambers but still triggered user discomfort after about one hour of continuous play. AR glasses lack space for fans, and prototypes from Vuzix throttled after 10 minutes at 3,000 nits. Kopin and Applied Materials are experimenting with diamond-like carbon backplanes that raise thermal conductivity by 30%. Commercial rollout depends on pairing these materials with low-power drivers, or the near-eye display market risks stagnation in outdoor-readable segments.
Limited Lifetime of Blue Emitters in OLEDoS Panels
Blue sub-pixels in current Micro-OLED stacks reach 50% brightness after just 10,000 hours at 1,000 nits, well below the three-year consumer expectation. eMagin’s direct-patterned OLED extended laboratory lifetimes to 20,000 hours but needs costly hermetic sealing. Quantum-dot emitters and TADF materials promise breakthroughs beyond 2028, yet present uncertainty forces OEMs to lengthen warranty reserves, adding cost pressure across the near-eye display industry.
*Our forecasts treat driver/restraint impacts as directional, not additive. The impact forecasts reflect baseline growth, mix effects, and variable interactions.
Segment Analysis
By Technology: Micro-OLED Dominance Faces MicroLED Disruption
Micro-OLED delivered 45.94% of revenue for the near-eye display market in 2025 as its production ecosystem remains mature and yields stable. However, MicroLED’s 25.21% CAGR expectation through 2031 positions it as the fastest rising architecture. The near-eye display market share for MicroLED hinges on solving mass-transfer yields, but brightness advantages above 5,000 nits already attract AR-glass OEMs. LCOS maintains traction in enterprise tools where “good enough” brightness and low-cost rule.
DLP serves rugged weapon sights, supported by Kopin’s USD 20.5 million U.S. military order in 2025, while laser beam scanning stays niche for low-light indoor eyewear. Guangdong Jade Bird Display’s 4 µm pixel pitch exemplifies how Asian foundries compress costs and accelerate adoption. If commercial MicroLED modules fall below USD 150 by 2028, the near-eye display market size for this technology tier could surpass Micro-OLED in AR glasses.


By Application: AR Smart Glasses Accelerate Beyond VR
VR head-mounted displays controlled 63.42% revenue in 2025, sustained by gaming demand, but AR smart glasses are on track for the fastest 25.53% CAGR to 2031. Meta sold over 7 million Ray-Ban smart glasses by late 2025, providing social validation that eyewear form factors can achieve mainstream uptake without “tech-toy” stigma.
Xreal’s Air 2 Pro found logistic deployments at DHL, revealing enterprise acceptance beyond pilot projects. Mixed-reality headsets serve architects and surgeons needing transparency plus immersion. Automotive head-up displays using LCOS panels now differentiate premium EVs like Lucid’s Gravity SUV. Military weapon sights, though smaller in units, deliver high margins that subsidize innovation cycles across the wider near-eye display market.
By End-User Industry: Healthcare Emerges as Growth Leader
Consumer electronics absorbed 69.78% of 2025 demand for the near-eye display market, yet healthcare’s projected 25.29% CAGR positions it as tomorrow’s headline sector. MediView’s XR90 overlays live CT/MRI scans, cutting oncology procedure times by up to 20%. Behavioral-therapy platforms validated VR exposure treatments in peer-reviewed studies, opening reimbursement pathways.
Industrial firms adopt rugged glasses for remote maintenance, while defense continues to secure multi-year budgets such as the U.S. Army’s USD 255 million IVAS 1.2 order in 2025, anchoring revenue resilience even during consumer cycles.
By Native Resolution: 4K and Beyond Capture Premium Tier
Panels between 1K-2K contributed 38.43% of the near-eye display market share in 2025 because they balance cost and clarity for mainstream VR. Displays above 4K, led by Sony’s 3,400 PPI Micro-OLED inside Apple Vision Pro, show a 25.46% CAGR outlook as premium users demand retinal fidelity. ByteDance’s Project Swan demonstrates Chinese capacity to hit 32-megapixel binocular output, edging closer to human visual acuity.
LCOS prototypes from Seiko Epson proved reflective architectures can scale to 2,800 PPI without compromising efficiency. The near-eye display market size for sub-1K panels persists for cost-sensitive industrial kits, ensuring a stratified resolution landscape through 2031.
Geography Analysis
Asia-Pacific delivered 46.81% of near-eye display revenue in 2025 and should expand at 25.06% CAGR through 2031 as China ramps OLED-on-silicon fabs and Japan advances precision coatings. BOE’s Chengdu line aims for 1 million OLED micro displays annually by 2027, trimming Chinese reliance on imported parts. Sony and Seiko Epson continue to set pixel-density benchmarks that global OEMs chase, reinforcing Japan’s influence. South Korea’s pilot MicroLED initiatives forecast localized supply for next-gen AR eyewear, while India’s gaming cafés seed grassroots VR uptake.
North America rides on dual poles of consumer and defense demand. Meta’s Quest ecosystem anchors retail momentum, and Ray-Ban smart glasses cement fashion credibility. Kopin’s USD 20.5 million weapon-sight award plus its pilot helmet project underscore military budgets that cushion R&D against cyclical consumer spending. Canada and Mexico contribute design talent and final assembly, respectively, rounding out a vertically diverse regional chain.
Europe leverages strict regulatory frameworks as a competitive moat. The EU adopted IEC 62471 and IEC TS 60825-20 for laser safety in 2025, delaying launches but elevating perceived quality. BMW’s Panoramic Vision roadway HUD and Mercedes-Benz experiments in passenger-side AR entertainment illustrate automotive demand. Defense programs in the United Kingdom and France procure hardened head-mounted displays, while the Middle East and Africa and South America record early-stage growth linked to rising smartphone penetration and government smart-city initiatives.

Competitive Landscape
In the near-eye display market, the top five firms command a combined share of approximately 45%, indicating a moderate level of fragmentation. Sony has taken the lead in the high-end Micro-OLED segment, setting a benchmark for pixel density that its competitors are eager to match. Guangdong Jade Bird Display made headlines by being the first to achieve mass production of MicroLEDs, effectively disrupting the established pricing norms in AR optics. Meanwhile, BOE's surge in capacity has become a lifeline for Chinese OEMs, simultaneously mitigating the geopolitical risks associated with reliance on Japanese supplies. These developments highlight the competitive dynamics within the market, where innovation and strategic positioning play critical roles in shaping market leadership. Companies are increasingly focusing on technological advancements and production scalability to gain a competitive edge.
Companies like Kopin, eMagin, and SeeYA are carving out their niches by leveraging unique strategies. Kopin and eMagin, for instance, have secured defense contracts, which provide a steady revenue stream and allow them to focus on niche pixel architectures. SeeYA, on the other hand, has adopted a cost leadership strategy to remain competitive in the market. Vertically integrated giants benefit significantly from their in-house capabilities, such as wafer and optics production, which enable them to maintain control over the supply chain and reduce dependency on external suppliers. In contrast, fabless challengers are accelerating their innovation cycles by collaborating with TSMC for backplanes and outsourcing bonding processes. This dual approach of vertical integration and fabless innovation underscores the diverse strategies employed by market players to address evolving consumer demands and technological advancements.
Memberships in standard-setting bodies, such as Kopin's involvement in IEC TC 110, provide companies with the opportunity to influence test metrics and procurement specifications. This strategic participation can tilt the market in favor of their proprietary technologies, offering a competitive advantage. As the costs of MicroLEDs continue to decline and the lifespans of blue-OLEDs improve, the market is expected to witness increased consolidation pressure. Firms with the financial resources to scale capital expenditures and the expertise to integrate advanced technologies, such as AI processors or eye-tracking sensors directly onto display silicon, are likely to emerge as dominant players. This trend underscores the importance of innovation, financial strength, and strategic foresight in navigating the rapidly evolving near-eye display market.
Near-Eye Display Industry Leaders
Sony Semiconductor Solutions Corporation
Seiko Epson Corporation
eMagin Corporation
Kopin Corporation
Himax Display Incorporated
- *Disclaimer: Major Players sorted in no particular order

Recent Industry Developments
- March 2026: Kopin secured a USD 3 million order for MicroLED microdisplays for combat aircraft head-up displays.
- January 2026: IEC published IEC TR 63145-202-40:2026, defining stray-light protocols for AR optics.
- December 2025: ByteDance’s PICO division revealed Project Swan, a 4K-per-eye mixed-reality headset prototype.
- November 2025: The U.S. Army finalized USD 255 million for 3,162 IVAS 1.2 units.


Global Near-Eye Display Market Report Scope
The Near-Eye Display Market Report is Segmented by Technology (Micro-OLED, LCOS, MicroLED, DLP, Laser Beam Scanning), Application (Virtual-Reality HMDs, Augmented-Reality Smart Glasses, Mixed-Reality Headsets, Automotive HUDs, Weapon Sights and Soldier HMDs), End-User Industry (Consumer Electronics, Enterprise and Industrial, Healthcare, Defense and Security), Native Resolution (Up to 1K, 1K–2K, 2K–4K, Above 4K), and Geography (North America, Europe, Asia-Pacific, Middle East and Africa, South America). Market Forecasts are Provided in Terms of Value (USD).
| Micro-OLED |
| LCOS |
| MicroLED |
| DLP |
| Laser Beam Scanning |
| Virtual-Reality Head-Mounted Displays |
| Augmented-Reality Smart Glasses |
| Mixed-Reality Headsets |
| Automotive Head-Up Displays |
| Weapon Sights and Soldier HMDs |
| Consumer Electronics |
| Enterprise and Industrial |
| Healthcare |
| Defense and Security |
| Up to 1 K (HD and below) |
| Between 1 K–2 K (FHD class) |
| Between 2 K–4 K |
| Above 4 K |
| North America | United States | |
| Canada | ||
| Mexico | ||
| Europe | Germany | |
| United Kingdom | ||
| France | ||
| Russia | ||
| Rest of Europe | ||
| Asia-Pacific | China | |
| Japan | ||
| India | ||
| South Korea | ||
| Australia | ||
| Rest of Asia-Pacific | ||
| Middle East and Africa | Middle East | Saudi Arabia |
| United Arab Emirates | ||
| Rest of Middle East | ||
| Africa | South Africa | |
| Egypt | ||
| Rest of Africa | ||
| South America | Brazil | |
| Argentina | ||
| Rest of South America | ||
| By Technology | Micro-OLED | ||
| LCOS | |||
| MicroLED | |||
| DLP | |||
| Laser Beam Scanning | |||
| By Application | Virtual-Reality Head-Mounted Displays | ||
| Augmented-Reality Smart Glasses | |||
| Mixed-Reality Headsets | |||
| Automotive Head-Up Displays | |||
| Weapon Sights and Soldier HMDs | |||
| By End-User Industry | Consumer Electronics | ||
| Enterprise and Industrial | |||
| Healthcare | |||
| Defense and Security | |||
| By Native Resolution | Up to 1 K (HD and below) | ||
| Between 1 K–2 K (FHD class) | |||
| Between 2 K–4 K | |||
| Above 4 K | |||
| By Geography | North America | United States | |
| Canada | |||
| Mexico | |||
| Europe | Germany | ||
| United Kingdom | |||
| France | |||
| Russia | |||
| Rest of Europe | |||
| Asia-Pacific | China | ||
| Japan | |||
| India | |||
| South Korea | |||
| Australia | |||
| Rest of Asia-Pacific | |||
| Middle East and Africa | Middle East | Saudi Arabia | |
| United Arab Emirates | |||
| Rest of Middle East | |||
| Africa | South Africa | ||
| Egypt | |||
| Rest of Africa | |||
| South America | Brazil | ||
| Argentina | |||
| Rest of South America | |||


Key Questions Answered in the Report
What is the 2026 value of the near-eye display market?
The market is estimated at USD 3.94 billion in 2026.
Which technology is growing fastest in near-eye displays?
MicroLED is projected to post a 25.21% CAGR through 2031 thanks to brightness and durability advantages.
Why are AR smart glasses gaining momentum after 2025?
Lighter pancake optics, sub-USD 500 retail targets, and strong content ecosystems are drawing both consumers and enterprises.
How does Asia-Pacific maintain leadership in production?
China, Japan, and South Korea combine wafer capacity, optical-coating expertise, and OLED material science to supply nearly half of global output.
What limits current Micro-OLED panels in long-term use?
Blue emitter degradation shortens operational life to about 10,000 hours at high brightness, prompting R&D into new materials.
Are safety regulations slowing product launches in Europe?
Yes, compliance with IEC laser and photobiological standards adds up to one year of validation and raises certification costs.
Page last updated on:


