Data Visualization Market Size and Share
Market Overview
| Study Period | 2019 - 2030 |
|---|---|
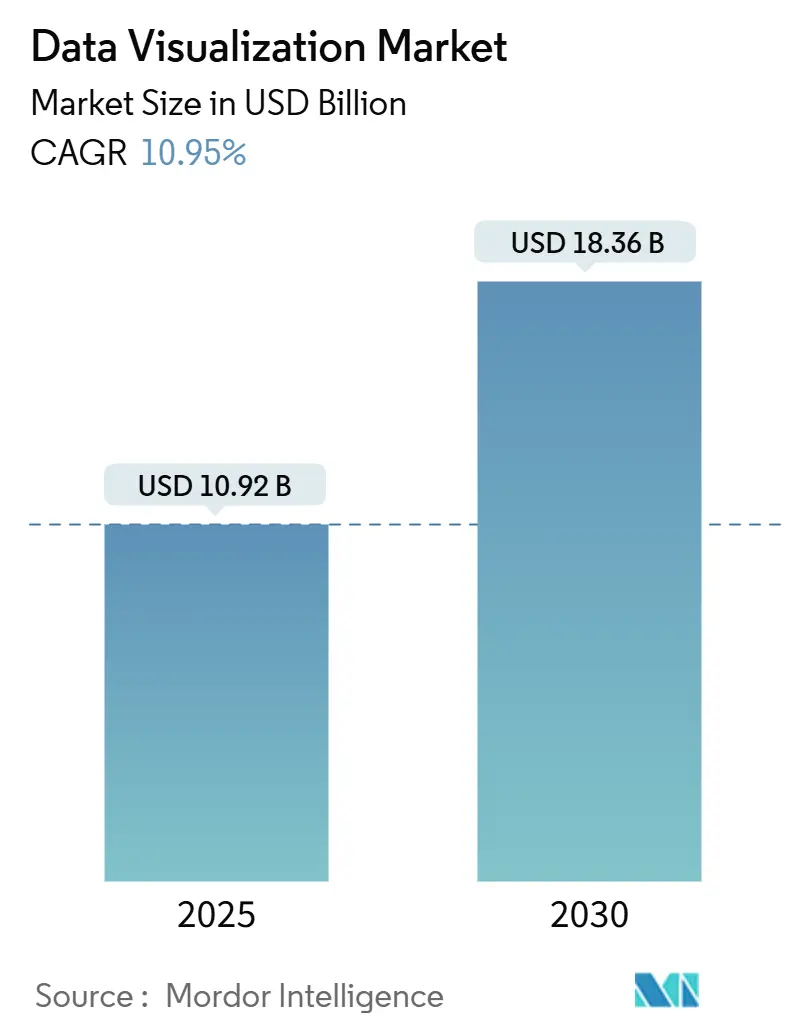
| Market Size (2025) | USD 10.92 Billion |
| Market Size (2030) | USD 18.36 Billion |
| Growth Rate (2025 - 2030) | 10.95% CAGR |
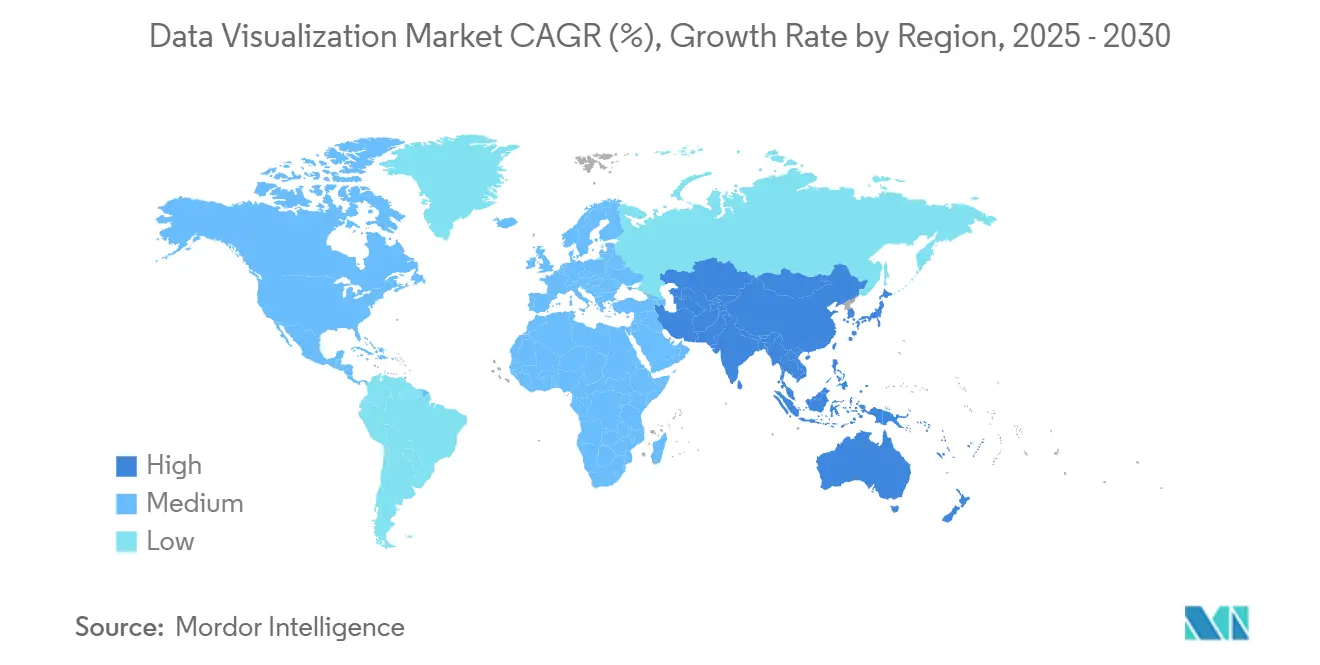
| Fastest Growing Market | Asia Pacific |
| Largest Market | North America |
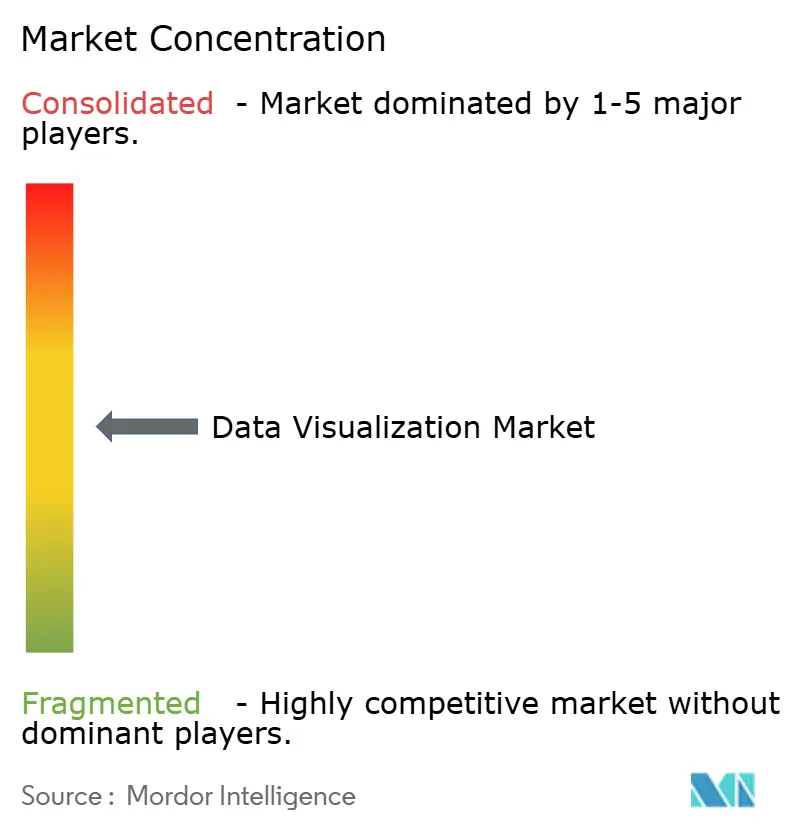
| Market Concentration | Medium |
Major Players *Disclaimer: Major Players sorted in no particular order Image © Mordor Intelligence. Reuse requires attribution under CC BY 4.0. | |
Data Visualization Market Analysis by Mordor Intelligence
The data visualization market size is valued at USD 10.92 billion in 2025 and is forecast to reach USD 18.36 billion by 2030, registering a 10.95% CAGR. Accelerating migration from static reports to real-time dashboards, maturation of cloud-native platforms, and growing commitment to workforce data literacy are reinforcing demand across the data visualization market. Large enterprises are replacing rigid on-premises stacks with integrated analytics fabrics, while small and mid-sized businesses gain affordable entry through subscription pricing. Skills shortages and hardware-intensive 3D analytics temper near-term momentum, yet continuous vendor innovation and sector-specific use cases sustain a robust outlook for the data visualization market.
Key Report Takeaways
- By deployment mode, cloud captured 63.45% of data visualization market share in 2024; the same segment is expanding at a 12.65% CAGR through 2030.
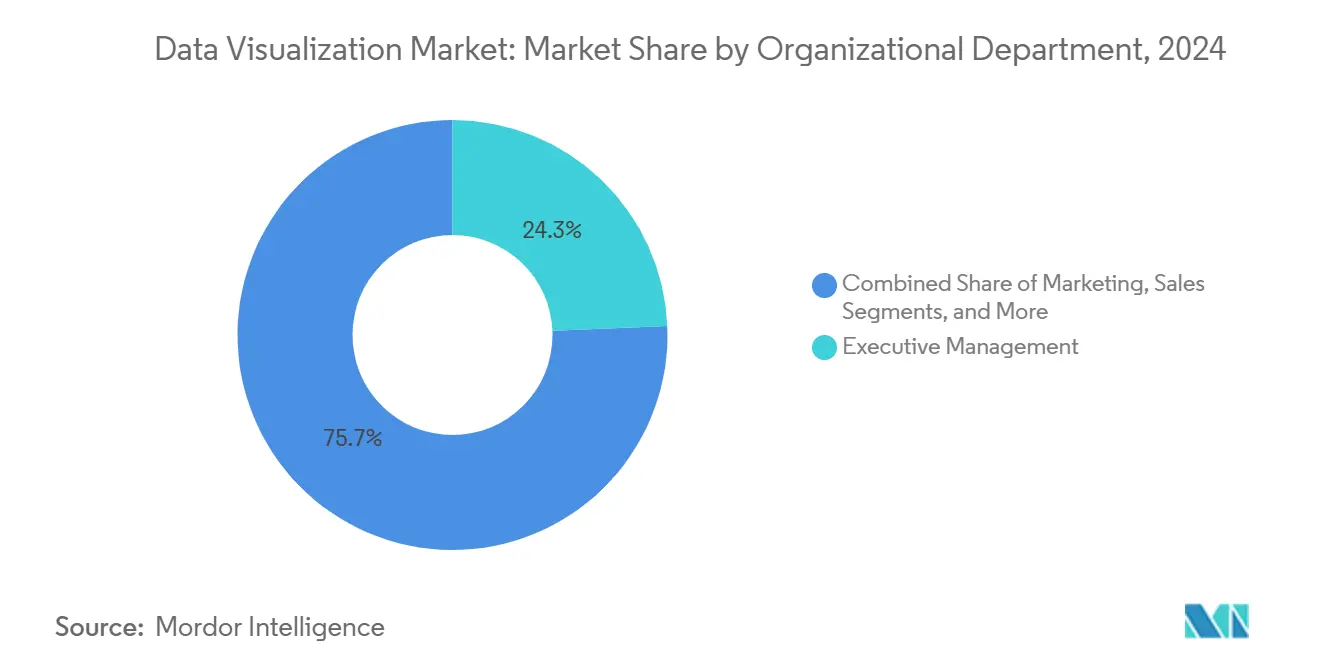
- By organizational department, executive management held 24.34% of the data visualization market in 2024, whereas human resources dashboards are growing at 11.45% CAGR to 2030.
- By end-user industry, BFSI accounted for 22.56% of data visualization market size in 2024, while healthcare and life sciences is advancing at an 11.67% CAGR over the forecast period.
- By geography, North America dominated with 37.65% share of the data visualization market in 2024; Asia Pacific is projected to lead growth at an 11.83% CAGR to 2030.
Global Data Visualization Market Trends and Insights
Drivers Impact Analysis*
| Driver | (~) % Impact on CAGR Forecast | Geographic Relevance | Impact Timeline |
|---|---|---|---|
| Cloud deployment of data-visualization solutions | +2.8% | Global, with North America and EU leading adoption | Medium term (2-4 years) |
| Rising demand for real-time decision-making dashboards | +2.1% | Global, concentrated in BFSI and manufacturing sectors | Short term (≤ 2 years) |
| Expanding self-service BI adoption among SMEs | +1.7% | APAC core, spill-over to MEA and Latin America | Medium term (2-4 years) |
| Integration of AR/VR interactive visualization | +1.4% | North America and EU, early pilots in Asia Pacific | Long term (≥ 4 years) |
| Emerging open-source columnar DBs boosting performance | +1.2% | Global, with developer-centric adoption patterns | Medium term (2-4 years) |
| Government data-literacy initiatives powering public dashboards | +0.8% | North America, EU, select APAC markets | Long term (≥ 4 years) |
| Source: Mordor Intelligence | |||
Cloud Deployment of Data-Visualization Solutions
Cloud-native architectures continue to shift analytics spending toward operating-expense models that scale elastically and bundle data integration, visualization, and AI services in one environment. Microsoft’s migration from Power BI Premium to the unified Microsoft Fabric offering illustrates how vendors simplify provisioning and add real-time stream processing without on-premises hardware investments.[1]Manis Kim, “Important update coming to Power BI Premium licensing,” Microsoft Power BI, powerbi.microsoft.com Education, such as the University of Auckland, leverages cloud BI to serve thousands of users while cutting query latency through Snowflake-backed data clouds.[2]MicroStrategy Press Team, “MicroStrategy Cloud enables University of Auckland to Revolutionise Data Accessibility,” MicroStrategy, microstrategy.com Continuous feature delivery, predictable subscription pricing, and native AI accelerators combine to keep cloud at the center of the data visualization market.
Rising Demand for Real-Time Decision-Making Dashboards
Organizations are rebuilding pipelines to push fresh data into warehouses in minutes, making low-latency visualization a competitive imperative. Benchmarks show modern connectors delivering warehouse-ready records in under 17 minutes, even during heavy transaction windows. Live fraud monitoring in banking, industrial IoT equipment dashboards, and intraday marketing optimization all hinge on sub-hour refresh, cementing real-time capabilities as a core driver for the data visualization market.
Expanding Self-Service BI Adoption Among SMEs
Only 26% of small businesses currently run BI, compared with 80% of larger peers, underscoring a sizable greenfield for vendors focused on intuitive, browser-based tooling. Pay-as-you-go licensing, drag-and-drop design, and template catalogs reduce reliance on specialized IT staff, positioning SMEs as an outsized contributor to incremental demand within the data visualization market.
Integration of AR/VR Interactive Visualization
Spatial computing lets users navigate multidimensional datasets through gesture and eye-tracking. Tableau’s Vision Pro app brings 3D storytelling to data professionals, though adoption still skews toward well-funded innovators and requires dedicated user training.[3]Tableau Editorial, “Exploring Spatial Computing and Immersive Analytics with Vision Pro,” Tableau, tableau.com Hardware prices and content-development cycles constrain mainstream take-up, placing AR/VR on a long-term growth trajectory that could unlock new frontiers for the data visualization industry.
Restraints Impact Analysis*
| Restraint | (~) % Impact on CAGR Forecast | Geographic Relevance | Impact Timeline |
|---|---|---|---|
| Shortage of visualization-skilled workforce | -1.8% | Global, acute in North America and EU | Short term (≤ 2 years) |
| Data-privacy and governance compliance hurdles | -1.3% | EU (GDPR), North America (state regulations), expanding globally | Medium term (2-4 years) |
| High TCO of GPU-accelerated 3-D analytics | -0.9% | North America and EU enterprise segments | Medium term (2-4 years) |
| Latency from fragmented real-time data sources | -0.7% | Global, concentrated in multi-cloud environments | Short term (≤ 2 years) |
| Source: Mordor Intelligence | |||
Shortage of Visualization-Skilled Workforce
Demand for experienced developers and data engineers exceeds supply, delaying project timelines and raising labor costs. The gap is most pronounced in advanced domains such as immersive visualization and GPU-accelerated analytics, where cross-disciplinary expertise is scarce. Organizations invest heavily in in-house training and certification programs, but maturation remains a near-term drag on the data visualization market.
Data-Privacy and Governance Compliance Hurdles
Stringent regulations like GDPR compel privacy-by-design architectures and granular access controls, adding implementation complexity and cost for cross-border deployments. Healthcare and financial institutions face multi-layered mandates, often necessitating regionalized clouds and specialized audit capabilities. These compliance pressures dampen velocity in regulated segments of the data visualization market.
*Our forecasts treat driver/restraint impacts as directional, not additive. The impact forecasts reflect baseline growth, mix effects, and variable interactions.
Segment Analysis
By Component: Services Drive Platform Optimization
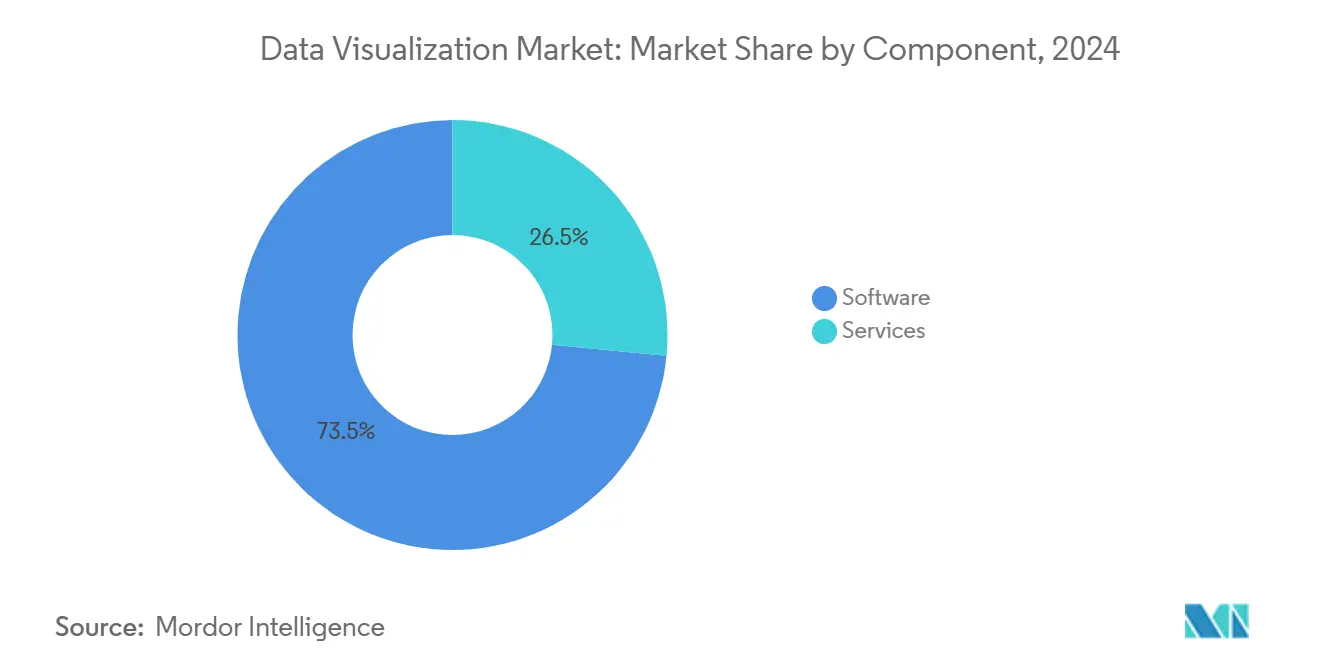
Software accounted for 73.45% of data visualization market size in 2024 as enterprises standardized on full-stack platforms that bundle ETL, modeling, and interactive dashboards. Service engagements, however, are growing at 12.34% CAGR, reflecting rising demand for migration consulting, dashboard design, and managed operations.
Implementation partners integrate connectors, optimize models, and train citizen analysts, unlocking the full return on software licenses. Vendors such as Salesforce enlist global systems integrators through alliances that expand reach and reinforce stickiness, confirming services as the fastest-moving revenue stream within the data visualization market.


By Deployment Mode: Cloud Acceleration Continues
Cloud deployments commanded 63.45% of data visualization market share in 2024 and lead expansion with a 12.65% CAGR to 2030. Elastic compute, zero-maintenance updates, and bundled AI services make cloud the de facto choice for new analytics projects.
Hybrid approaches persist where data sovereignty dictates local residency, yet even heavily regulated sectors pilot cloud sandboxes for low-risk workloads. Unified fabrics like Microsoft Fabric fuse ingestion, lakehouse storage, and visual exploration, compressing architectural sprawl and further cementing cloud primacy in the data visualization market.
By Organizational Department: HR Analytics Surge
Executive dashboards remain the largest departmental use case at 24.34% in 2024, underscoring the C-suite’s reliance on top-line KPIs. Human resources adoption, rising at 11.45% CAGR, reflects growing emphasis on retention, DEI metrics, and skill-gap analysis.
User-friendly interfaces empower HR managers to track engagement and training outcomes without SQL expertise, broadening departmental penetration. Marketing, operations, finance, and sales continue to deploy specialized dashboards, cumulatively diversifying the data visualization industry’s footprint within enterprises.

By End-User Industry: Healthcare Transformation Accelerates
BFSI retained 22.56% of data visualization market size in 2024, driven by risk analytics and compliance reporting. Healthcare and life sciences achieve the fastest expansion at 11.67% CAGR as electronic health records, clinical decision support, and population health models demand sophisticated visuals.
Industrial manufacturing, retail, and government together add substantial incremental volume through IoT telemetry, omnichannel analytics, and open-data initiatives, sustaining a broad sectoral base for the data visualization market.
Geography Analysis
North America contributed 37.65% to data visualization market share in 2024 due to mature cloud infrastructure and early adopter culture. Asia Pacific is set to outpace all other regions with an 11.83% CAGR, fueled by manufacturing digitization, e-government dashboards, and mobile-first consumer markets.
Regional data-residency rules in China and rapid fintech growth in India shape vendor go-to-market strategies, often requiring localized clouds and API ecosystems. Europe maintains steady demand anchored in GDPR-driven governance features, while Latin America and Middle East and Africa register emerging opportunities tied to broadband expansion and public-sector transparency.

Competitive Landscape
Market concentration is moderate, with Microsoft Power BI edging to 13.47% share, marginally ahead of Tableau’s 12.88%. Tight integration with Office 365 and competitive subscription pricing underpin Power BI’s momentum, while Tableau invests in Einstein AI and partner ecosystems to defend its installed base.
Open-source challengers, notably those built around DuckDB or similar engines, attract developer mindshare for lightweight use cases. Start-ups like Spindle AI receive venture backing to automate financial planning dashboards, signaling that generative analytics may reset entry barriers for the data visualization industry. Established vendors respond with embedded LLM features, vertical templates, and usage-based pricing to retain share.
Ecosystem alliances expand professional-services coverage, allowing platform providers to scale without diluting product focus. Continuous cloud updates shorten innovation cycles, compelling lagging competitors to accelerate roadmaps or risk churn in the data visualization market.
Data Visualization Industry Leaders
Salesforce.com Inc.
Microsoft Corporation
SAP SE
SAS Institute Inc.
Oracle Corporation
- *Disclaimer: Major Players sorted in no particular order

Recent Industry Developments
- September 2022: KPI 360, an AI-driven solution that uses real-time data monitoring and prediction to assist manufacturing organizations in seeing various operational data sources through a single, comprehensive industrial intelligence dashboard that sets up in hours, was recently unveiled by SymphonyAI Industrial.
- September 2022: The most recent version of the IVAAP platform for ubiquitous subsurface visualization and analytics applications was released by INT, a top supplier of data visualization software. IVAAP allows exploring, visualizing, and computing energy data by providing full OSDU Data Platform compatibility. With the new edition, IVAAP's map-based search, data discovery, and data selection are expanded to include 3D seismic volume intersection, 2D seismic overlays, reservoir, and base map widgets for cloud-based visualization of all forms of energy data.


Global Data Visualization Market Report Scope
Data visualization represents a wide range of business applications. Visualizing data is a concept used in different terms and technologies, including dashboards, infographics, scorecards, analytics, big data, and business intelligence. Data Visualization helps extract a meaningful report from the diverse and rapidly increasing volumes of business data. Many users believe that using big data for data visualization helps better decision-making.
The data visualization market is segmented into by organization department (executive management, marketing, operations, finance, sales), deployment mode (on-premise, cloud/on-demand), end user (BFSI, IT and telecommunication, education, manufacturing, government, retail/e-commerce) and geography (North America, Europe, Asia-Pacific, Latin America, and Middle East & Africa). The report offers market forecasts and size in value (USD) for all the above segments.
| Software |
| Services |
| On-premises |
| Cloud / On-demand |
| Executive Management |
| Marketing |
| Operations |
| Finance |
| Sales |
| Human Resources |
| Banking, Financial Services and Insurance (BFSI) |
| IT and Telecommunications |
| Retail and E-commerce |
| Education |
| Manufacturing |
| Government and Public Sector |
| Healthcare and Life Sciences |
| Media and Entertainment |
| Other End-user Industries |
| North America | United States | |
| Canada | ||
| South America | Brazil | |
| Argentina | ||
| Rest of South America | ||
| Europe | Germany | |
| United Kingdom | ||
| France | ||
| Italy | ||
| Spain | ||
| Russia | ||
| Rest of Europe | ||
| Asia Pacific | China | |
| Japan | ||
| India | ||
| South Korea | ||
| ASEAN | ||
| Rest of Asia Pacific | ||
| Middle East and Africa | Middle East | United Arab Emirates |
| Saudi Arabia | ||
| Turkey | ||
| Rest of Middle East | ||
| Africa | South Africa | |
| Nigeria | ||
| Kenya | ||
| Rest of Africa | ||
| By Component | Software | ||
| Services | |||
| By Deployment Mode | On-premises | ||
| Cloud / On-demand | |||
| By Organizational Department | Executive Management | ||
| Marketing | |||
| Operations | |||
| Finance | |||
| Sales | |||
| Human Resources | |||
| By End-user Industry | Banking, Financial Services and Insurance (BFSI) | ||
| IT and Telecommunications | |||
| Retail and E-commerce | |||
| Education | |||
| Manufacturing | |||
| Government and Public Sector | |||
| Healthcare and Life Sciences | |||
| Media and Entertainment | |||
| Other End-user Industries | |||
| By Geography | North America | United States | |
| Canada | |||
| South America | Brazil | ||
| Argentina | |||
| Rest of South America | |||
| Europe | Germany | ||
| United Kingdom | |||
| France | |||
| Italy | |||
| Spain | |||
| Russia | |||
| Rest of Europe | |||
| Asia Pacific | China | ||
| Japan | |||
| India | |||
| South Korea | |||
| ASEAN | |||
| Rest of Asia Pacific | |||
| Middle East and Africa | Middle East | United Arab Emirates | |
| Saudi Arabia | |||
| Turkey | |||
| Rest of Middle East | |||
| Africa | South Africa | ||
| Nigeria | |||
| Kenya | |||
| Rest of Africa | |||


Key Questions Answered in the Report
How big is the Data Visualization Market?
The Data Visualization Market size is expected to reach USD 10.92 billion in 2025 and grow at a CAGR of 10.95% to reach USD 18.36 billion by 2030.
What is the current Data Visualization Market size?
In 2025, the Data Visualization Market size is expected to reach USD 10.92 billion.
Who are the key players in Data Visualization Market?
Salesforce.com Inc., Microsoft Corporation, SAP SE, SAS Institute Inc. and Oracle Corporation are the major companies operating in the Data Visualization Market.
Which is the fastest growing region in Data Visualization Market?
Asia Pacific is estimated to grow at the highest CAGR over the forecast period (2025-2030).
Which region has the biggest share in Data Visualization Market?
In 2025, the North America accounts for the largest market share in Data Visualization Market.
What years does this Data Visualization Market cover, and what was the market size in 2024?
In 2024, the Data Visualization Market size was estimated at USD 9.72 billion. The report covers the Data Visualization Market historical market size for years: 2019, 2020, 2021, 2022, 2023 and 2024. The report also forecasts the Data Visualization Market size for years: 2025, 2026, 2027, 2028, 2029 and 2030.
Page last updated on:


