Technology, Media and Telecom
5th MayPricing Strategy for Semiconductor Components
3 Min Read
Virtualization Security Market is Segmented by Component (Solutions and Services), Virtualization Layer (Hardware/Server Virtualization, Application Virtualization, and More), Deployment Mode (On-Premise, Private Cloud, and More), End-User Industry (IT and Telecom, BFSI, Healthcare and Life Sciences, and More), Organization Size (Large Enterprises and Small and Medium Enterprises), and Geography.
Market Overview
| Study Period | 2020 - 2031 |
|---|---|
| Market Size (2026) | USD 2.98 Billion |
| Market Size (2031) | USD 6.14 Billion |
| Growth Rate (2026 - 2031) | 15.55 % CAGR |
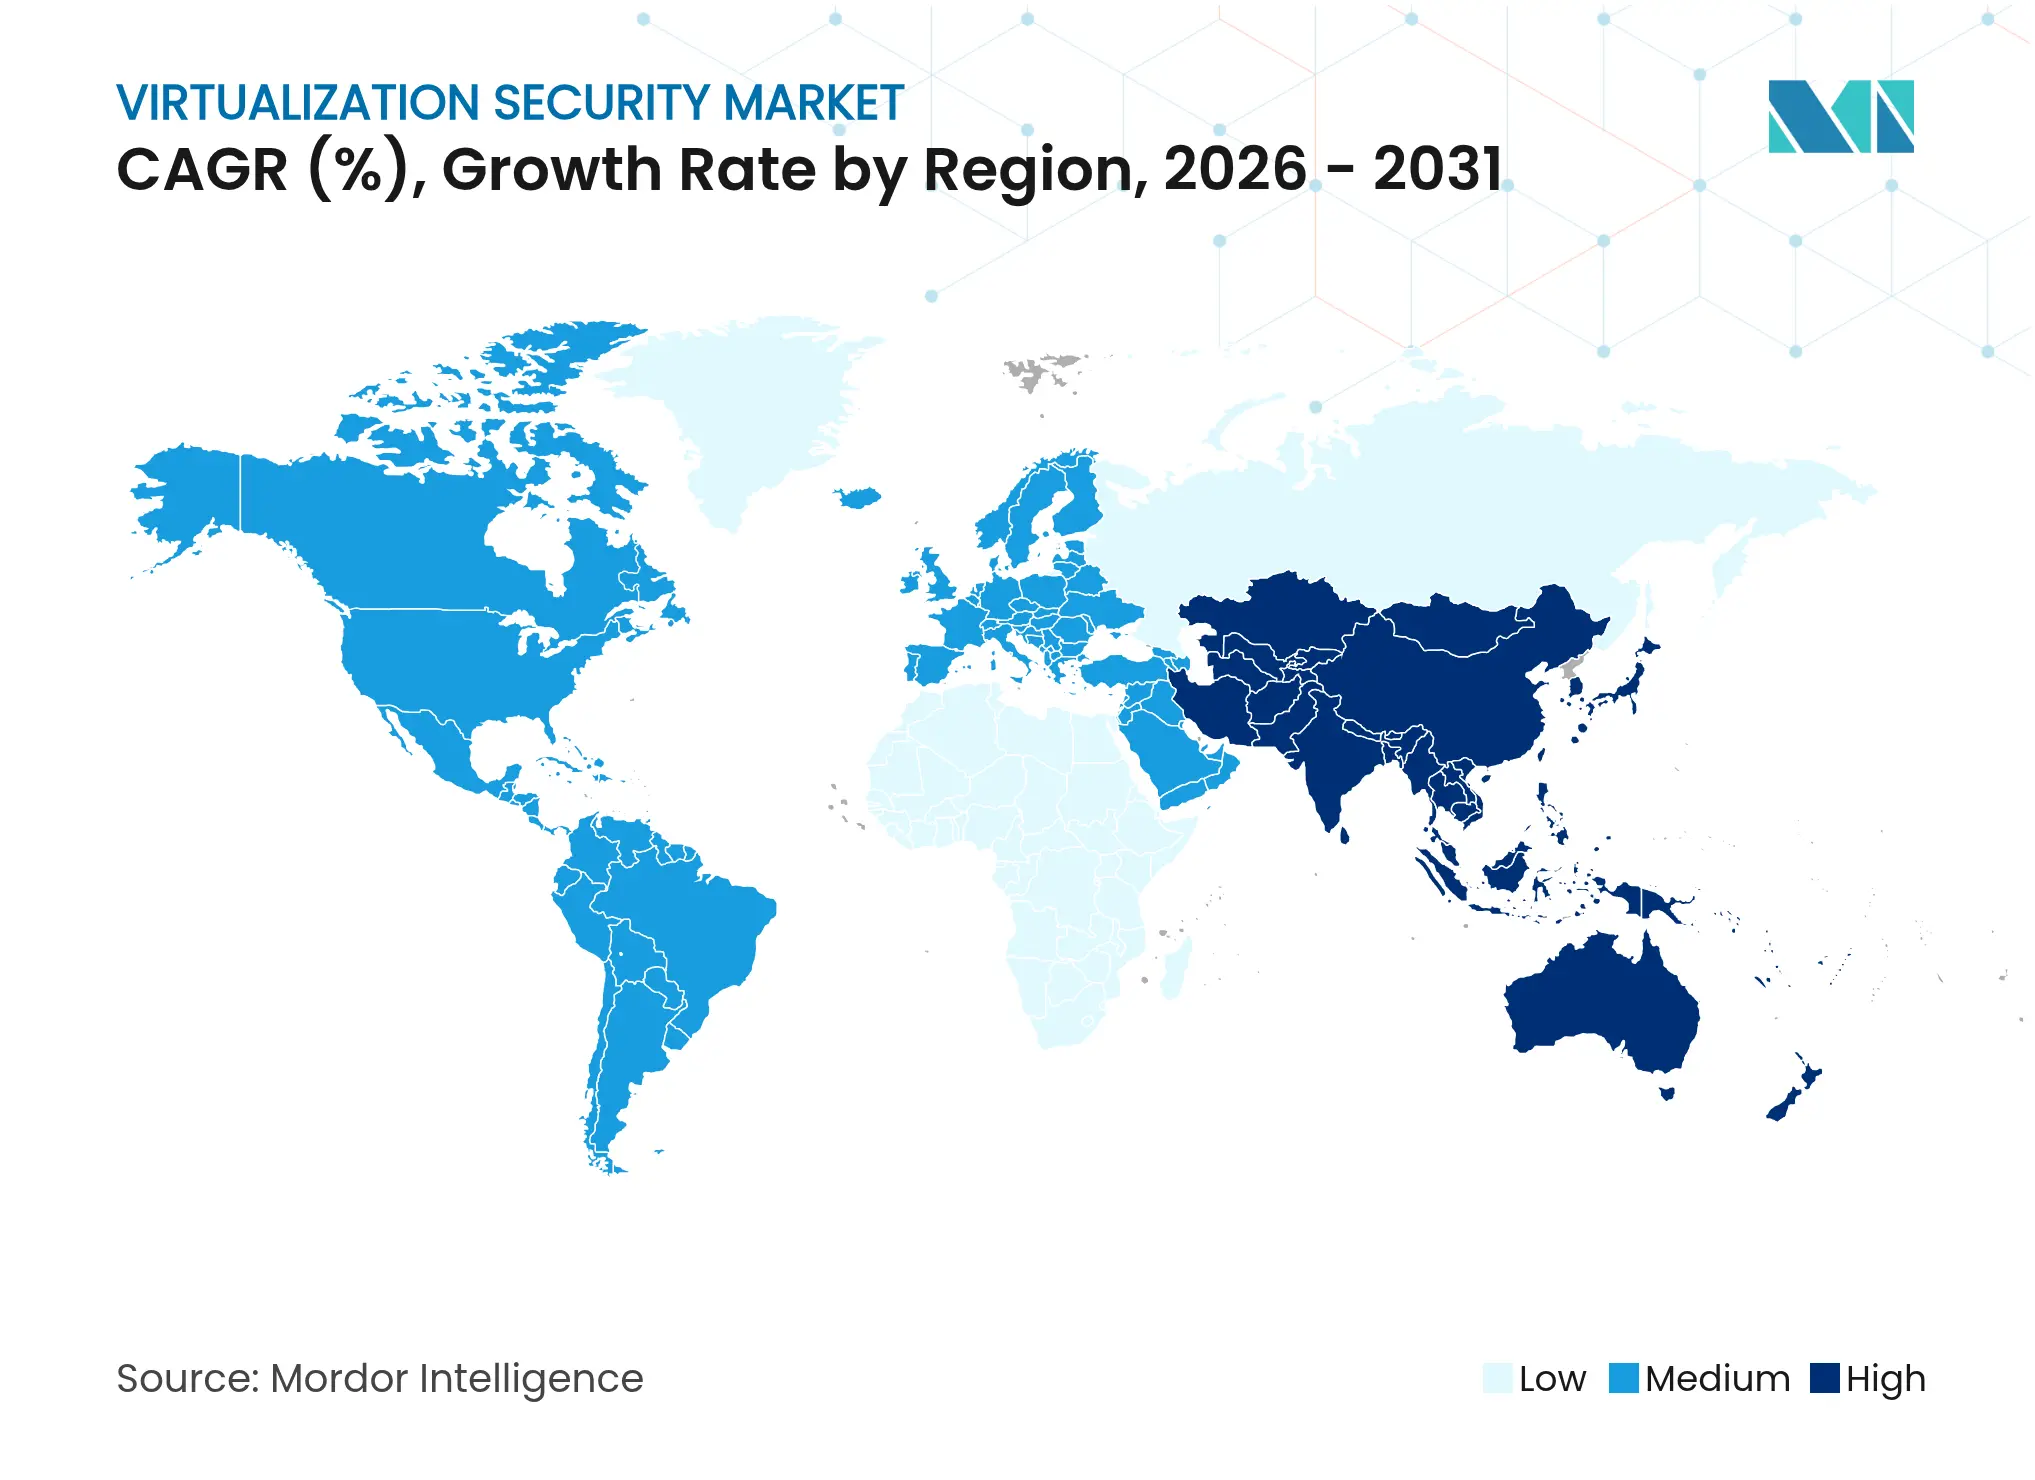
| Fastest Growing Market | Asia Pacific |
| Largest Market | North America |
| Market Concentration | Medium |
Major Players *Disclaimer: Major Players sorted in no particular order. Image © Mordor Intelligence. Reuse requires attribution under CC BY 4.0. |
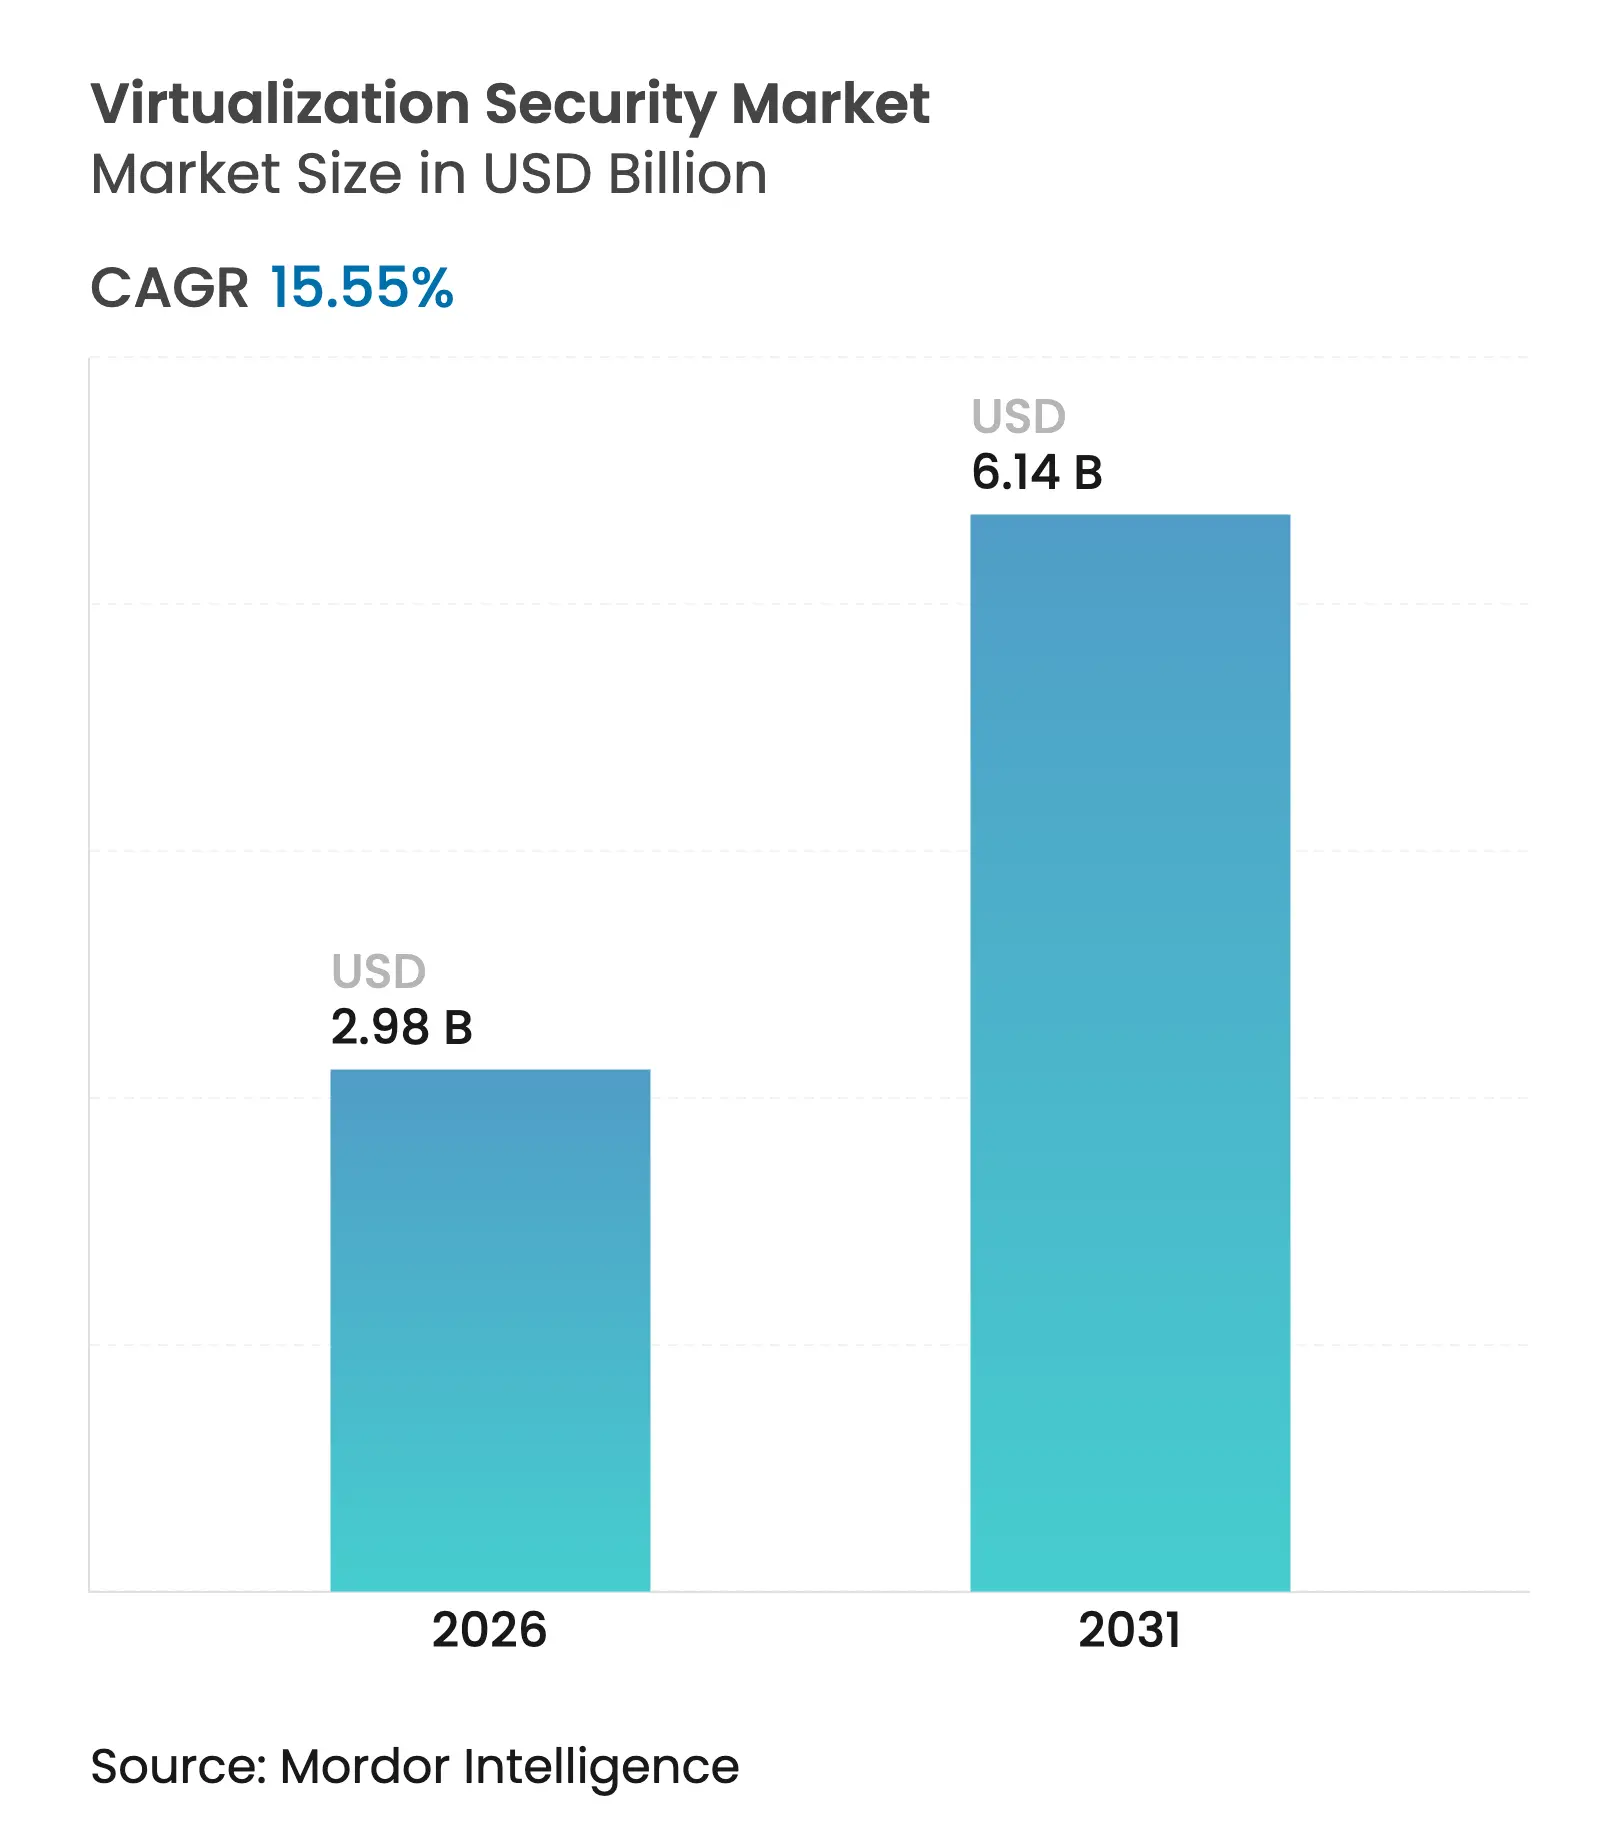
The Virtualization Security market size is expected to grow from USD 2.58 billion in 2025 to USD 2.98 billion in 2026 and is forecast to reach USD 6.14 billion by 2031 at 15.55% CAGR over 2026-2031. Rising hybrid and multi-cloud rollouts, vendor platform consolidation, and confidential-computing adoption keep demand for scalable controls high. Broadcom’s integration of VMware illustrates how bundled private-cloud subscriptions can lift both revenue and margins, underscoring enterprises’ preference for unified stacks. [1]Ryan Nair, “Broadcom sends VMware to record revenue, margins, as most big customers sign for private cloud bundles,” The Register, theregister.com At the same time, AI-driven attack-surface discovery pushes micro-segmentation from an optional add-on to a baseline requirement. Hardware-assisted defenses, such as Intel VT-rp, show that silicon innovation is now an essential layer in the virtualization security market as threat actors target hypervisor memory translation paths.
Key Report Takeaways
Note: Market size and forecast figures in this report are generated using Mordor Intelligence's proprietary estimation framework, updated with the latest available data and insights as of 2026.
Drivers Impact Analysis
| Driver | (~) % Impact on CAGR Forecast | Geographic Relevance | Impact Timeline | |||
|---|---|---|---|---|---|---|
Hybrid and multi-cloud adoption surge Hybrid and multi-cloud adoption surge | +4.2% | North America, EU | Medium term (2-4 years) | (~) % Impact on CAGR Forecast:+4.2% | Geographic Relevance:North America, EU | Impact Timeline:Medium term (2-4 years) |
Strict data-protection regulations Strict data-protection regulations | +3.8% | EU, California, India | Long term (≥ 4 years) | |||
Explosive VM and container workload growth at the edge Explosive VM and container workload growth at the edge | +3.1% | Asia-Pacific, spill-over North America | Medium term (2-4 years) | |||
Hypervisor licence inflation spurring open-source options Hypervisor licence inflation spurring open-source options | +2.4% | Global cost-sensitive markets | Short term (≤ 2 years) | |||
AI-driven attack-surface discovery AI-driven attack-surface discovery | +1.8% | North America, EU | Medium term (2-4 years) | |||
Confidential-computing attestation Confidential-computing attestation | +1.2% | Finance and Healthcare | Long term (≥ 4 years) | |||
| Source: Mordor Intelligence | ||||||
Hybrid and Multi-Cloud Adoption Surge
Broadcom lifted VMware Cloud Foundation revenue to USD 21.5 billion in fiscal 2024, proving that customers want a single control plane across private and public clouds. As workloads hop among environments, east-west visibility becomes as critical as perimeter defense. Azure Confidential VMs show how trusted execution environments can preserve encryption in use while enabling seamless migration. Identity-centric and zero-trust models now replace traditional perimeter zoning because policies have to follow each workload, not each subnet. Pay-as-you-go consumption also keeps enterprises from stalling modernization projects when budgets tighten.
Strict Data-Protection Regulations (GDPR, CCPA, DPDPA)
India’s new DPDPA rules mandate explicit purpose limitation and cross-border transfer restrictions that must be embedded into virtualization blueprints. Similar mandates in Malaysia and Vietnam drive demand for built-in audit trails and encryption key governance. Healthcare systems adopt HIPAA-compliant virtual workspaces, keeping ePHI off personal devices while allowing remote clinicians to work securely. Penalties for non-compliance now outweigh license fees, so the virtualization security market embeds privacy-by-design principles into every release.
Explosive VM and Container Workload Growth in Edge Data-Centers
Lightweight Kubernetes flavors such as k3s reduce footprint but often lag in default hardening; research shows security compliance gaps compared with KubeEdge. Attackers exploit container namespaces to pivot into OT networks, so vendors unify hypervisor and container firewalls. Optimus, an association-based filter, cuts container system calls by 69.4%, illustrating how automated reduction of attack surface is gaining traction. Manufacturing plants adopting Industry 4.0 rely on real-time analytics at the edge, fueling a serviceable market for low-latency inspection engines.
AI-Driven Attack-Surface Discovery Boosting Micro-Segmentation Demand
Akamai’s Guardicore AI uses large-language-model techniques to map every flow and auto-generate zero-trust policies in minutes. VMware vDefend adds GenAI-based triaging to shrink dwell time between detection and response. Fortune 500 adopters apply 1,000 micro-segmentation policies in under 90 days, validating AI’s role in operational scale.
Restraints Impact Analysis
| Restraint | (~) % Impact on CAGR Forecast | Geographic Relevance | Impact Timeline | |||
|---|---|---|---|---|---|---|
High up-front cost of specialised security appliances High up-front cost of specialised security appliances | -2.8% | Global, more pronounced in emerging markets | Short term (≤ 2 years) | (~) % Impact on CAGR Forecast:-2.8% | Geographic Relevance:Global, more pronounced in emerging markets | Impact Timeline:Short term (≤ 2 years) |
Shortage of skilled virtual-security engineers Shortage of skilled virtual-security engineers | -1.9% | Worldwide; most acute in Asia-Pacific and other emerging markets | Long term (≥ 4 years) | |||
VM sprawl complicating zero-trust enforcement VM sprawl complicating zero-trust enforcement | -1.4% | North America and Europe, moving into Asia-Pacific | Medium term (2-4 years) | |||
Quantum-ready encryption premiums delaying purchase cycles Quantum-ready encryption premiums delaying purchase cycles | -0.9% | Global, with early impact on finance and government users | Long term (≥ 4 years) | |||
| Source: Mordor Intelligence | ||||||
High Up-Front Cost of Specialized Security Appliances
KubeVirt and OpenShift are evaluated as cost-effective alternatives to traditional vSphere licenses, especially after Broadcom’s pricing changes. Surveys show 78% of small businesses lack antivirus for virtual servers, while 48% run without proper firewalls due to budget limits. Trusted-chip supply disruptions inflate appliance costs, delaying refresh cycles.
Shortage of Skilled Virtual-Security Engineers
Converging IT/OT estates demand specialists who understand both IEC-62443 and cloud IAM; such profiles remain scarce, prompting a pivot to managed-service models. Automation fills gaps, yet policy fine-tuning still needs human insight, keeping service growth high.
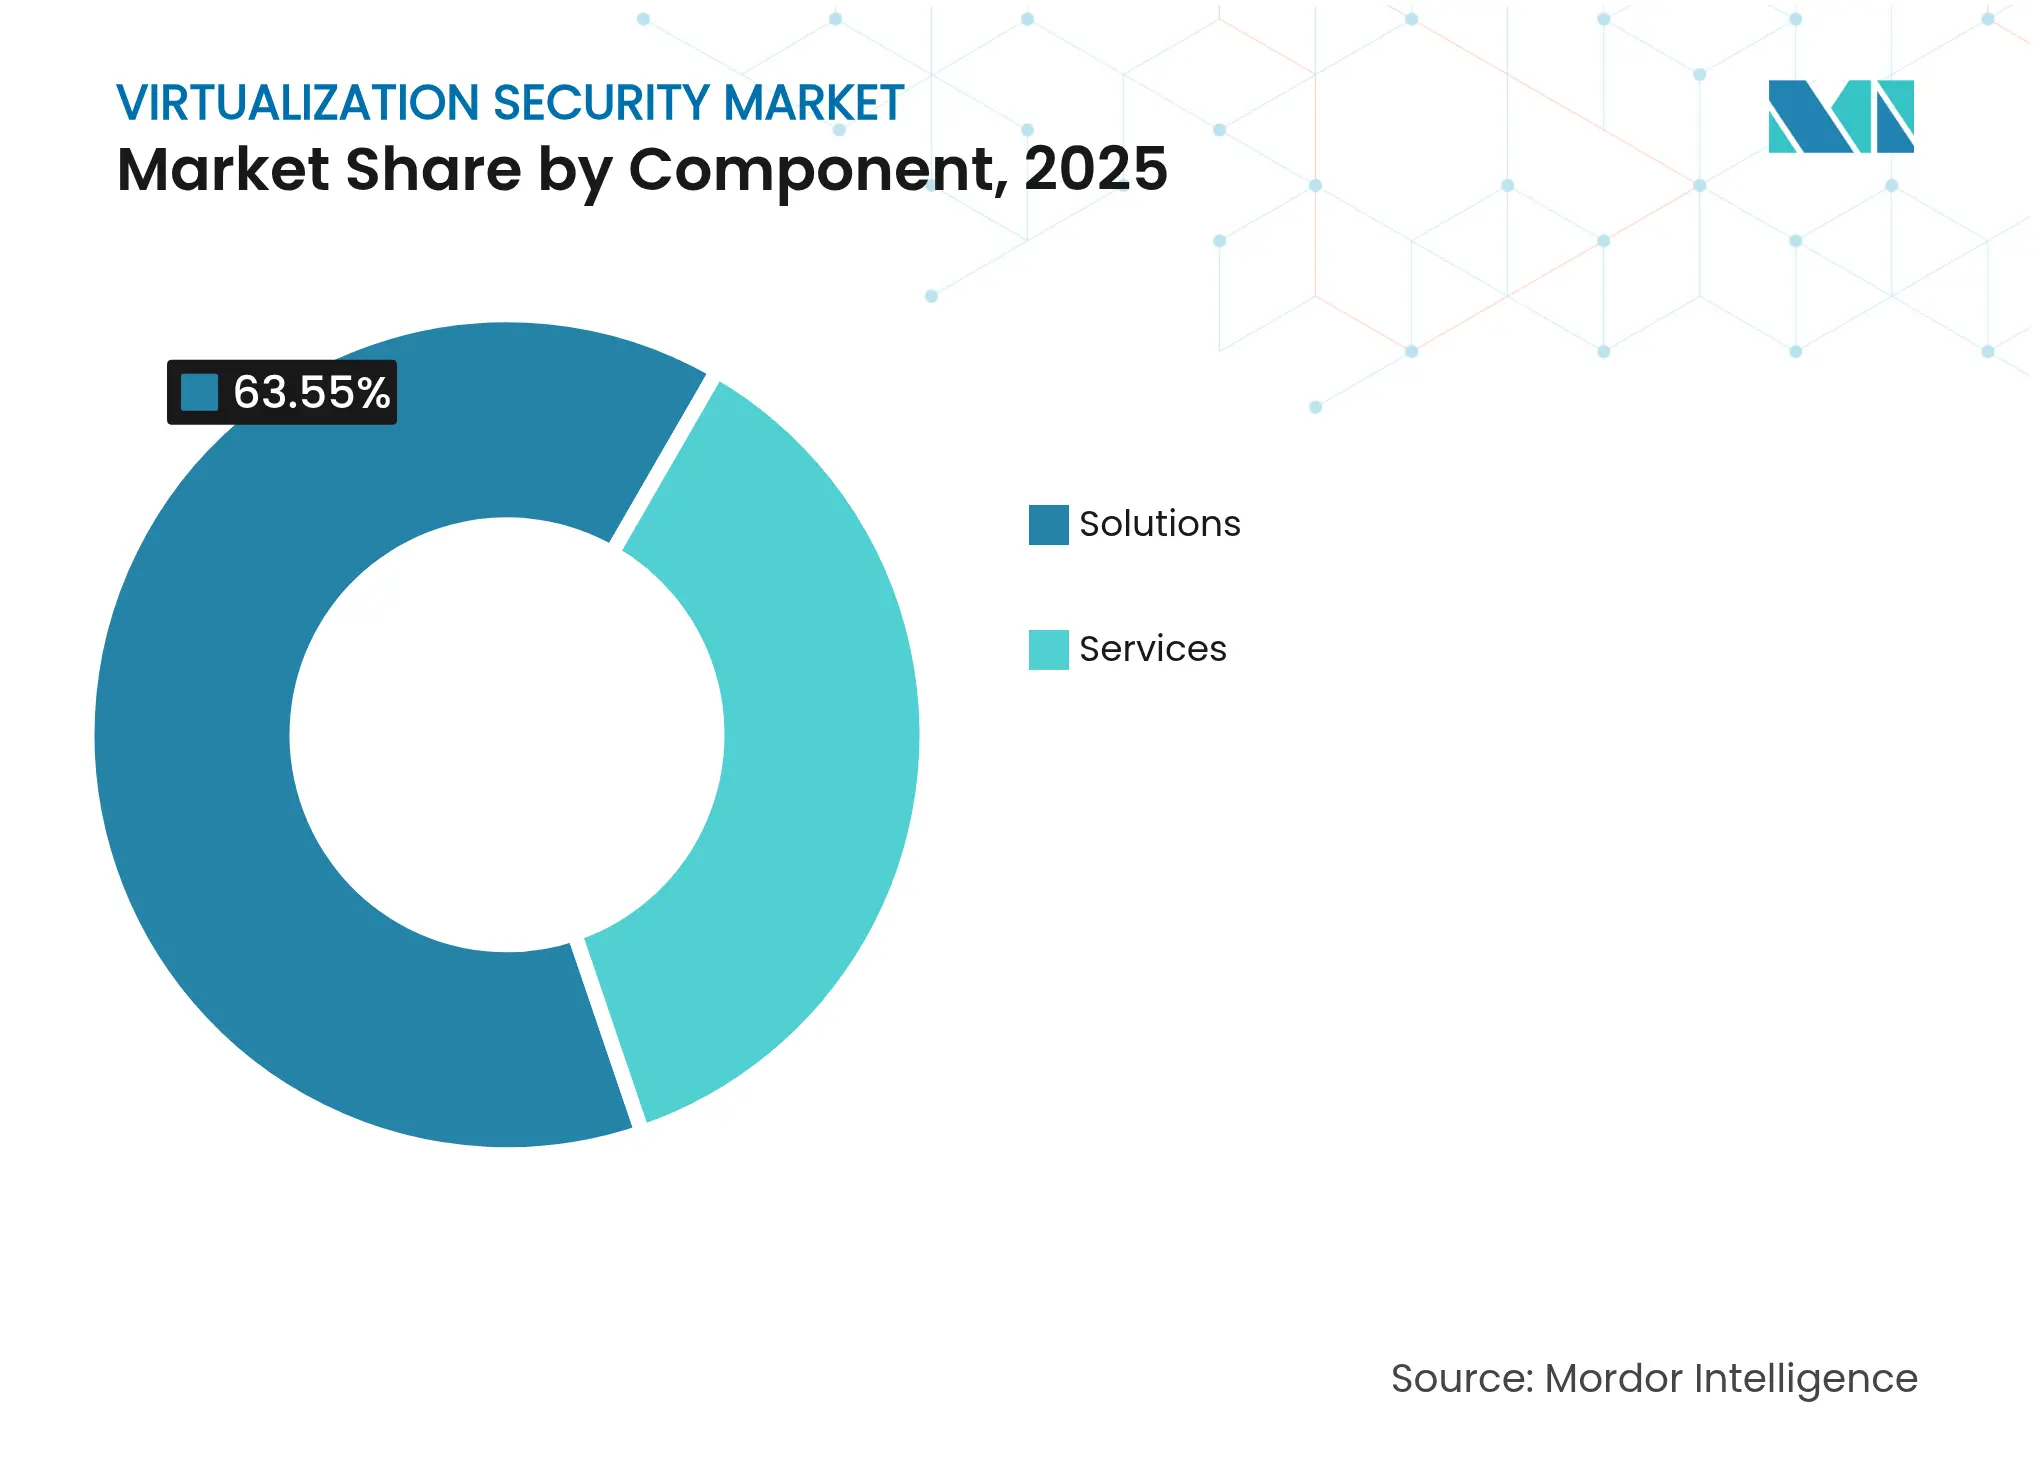
By Component: Solutions Dominance Drives Platform Consolidation
Solutions accounted for 63.55% of the virtualization security market share in 2025 as enterprises gravitated toward integrated suites rather than piecemeal tools. Palo Alto Networks’ Next-Generation Security ARR climbed 34% to USD 4.8 billion, a clear indicator that platformization resonates with buyers. Services replicate this momentum, growing at 18.85% CAGR because intricate hybrid designs require third-party expertise. Vendors like Fortinet fold acquisitions such as Lacework into a single fabric, shrinking tool sprawl, and locking customers into longer contracts. The virtualization security market size is, therefore, skewing toward bundled offerings that combine CNAPP, micro-segmentation, and zero-trust network access in one license.
Smaller enterprises benefit from SaaS consumption patterns that remove up-front appliance costs and staffing burdens, democratizing access. As a result, service providers target this under-penetrated tier with off-the-shelf deployment blueprints and monthly subscription pricing.
Note: Segment shares of all individual segments available upon report purchase
By Virtualization Layer: Network Transformation Accelerates SD-WAN Security
Hardware/Server Virtualization retained a 45.85% share in 2025 owing to its foundational role in VM isolation. Intel VT-rp exemplifies hardening at the silicon layer, obstructing paging structure tampering and reinforcing hypervisor trust boundaries. Yet, Network and SD-WAN Virtualization will outpace all layers, registering an 18.05% CAGR as AI-native fabrics like Cisco Hypershield embed kernel-level policy enforcement across distributed pods. The virtualization security market size for network layers will widen further when OT factories virtualize sensors and PLCs, requiring deterministic but secure traffic flows.
By Deployment Mode: Hybrid Cloud Emerges as Strategic Imperative
Public Cloud led with a 33.25% share in 2025, yet Hybrid Cloud is expanding at a 17.55% CAGR because enterprises juggle sovereignty, latency, and cost. Up to 80% of CIOs plan workload repatriation from hyperscalers to private clouds, then burst back out for seasonal peaks, complicating policy orchestration. VMware Cloud Foundation’s bundled sales prove appetite for a single pane of glass across modes, fuelling the virtualization security market.

Recognized by Experts. Trusted by Leaders.
A trusted intelligence partner to global decision-makers across 90+ countries.


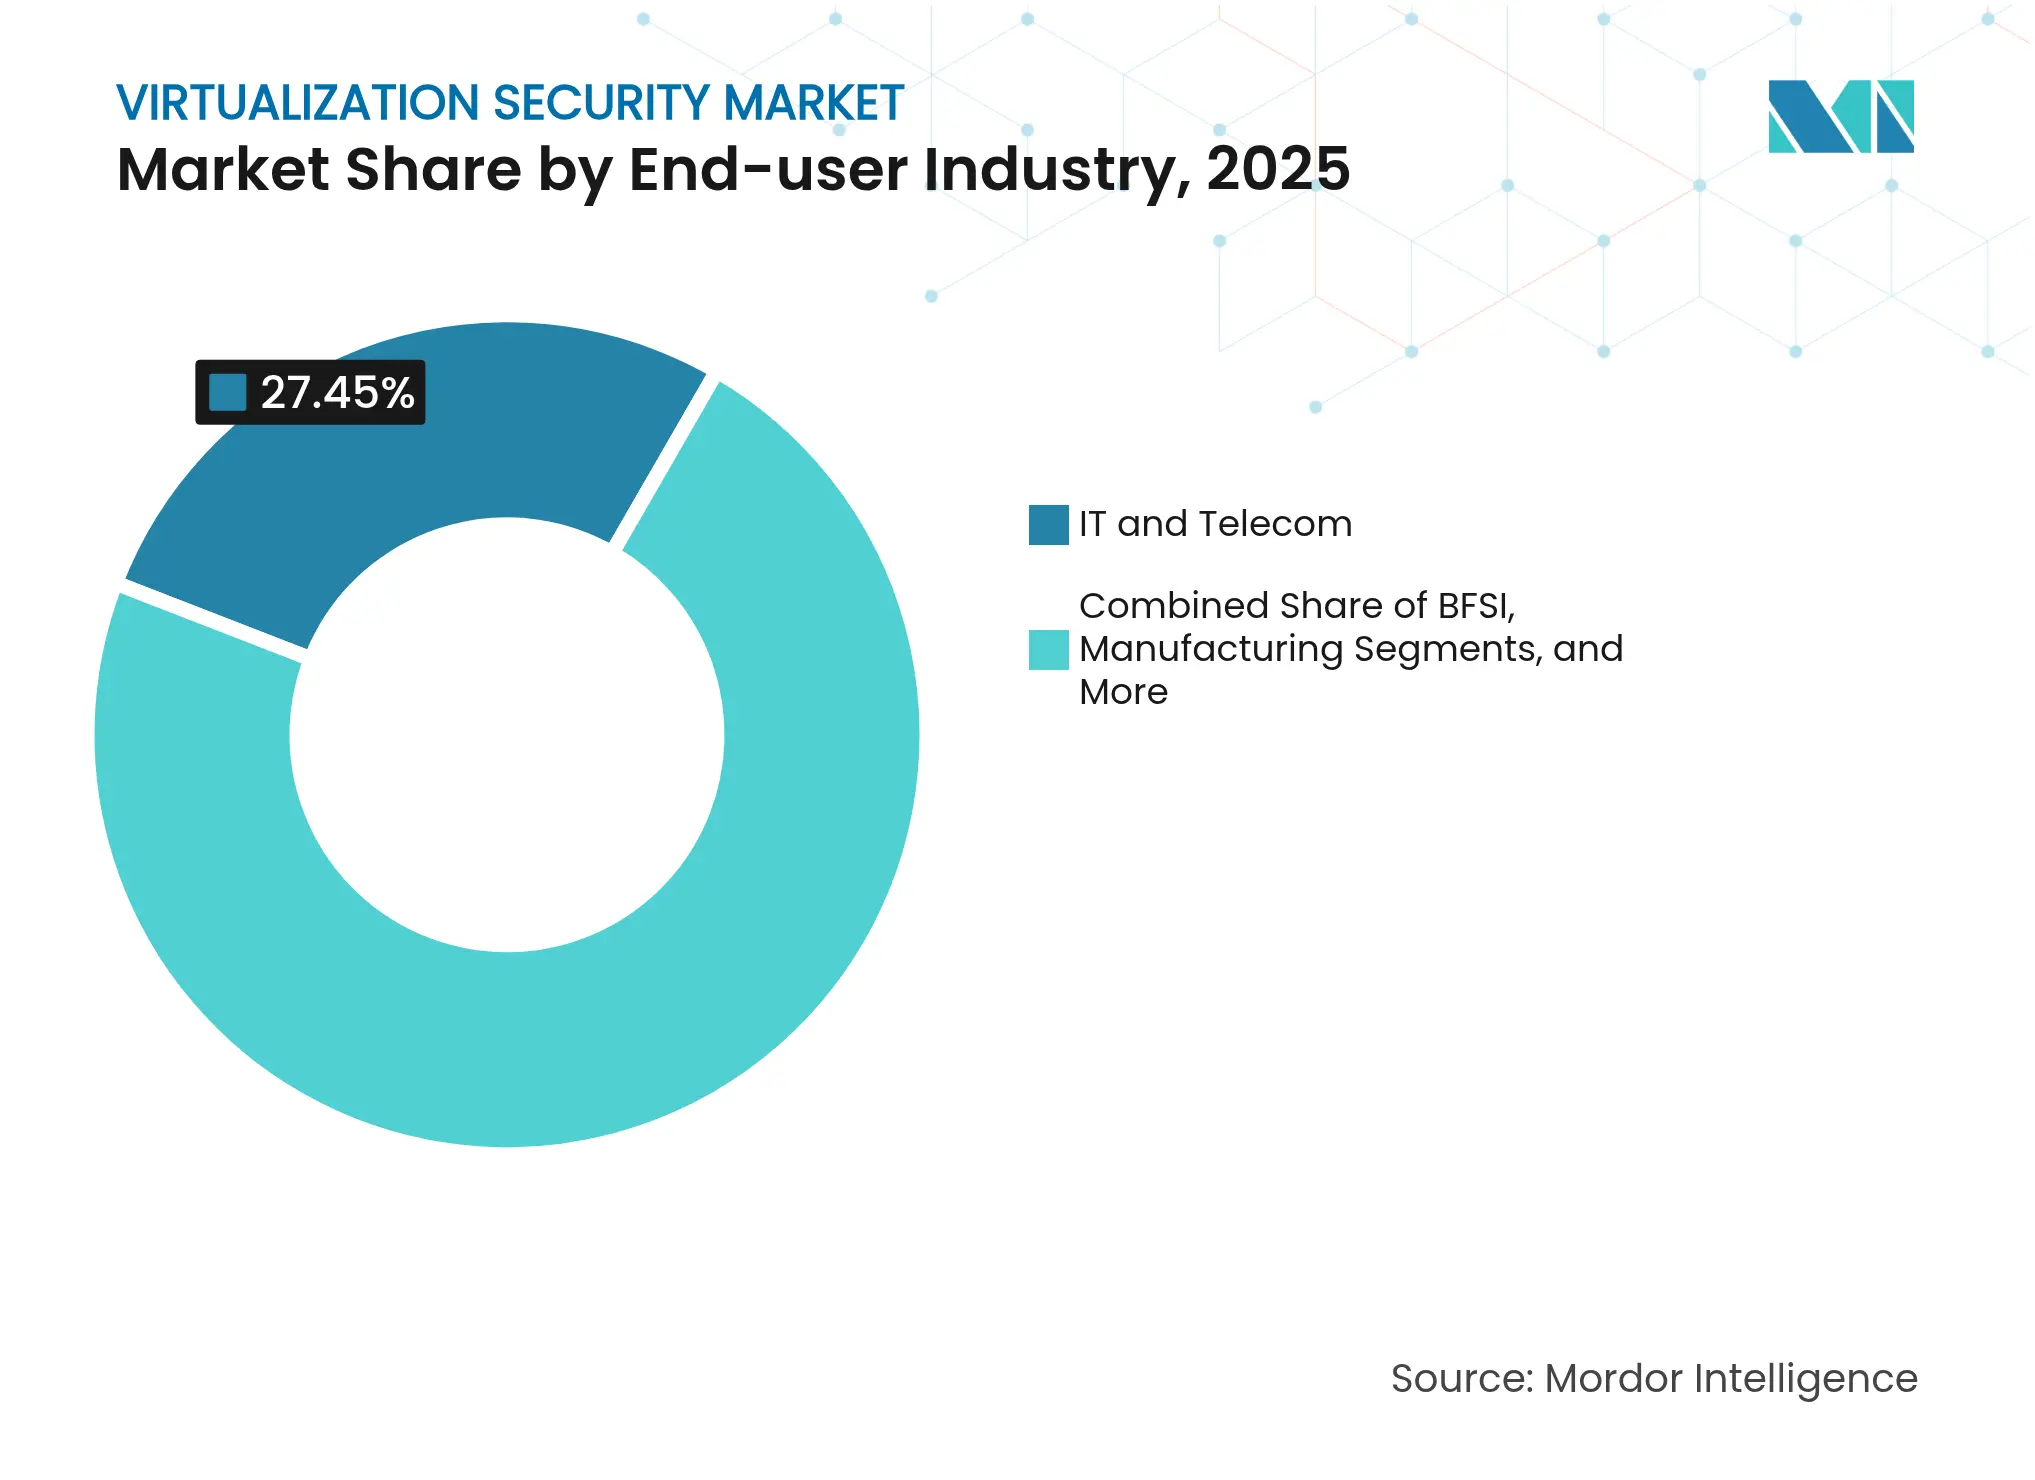
By End-user Industry: Healthcare Drives Compliance-Centric Adoption
IT and Telecom represented 27.45% revenue in 2025, but Healthcare will grow fastest at 16.95% CAGR. Guthrie Clinic’s virtual care hub saved USD 7 million in labor while halving nurse turnover, all under a secure, zero-trust virtual desktop model. Ransomware-laden attacks on hospitals elevate micro-segmentation to board-level priority.
Note: Segment shares of all individual segments available upon report purchase
By Organization Size: SME Adoption Accelerates Through Cloud-Native Solutions
Large enterprises held a 65.55% share in 2025, yet SME demand is climbing with an 18.35% CAGR because SaaS pricing eliminates capex hurdles. Security orchestration, formerly reserved for Fortune firms, now arrives pre-tuned, letting smaller IT teams enforce least privilege across virtual servers without mastering every framework.
North America contributed 34.90% of revenue in 2025, sustained by early zero-trust adoption and strict sectoral mandates such as HIPAA and CCPA. Vendors concentrate R&D and channel ecosystems in the United States, shortening feedback cycles and quickening feature delivery.
Asia-Pacific is the high-velocity engine, set to grow 17.85% annually through 2031. India’s DPDPA and Malaysia’s stricter data officer obligations nudge even midsize firms to adopt audit-ready virtualization stacks. Manufacturing clusters across China, Vietnam, and Thailand virtualize shop-floor workloads, driving edge-security shipments.
Europe keeps a steady pace under GDPR. The Schrems II ruling amplifies interest in confidential-computing attestation to satisfy data transfer conditions. Meanwhile, GCC nations channel oil-windfall budgets into smart-city and e-government projects that rely on secure virtualized clouds, creating a nascent but strategic opportunity for specialists.

Reports are available across multiple geographies.
Gain in-depth market insights across regions to support informed decisions.
Market Concentration
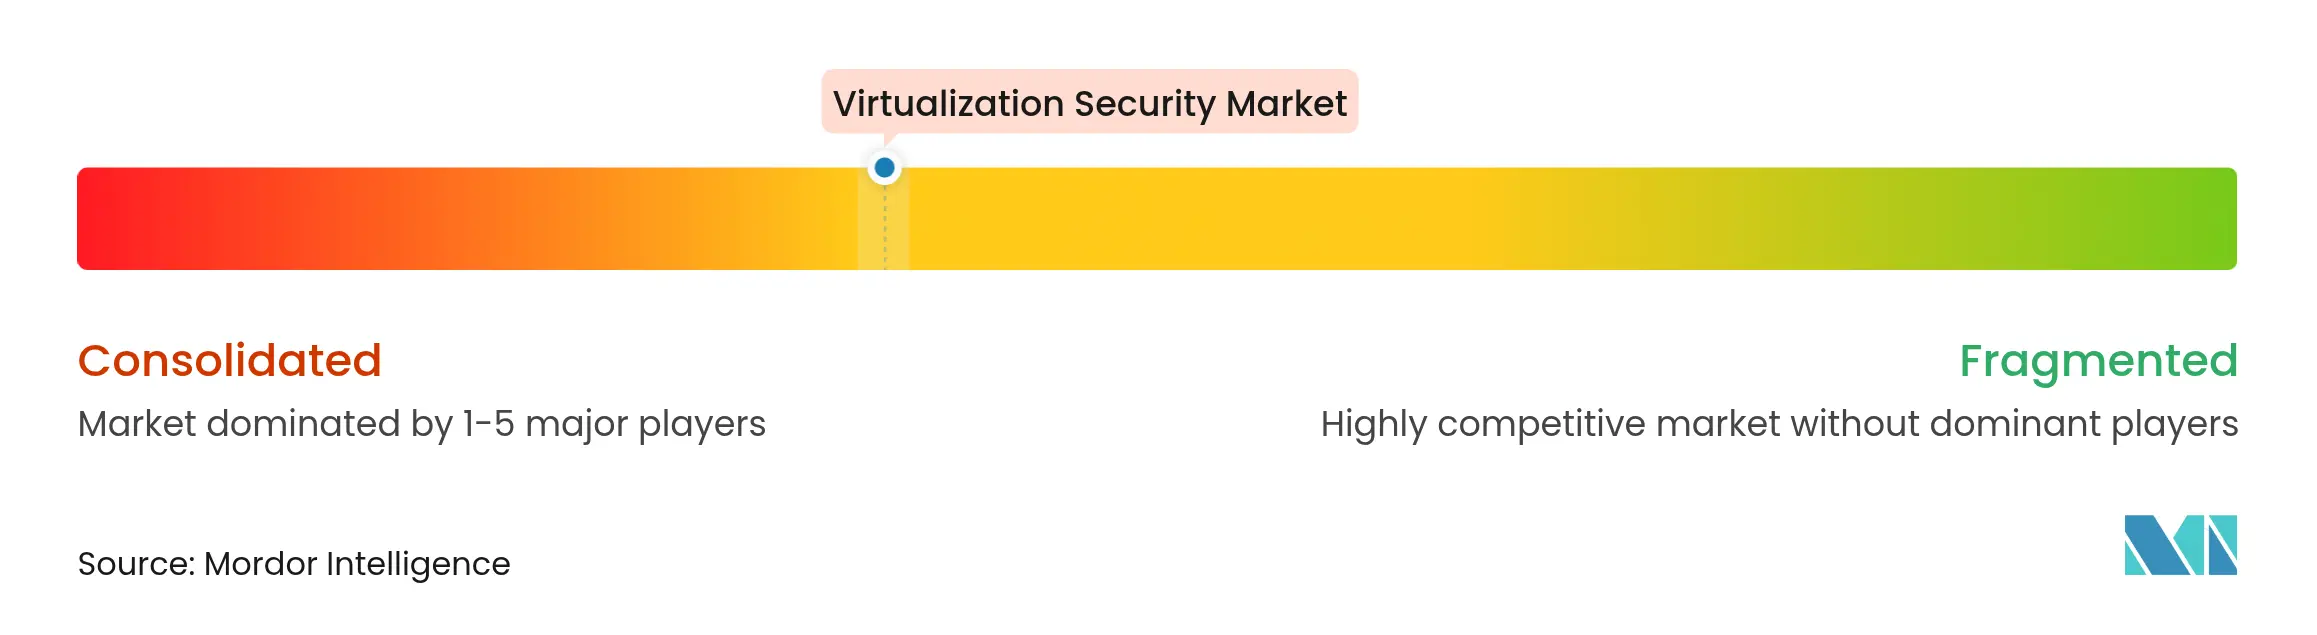
The virtualization security market sits in a moderate-concentration zone. Palo Alto Networks, Fortinet, and Broadcom-VMware form a triad whose combined portfolios span CNAPP to SD-WAN. Their platform revenue grew by double digits—Broadcom’s infrastructure software climbed 25% y/y to USD 6.6 billion in Q2 2025. Secondary leaders differentiate via identity and machine-identity convergence; CyberArk combined with Venafi to broaden a USD 10 billion TAM. Disruptors like Elisity carve niches with AI-driven micro-segmentation. Hardware alliances also surface—Intel and AMD race to certify TEEs that cloud providers can attest universally via Google Cloud Attestation

*Disclaimer: Major Players sorted in no particular order
1. INTRODUCTION
2. RESEARCH METHODOLOGY
3. EXECUTIVE SUMMARY
4. MARKET LANDSCAPE
5. MARKET SIZE AND GROWTH FORECASTS (VALUES)
6. COMPETITIVE LANDSCAPE
7. MARKET OPPORTUNITIES AND FUTURE TRENDS
Market Definitions and Key Coverage
Our study defines the virtualization security market as global spending on software-based tools that protect hypervisors, virtual machines, software-defined networks, and containerized workloads across on-premise, private, public, and hybrid clouds. Protection layers include workload isolation, micro-segmentation, intrusion detection, virtual firewalls, encryption, credential governance, and policy orchestration.
Scope exclusion: hardware-only firewalls and pure virtualization management suites that lack a native security layer are not counted.
Segmentation Overview
Detailed Research Methodology and Data Validation
Primary Research
Mordor analysts interviewed cloud architects, CISO office members, managed security providers, and channel distributors across North America, Europe, and Asia-Pacific. Discussions clarified average VM-to-host densities, contract pricing trends, and the cadence at which customers refresh virtual defense stacks, filling gaps left by published data and anchoring assumptions to lived practice.
Desk Research
We first mapped demand pockets through open datasets such as NIST vulnerability disclosures, CISA incident advisories, Eurostat ICT enterprise surveys, and Cloud Security Alliance white papers. Shipment series for servers and hypervisors from IDC and Statista, along with import-export logs available via Volza, helped us size the install base that actually needs protection. Annual reports, S-1s, and investor presentations were then mined for security revenue splits and regional ASPs, which we cross-checked on Dow Jones Factiva and D&B Hoovers. These named sources illustrate the mix; many other publicly available documents also informed our desk work.
A second pass extracted regulatory milestones (PCI DSS 4.0 rollout, EU-NIS2 adoption) and breach statistics that signal spend inflection points. This context guided later model assumptions.
Market-Sizing & Forecasting
We applied a top-down production and trade reconstruction: global virtual server shipments were multiplied by prevailing VM densities and average security spend per virtualized workload, then segmented by region and deployment mode. Supplier roll-ups and channel checks provided selective bottom-up benchmarks that were used to adjust totals where visible deviation exceeded five percent. Key variables fed into a multivariate regression for 2025-2030 cloud migration rate, zero-trust adoption, regulated industry share, VM density progression, and mean security ASP to forecast a balanced CAGR. Gap areas in bottom-up inputs were bridged with interpolation from nearest secure data points before validation.
Data Validation & Update Cycle
Model outputs undergo variance checks against breach counts, license activations, and macro IT spend indices. Senior analysts review anomalies, and findings are refreshed each year, with interim revisions when material events, major vulnerabilities, policy moves, or landmark deals shift the baseline.
Why Mordor's Virtualization Security Baseline Stands Reliable
Benchmark comparison
Published estimates often diverge because firms choose different cut-offs for what constitutes "security," favor varying ASP assumptions, or refresh at dissimilar intervals.
Key gap drivers include inclusion of management-only tools, reliance on list prices without regional discount factors, and limited validation of cloud usage in fast-growing Asian markets, areas where Mordor's disciplined scope and annual ground checks keep our figure centered.
| Market Size | Anonymized source | Primary gap driver | ||
|---|---|---|---|---|
USD 2.58 Bn (2025) | Mordor Intelligence | - | Anonymized source:Mordor Intelligence | Primary gap driver:- |
USD 2.54 Bn (2024) | Global Consultancy A | Blended security plus admin software; narrower SaaS channel sampling | ||
USD 2.70 Bn (2024) | Industry Association B | Uses list prices, omits OEM bundle erosion, updates every two years | ||
USD 2.97 Bn (2025) | Trade Journal C | Survey intent data heavy, limited Asia validation |
Pricing Strategy for Semiconductor Components
3 Min Read
Accelerating Additive Manufacturing Adoption in India
3 Min Read
Feasibility Analysis for FBO Services in East Africa
3 Min Read
When decisions matter, industry leaders turn to our analysts. Let’s talk.