Size and Share of Desktop Virtualization Market In Financial Services Industry
Market Overview
| Study Period | 2019 - 2030 |
|---|---|
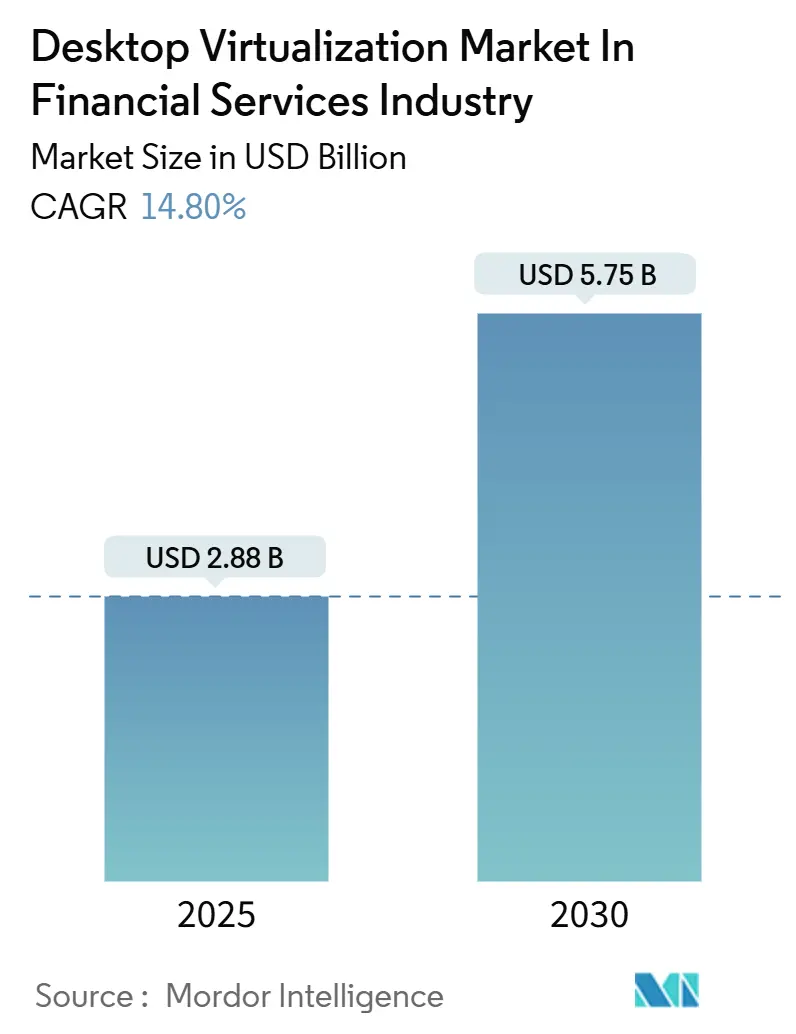
| Market Size (2025) | USD 2.88 Billion |
| Market Size (2030) | USD 5.75 Billion |
| Growth Rate (2025 - 2030) | 14.80% CAGR |
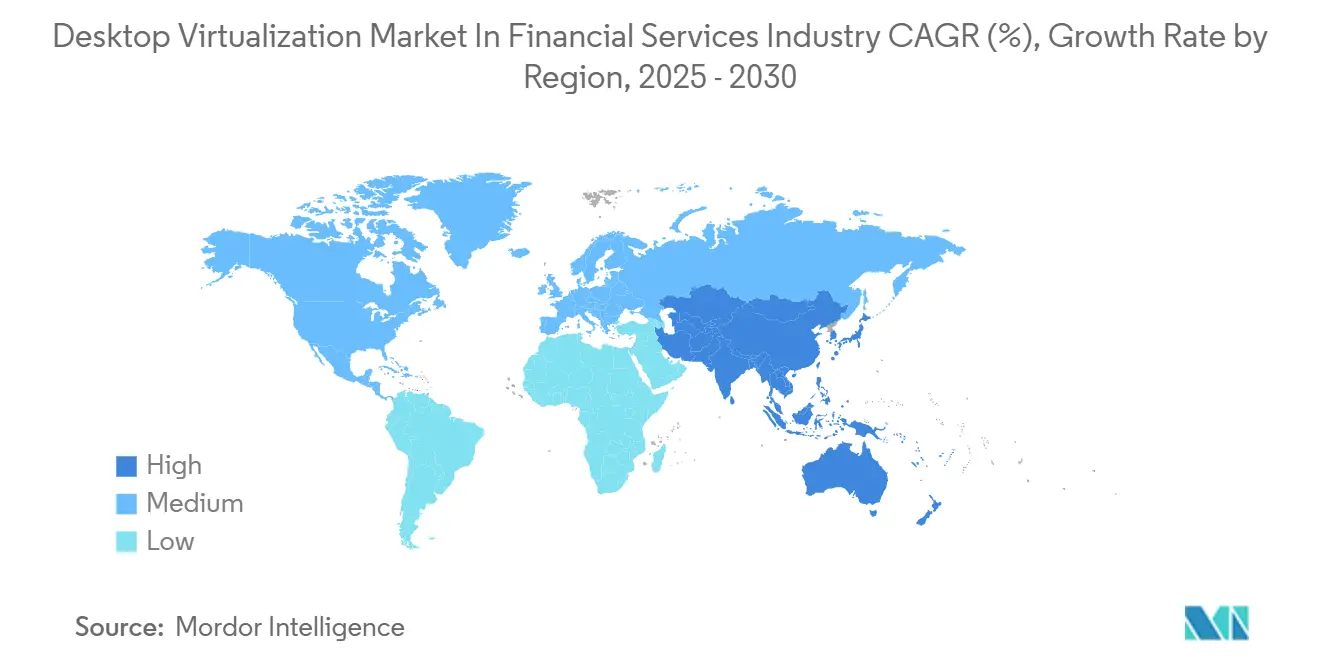
| Fastest Growing Market | Asia Pacific |
| Largest Market | North America |
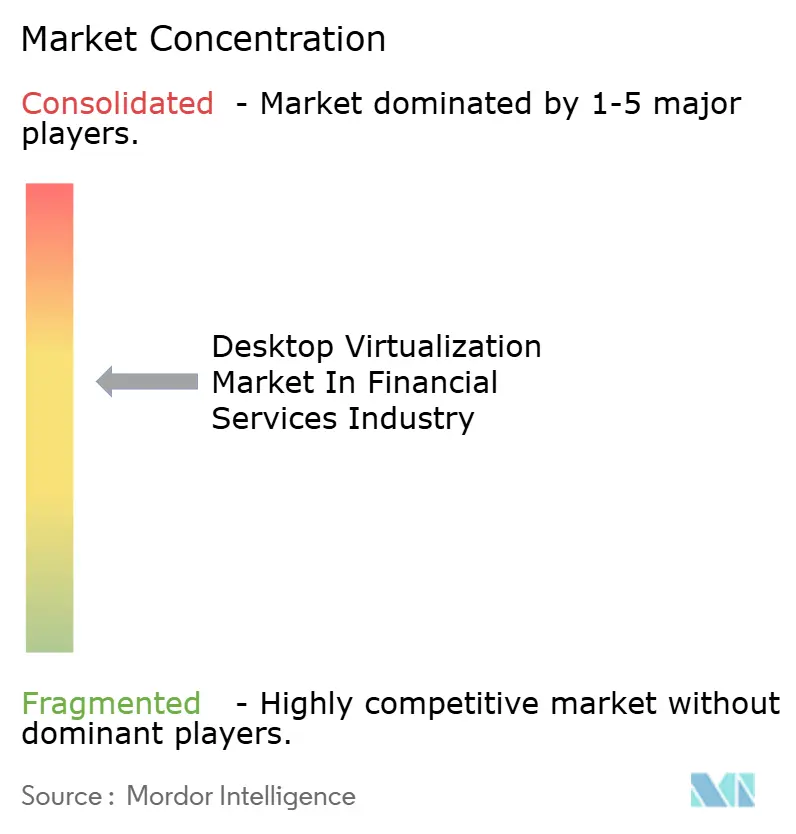
| Market Concentration | Medium |
Major Players *Disclaimer: Major Players sorted in no particular order Image © Mordor Intelligence. Reuse requires attribution under CC BY 4.0. | |
Analysis of Desktop Virtualization Market In Financial Services Industry by Mordor Intelligence
The desktop virtualization market in financial services industry size stands at USD 2.88 million in 2025 and is projected to reach USD 5.75 million by 2030, posting a 14.8% CAGR over the forecast period. Demand rises as banks, insurers, and FinTechs converge on secure virtual desktop environments that satisfy zero-trust mandates, GPU-accelerated risk analytics, and stringent data-residency rules. Tier-1 institutions are shifting from capital spending to consumption-based models, prompting vendors to integrate compliance tooling and high-performance graphics into their offerings. The Asia-Pacific outpaces other regions due to rapid financial-sector digitization and supportive cloud guidelines, while North America remains the largest adopter, owing to its mature trading and regulatory infrastructures. Vendor competition centers on balancing ultra-low-latency trader desktops with operational efficiency gains from cloud orchestration.
Key Report Takeaways
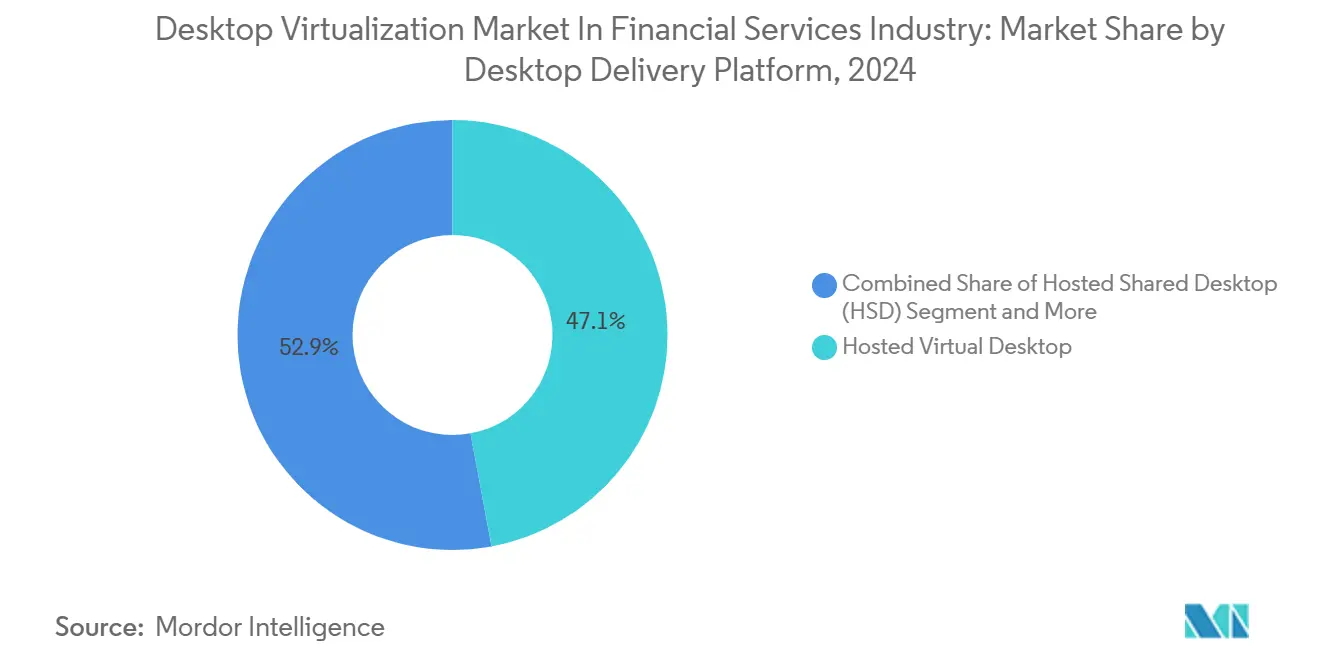
- By desktop delivery platform, Hosted Virtual Desktop led with 47.1% revenue share in 2024, whereas Desktop-as-a-Service is forecast to expand at a 17.8% CAGR to 2030.
- By deployment mode, on-premises captured 58.4% of the desktop virtualization market in financial services industry share in 2024, while cloud deployments are projected to grow at a 16.2% CAGR through 2030.
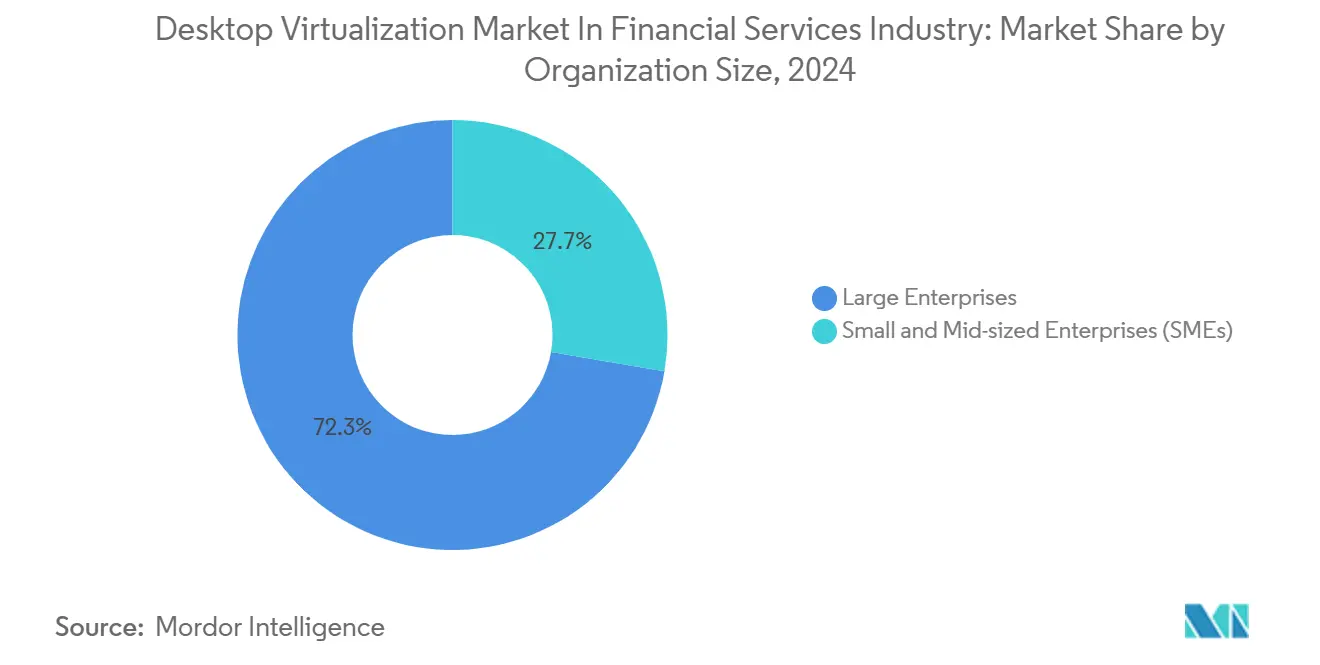
- By organization size, large enterprises accounted for 72.3% of the desktop virtualization market in financial services industry in 2024, and SMEs are advancing at a 14.9% CAGR over the same horizon.
- By end-user, retail and commercial banking commanded 62.4% share of the desktop virtualization market in financial services industry in 2024; FinTech and payment providers record the highest projected CAGR at 15.4% to 2030.
- By geography, North America commanced 41.2% share of the desktop virtualization market in financial services industry size in 2024; Asia-Pacific record highest projected CAGR at 12.70% to 2030.
Note: Market size and forecast figures in this report are generated using Mordor Intelligence’s proprietary estimation framework, updated with the latest available data and insights as of January 2026.
Insights and Trends of Desktop Virtualization Market In Financial Services Industry
Drivers Impact Analysis*
| Driver | (~) % Impact on CAGR Forecast | Geographic Relevance | Impact Timeline |
|---|---|---|---|
| Widespread cloud-migration strategies | +2.5% | Global, led by North America and European Union | Medium term (2-4 years) |
| Accelerated move to zero-trust frameworks | +1.8% | Global, especially North America and Asia-Pacific | Short term (≤ 2 years) |
| Hybrid-work mandates for trading floors | +1.2% | North America and European Union | Short term (≤ 2 years) |
| ESG-driven demand for energy-efficient thin clients | +1.5% | European Union leading; spreading to Asia-Pacific and North America | Long term (≥ 4 years) |
| Growing GPU-enabled risk-analytics workloads | +1.3% | Global, concentrated in major financial centers | Medium term (2-4 years) |
| AI-PC endpoints enabling local inference | +0.9% | North America and Asia-Pacific early adoption | Long term (≥ 4 years) |
| Source: Mordor Intelligence | |||
Widespread Cloud-Migration Strategies Among Tier-1 Banks
Large banks are refactoring their desktop estates around hybrid-cloud blueprints to improve resilience and reduce ownership costs. Sensitive trading platforms remain on-premises, while back-office desktops transition to cloud subscription models, enabling dynamic provisioning for contractors, test teams, and disaster recovery drills.[1]Workspot, “Modern VDI for Financial Services,” WORKSPOT.COM Procurement, therefore, pivots from hardware refresh cycles to operating-expense contracts aligned with business outcomes. The shift accelerates standardization on cloud-native security controls and drives embedded audit-trail functionality across virtual sessions. Vendors capable of bridging legacy data centers with multi-cloud orchestration capture heightened demand as institutions roll out phased migrations over 24-36 months.
Accelerated Move to Zero-Trust Security Frameworks
Financial firms now insist that every virtual desktop connection authenticates continuously, integrating MFA, behavioral analytics, and session-based risk scoring. Traders log in with biometrics and location controls that restrict data access when anomalies arise, while compliance teams audit keystroke-level histories in real-time. These capabilities elevate VDI selection criteria beyond performance to encompass native zero-trust alignment. Consequently, specialist integrators with combined cybersecurity and virtualization expertise command premium consulting rates, and platform roadmaps increasingly embed API hooks for threat-intelligence feeds.
Hybrid-Work Mandates for Capital-Market Trading Floors
Broker-dealers rearchitect trader workspaces so that latency-sensitive applications remain performant, irrespective of location. GPU-backed VDI instances stream high-resolution, multi-monitor setups to approved home offices, branch sites, or backup facilities, all while maintaining compliance with regulatory safeguards. Desktops replicate on-floor collaboration tools, voice recording, and real-time data feeds, ensuring compliance with market-abuse rules. Low-latency network fabrics and proximity hosting within colocation centers underpin these deployments, widening addressable spend for specialist connectivity and monitoring vendors.
Growing GPU-Enabled Risk-Analytics Workloads
Monte Carlo simulations, stress testing, and real-time portfolio optimizations increasingly invoke GPU acceleration that CPUs alone cannot match. Virtualization layers now expose passthrough or virtual GPU pools, allowing analysts to burst workloads without relying on local workstations, thereby preserving data custody within bank-controlled cores. Hardware utilization climbs as multiple users share high-density GPU clusters, and scheduling algorithms right-size resource allocations to the minute. This capability shortens model run times, providing risk teams with faster insights for capital allocation decisions.
Restraints Impact Analysis*
| Restraint | (~) % Impact on CAGR Forecast | Geographic Relevance | Impact Timeline |
|---|---|---|---|
| Legacy mainframe integration complexity | −1.2% | Global, notably established financial hubs | Long term (≥ 4 years) |
| Skills gap in cloud-native VDI operations | −0.8% | Global, acute in emerging markets | Medium term (2-4 years) |
| Concentrated vendor-dependency risk | −1.1% | Global; regulators focus on European Union and Asia-Pacific | Short term (≤ 2 years) |
| Regulatory data-residency cost inflation | −0.7% | European Union, Asia-Pacific with growing global reach | Long term (≥ 4 years) |
| Source: Mordor Intelligence | |||
Legacy Mainframe Integration Complexity
Many banks still process high-value transactions on decades-old mainframes. Bridging these systems to modern VDI stacks requires custom middleware, doubled authentication paths, and latency workarounds that add 6-12 months to rollouts and raise budgets by double-digit percentages. Dependence on scarce COBOL specialists and proprietary tooling reduces vendor leverage and slows innovation, hampering time-to-value compared to digital-native peers.
Skills Gap in Cloud-Native VDI Operations
Running zero-trust, GPU-enhanced, multi-cloud desktop estates requires cross-disciplinary talent spanning virtualization, cloud ops, cybersecurity, and regulatory fluency. That combination is rare, inflating salaries and increasing reliance on managed services. Continuous platform updates further stress internal teams, and enterprises report project delays when certification backlogs emerge.
*Our forecasts treat driver/restraint impacts as directional, not additive. The impact forecasts reflect baseline growth, mix effects, and variable interactions.
Segment Analysis
By Desktop Delivery Platform: DaaS Momentum Challenges Traditional Models
Hosted Virtual Desktop retained a 47.1% revenue share in 2024, yet Desktop-as-a-Service posted a 17.8% CAGR that steadily eroded incumbent dominance. DaaS gains ground because fee-for-use pricing aligns with volatile head-count swings common in advisory, trading, and compliance units. Service providers bundle regulatory logging and GPU options, allowing mid-tier banks to access enterprise-grade stacks without incurring capital expenditure spikes. Hosted Shared Desktop products cater to niche environments with standardized applications, while Remote Desktop Services support legacy Windows workloads in branch offices.
The desktop virtualization market in financial services industry benefits as DaaS vendors pre-integrate zero-trust and disaster-recovery playbooks, shortening deployment from months to weeks. Multi-tenant control planes automate patching and vulnerability scans, easing audit pressures. In contrast, on-premises HVD estates still appeal to institutions whose policies prohibit off-site data, but they face refresh cycles that increase total cost. Forward-looking buyers therefore favor hybrid procurement, sinking core trading desktops into private clouds while diverting clerical users to public DaaS.


By Deployment Mode: Cloud Acceleration Redraws Control Preferences
On-premises estates held a 58.4% desktop virtualization market in financial services industry in 2024, but cloud instances are expected to compound at 16.2% through 2030. Banks reconcile sovereignty concerns by ring-fencing sensitive data sets locally, then offloading seasonal or low-risk workloads to hyperscalers. Hybrid orchestration platforms schedule desktops based on latency, compliance tags, and cost.
Cloud acceleration intensifies as regulators publish clearer guidance on encryption, key management, and audit access, lowering perceived risk. Insurers run claims adjudication in cloud regions close to customers for a better experience, while core actuarial models remain in private zones. Vendors that deliver uniform policy enforcement across AWS, Azure, and GCP win share as institutions resist platform lock-in.
By Organization Size: SMEs Capture Democratized Capability
Large enterprises contributed 72.3% of 2024 revenue as their complex estates demanded bespoke engineering. Yet SMEs log a 14.9% CAGR, adding new addressable volume for SaaS-delivered desktop platforms. Pay-per-user tiers, wizard-driven compliance templates, and bundled support make sophisticated VDI viable for community banks and regional insurers.
SMEs view virtualization as a gateway to digital workforce strategies, enabling remote advisors and 24/7 customer care without the need for heavy infrastructure. Cloud DaaS offerings pre-configure PCI-DSS and SOC 2 controls, thereby neutralizing historical compliance barriers. This expansion diversifies revenue away from flagship Wall Street accounts and encourages vendors to launch simplified onboarding flows and localized billing.
By End-User: FinTech Outpaces Core Banking Demand
Retail and commercial banking generated 62.4% of the 2024 spend, reflecting the vast number of branch and back-office seats that benefit from centralized desktop control. FinTech and payment companies surge at 15.4% CAGR as venture-funded disruptors scale customer bases and must embed bank-grade security from day one.[2]Onesafe, “AI Agents: Transforming Fintech in 2025,” ONESAFE.IO Capital-markets desks adopt specialized GPU desktops for low-latency analytics, while insurers virtualize adjuster workstations to accelerate claims intake.
FinTech priorities center on API-centric, cloud-native architectures, making DaaS the default route for onboarding engineers and compliance analysts. Conversely, traditional banks continue phased migrations, sequencing teller applications, loan origination, and wealth-management desks over multi-year roadmaps. Vendors, therefore, tailor reference architectures to each vertical’s latency, data retention, and auditing profiles.
Geography Analysis
North America led with 41.2% market share in 2024, powered by early zero-trust adoption, dense trading hubs, and large-scale GPU virtualization pilots in New York, Chicago, and Toronto. Institutions invest heavily in resilience, building active-active desktop pairs across metropolitan zones to meet federal guidelines on business continuity. Sub-second failover and encryption-in-transit are baseline specifications, and spending shifts toward monitoring and automated remediation to guard against ransomware.
The Asia-Pacific region is expected to record the fastest 12.7% CAGR, as regulators in Singapore, Australia, and Japan clarify cloud usage rules, encouraging banks to modernize their branch technology and launch mobile-first services.[3]CMC Global, “Cloud Trends of Australia FSI Sector for 2030,” CMCGLOBAL.COM.VN Financial groups deploy hybrid desktop grids that blend local data-center pods with regional hyperscaler capacity, allowing for rapid expansion into adjacent markets. FinTech ecosystems in India and Southeast Asia further fuel demand through green-field builds that leapfrog legacy limitations.
Europe experiences steady replacement cycles driven by GDPR compliance and energy-efficiency mandates. Banks in Frankfurt and Paris emphasize thin-client rollouts tied to ESG targets, swapping aging PCs for low-wattage endpoints that integrate with centralized virtual desktops. Stringent data-sovereignty statutes spur investments in country-specific cloud regions and encryption key escrow. Middle East and Africa show nascent but accelerating uptake in Dubai and Johannesburg, where financial free zones incentivize digital-first banking licenses. South America advances selectively, with Brazilian and Chilean lenders piloting cloud desktops for contact-centre agents while core applications stay on-premises.

Competitive Landscape
The desktop virtualization market in financial services industry exhibits moderate concentration. Citrix, Microsoft, and VMware collectively held a 56% revenue share in 2024, leveraging their deep channel ties and broad product suites. Workspot, Omnissa, and Nutanix target white-space opportunities with cloud-native designs, per-user billing, and embedded compliance workflows that resonate with mid-tier institutions.
Strategic differentiation revolves around three vectors. First, native zero-trust engines that ingest identity signals and dynamically isolate risky sessions. Second, GPU orchestration allocates fractional or dedicated cards to meet the needs of bursty analytics and trader graphics. Third, multi-cloud control planes that abstract policy enforcement across on-premises and hyperscale footprints. Vendors investing in AI-assisted session troubleshooting and self-healing score visibility gains with operations teams.
M&A and spin-offs reshape the field. Omnissa’s carve-out enables a focus on regulated sectors, while Broadcom’s VMware acquisition triggers licensing shifts, prompting some banks to evaluate alternative options. Alliances with NVIDIA, AMD, and Intel proliferate as providers bundle AI-ready silicon. Meanwhile, service integrators such as Cognizant and Accenture expand managed desktop offerings to close expertise gaps inside client banks.
Leaders of Desktop Virtualization Market In Financial Services Industry
Citrix Systems, Inc.
IBM Corporation
Microsoft Corporation
Huawei Technologies Co. Ltd
Hewlett Packard Enterprise Development LP
- *Disclaimer: Major Players sorted in no particular order

Recent Industry Developments
- July 2025: Goldman Sachs rolled out firmwide AI assistant to 10,000 employees, scaling backend GPU-powered VDI clusters for real-time document summarization.
- June 2025: BlackRock introduced “Asimov,” a virtual analyst that scans filings and communications, relying on secure desktop virtualization for data processing.
- May 2025: Nutanix released Enterprise AI with NVIDIA AI Enterprise integration, enabling agentic-AI desktops across edge and cloud estates.
- March 2025: Omnissa launched a three-tier partner program aimed at financial services, promising streamlined deployment and support.


Scope of Report on Desktop Virtualization Market In Financial Services Industry
The Desktop Virtualization Market In Financial Services Industry Report is Segmented by Desktop Delivery Platform (Hosted Virtual Desktop (HVD), Hosted Shared Desktop (HSD), Desktop-as-a-Service (DaaS), and Remote Desktop Services (RDS)), Deployment Mode (On-Premise, Cloud, and Hybrid), Organization Size (Large Enterprises, and Small and Mid-Sized Enterprises (SMEs)), End-User (Retail and Commercial Banking, Capital Markets and Trading, Insurance, and FinTech and Payment Providers), and Geography (North America, Europe, Asia Pacific, South America, and Middle East and Africa). The Market Forecasts are Provided in Terms of Value (USD).
| Hosted Virtual Desktop (HVD) |
| Hosted Shared Desktop (HSD) |
| Desktop-as-a-Service (DaaS) |
| Remote Desktop Services (RDS) |
| On-Premises |
| Cloud |
| Hybrid |
| Large Enterprises |
| Small and Mid-sized Enterprises (SMEs) |
| Retail and Commercial Banking |
| Capital Markets and Trading |
| Insurance |
| FinTech and Payment Providers |
| North America | United States | |
| Canada | ||
| Mexico | ||
| South America | Brazil | |
| Argentina | ||
| Rest of South America | ||
| Europe | Germany | |
| United Kingdom | ||
| France | ||
| Italy | ||
| Spain | ||
| Russia | ||
| Rest of Europe | ||
| Asia-Pacific | China | |
| Japan | ||
| India | ||
| South Korea | ||
| Rest of Asia-Pacific | ||
| Middle East and Africa | Middle East | Saudi Arabia |
| United Arab Emirates | ||
| Turkey | ||
| Rest of Middle East | ||
| Africa | South Africa | |
| Nigeria | ||
| Egypt | ||
| Rest of Africa | ||
| By Desktop Delivery Platform | Hosted Virtual Desktop (HVD) | ||
| Hosted Shared Desktop (HSD) | |||
| Desktop-as-a-Service (DaaS) | |||
| Remote Desktop Services (RDS) | |||
| By Deployment Mode | On-Premises | ||
| Cloud | |||
| Hybrid | |||
| By Organization Size | Large Enterprises | ||
| Small and Mid-sized Enterprises (SMEs) | |||
| By End-User | Retail and Commercial Banking | ||
| Capital Markets and Trading | |||
| Insurance | |||
| FinTech and Payment Providers | |||
| By Geography | North America | United States | |
| Canada | |||
| Mexico | |||
| South America | Brazil | ||
| Argentina | |||
| Rest of South America | |||
| Europe | Germany | ||
| United Kingdom | |||
| France | |||
| Italy | |||
| Spain | |||
| Russia | |||
| Rest of Europe | |||
| Asia-Pacific | China | ||
| Japan | |||
| India | |||
| South Korea | |||
| Rest of Asia-Pacific | |||
| Middle East and Africa | Middle East | Saudi Arabia | |
| United Arab Emirates | |||
| Turkey | |||
| Rest of Middle East | |||
| Africa | South Africa | ||
| Nigeria | |||
| Egypt | |||
| Rest of Africa | |||


Key Questions Answered in the Report
What is driving the rapid growth of the desktop virtualization market in financial services industry?
Rising zero-trust mandates, hybrid-work models, and GPU-powered analytics workloads collectively lift demand, resulting in a 14.8% CAGR forecast to 2030.
How large will the desktop virtualization market in financial services industry size be by 2030?
It is projected to reach USD 5.75 million by 2030 under current adoption trajectories.
Which region is expanding fastest in this market?
Asia-Pacific leads with a 12.7% CAGR as regulators clarify cloud usage and institutions modernize infrastructure.
Why are SMEs adopting desktop virtualization more quickly than in the past?
Cloud-based Desktop-as-a-Service packages bundle compliance and security, making enterprise-grade capabilities affordable and easy to deploy for smaller banks and insurers.
Page last updated on:


