Market Overview
| Study Period | 2020 - 2031 |
|---|---|
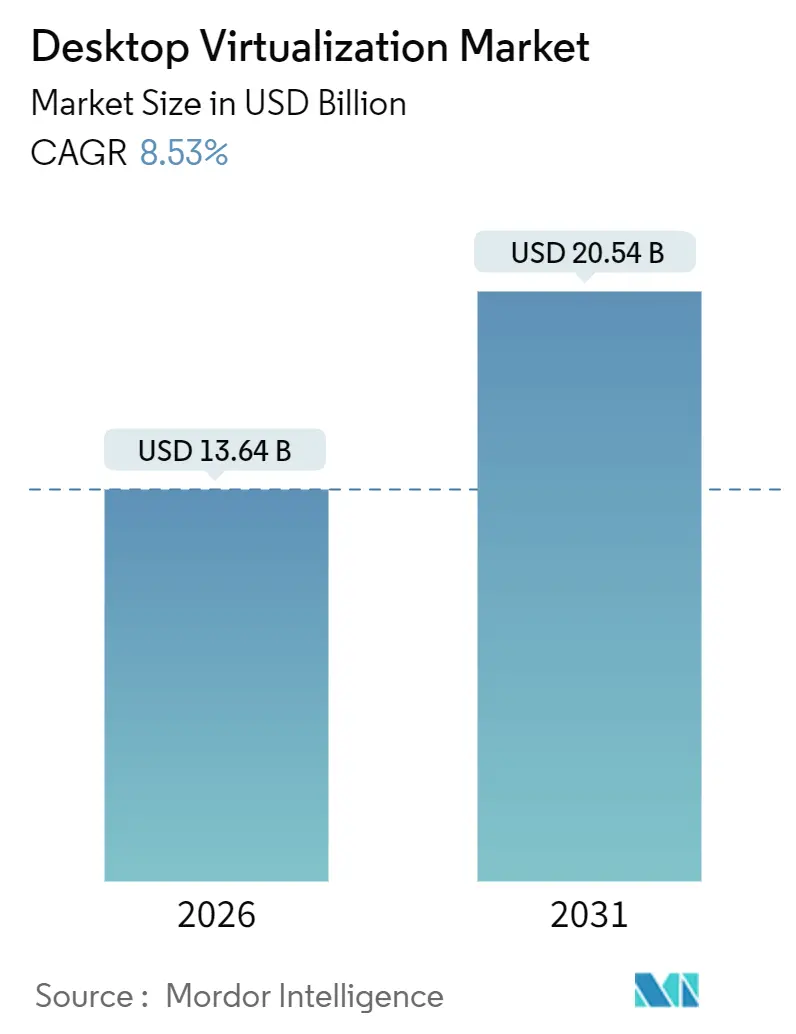
| Market Size (2026) | USD 13.64 Billion |
| Market Size (2031) | USD 20.54 Billion |
| Growth Rate (2026 - 2031) | 8.53% CAGR |
| Fastest Growing Market | Asia Pacific |
| Largest Market | North America |
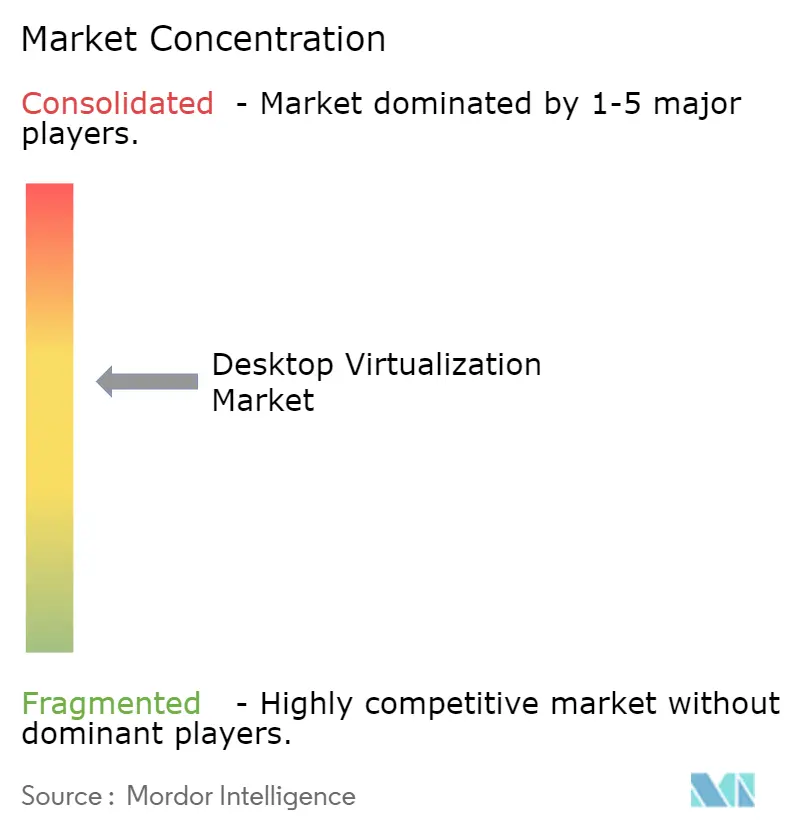
| Market Concentration | Medium |
Major Players *Disclaimer: Major Players sorted in no particular order Image © Mordor Intelligence. Reuse requires attribution under CC BY 4.0. | |
Desktop Virtualization Market Analysis by Mordor Intelligence
The Desktop Virtualization Market size is estimated at USD 13.64 billion in 2026, and is expected to reach USD 20.54 billion by 2031, at a CAGR of 8.53% during the forecast period (2026-2031).
The expansion reflects an enterprise pivot toward cloud consumption models, zero-trust security mandates, and the economics of cloud-native infrastructure. Cloud deployment captured 60.44% of 2025 revenue as organizations shifted capital budgets toward Desktop-as-a-Service subscriptions that scale on demand. Hosted Virtual Desktop architectures retained a 45.92% share, but seat growth is moderating as firms prioritize elastic scalability for knowledge workers and GPU-accelerated design teams. North America accounted for 37.21% of global value, yet Asia Pacific is the fastest-growing hub, underpinned by sovereign-cloud mandates in China and India’s Digital India outlay of INR 1.08 trillion (USD 13 billion) through 2026. Healthcare is leading vertical growth at a 9.26% CAGR, as telemedicine workflows require HIPAA-compliant remote access to patient records.
Key Report Takeaways
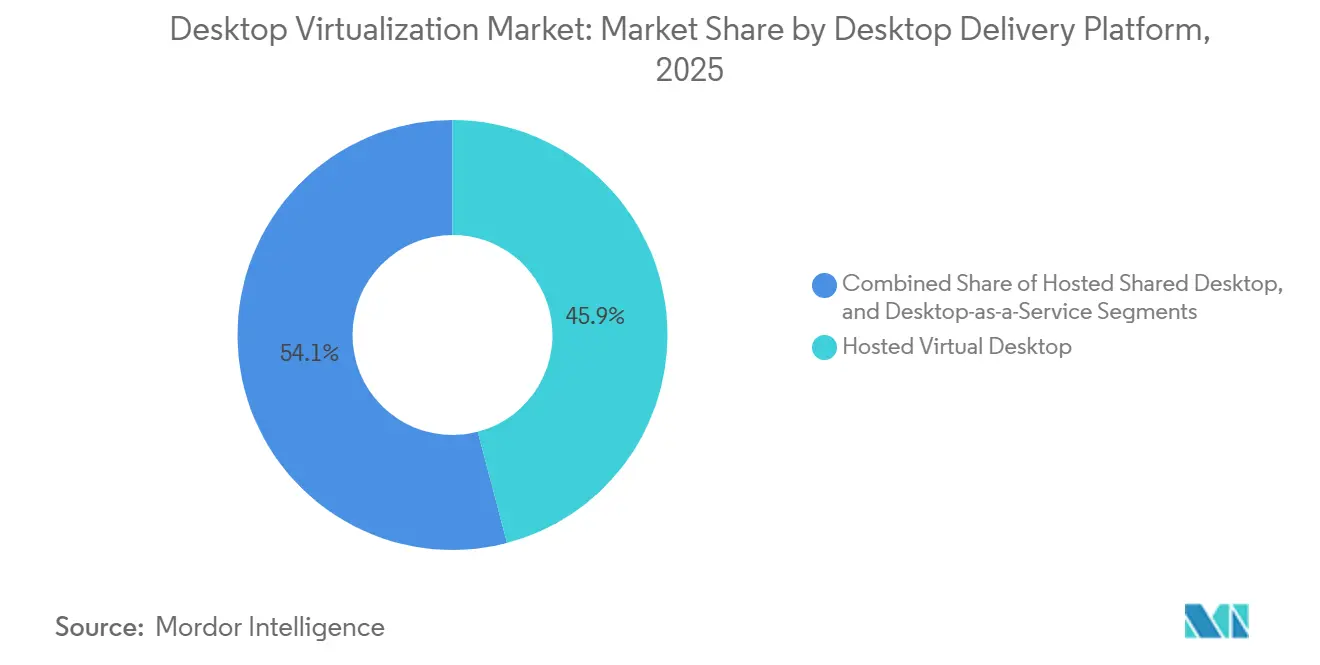
- By desktop delivery platform, Hosted Virtual Desktop held 45.92% of desktop virtualization market share in 2025, while Desktop-as-a-Service is forecast to expand at an 11.52% CAGR to 2031.
- By deployment, the cloud model commanded 60.44% revenue in 2025 and is projected to grow at a 12.61% CAGR through 2031.
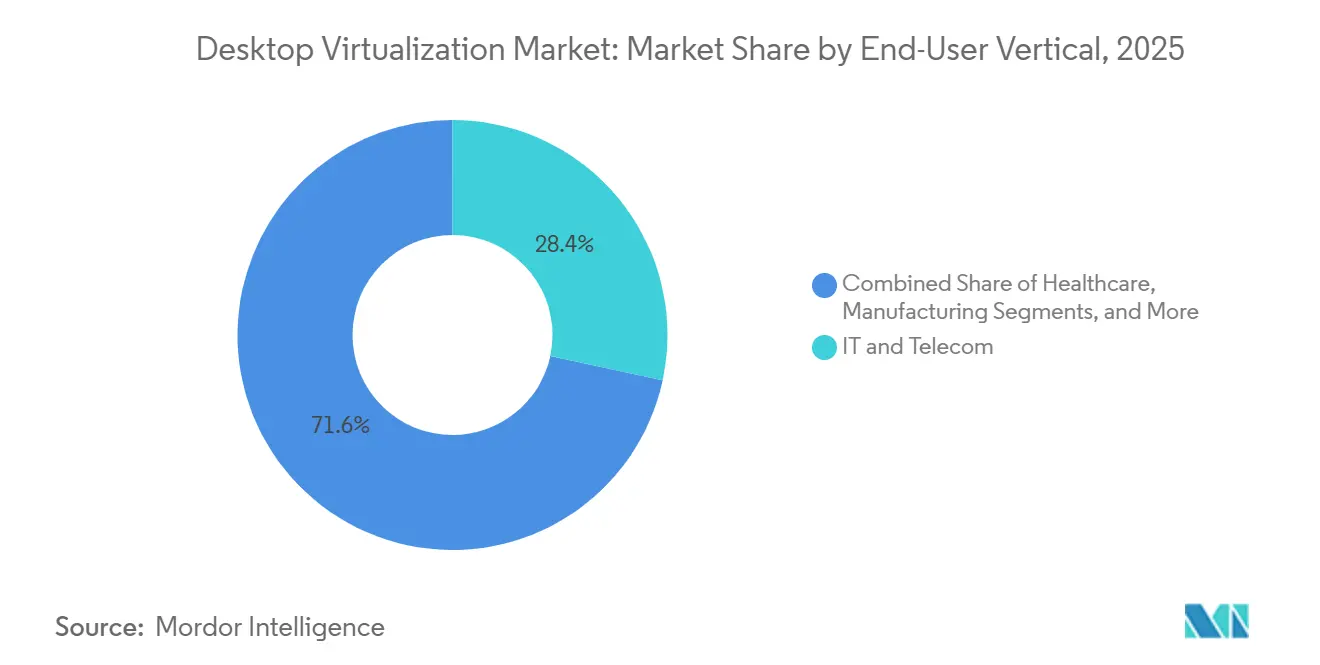
- By end-user vertical, IT and Telecom accounted for 28.37% of desktop virtualization market size in 2025; healthcare is advancing at a 9.26% CAGR through 2031.
- By organization size, large enterprises generated 58.86% of 2025 spending, while SMEs are set to grow at a 9.88% CAGR through 2031.
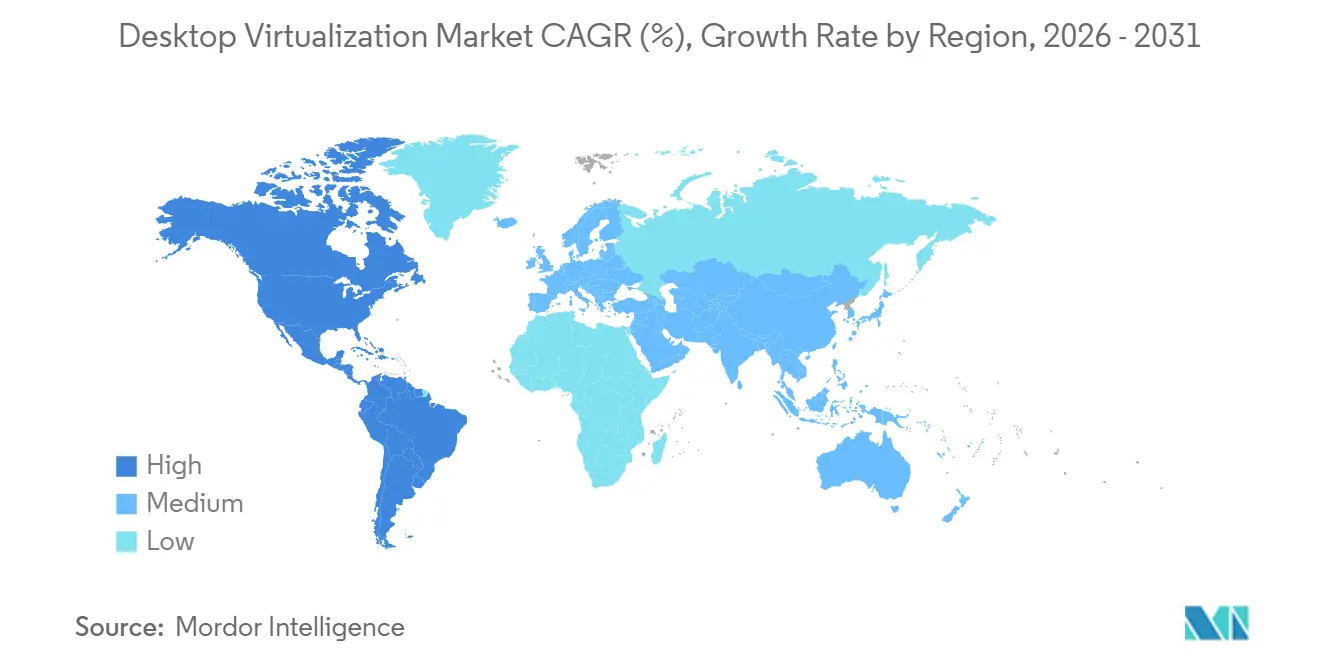
- By geography, North America led with 37.21% revenue in 2025, whereas Asia Pacific is projected to record the fastest 13.26% CAGR to 2031.
Note: Market size and forecast figures in this report are generated using Mordor Intelligence’s proprietary estimation framework, updated with the latest available data and insights as of January 2026.
Global Desktop Virtualization Market Trends and Insights
Drivers Impact Analysis*
| Driver | (~)% Impact on CAGR Forecast | Geographic Relevance | Impact Timeline |
|---|---|---|---|
| Surge in Bring-Your-Own-Device (BYOD) policies | +1.4% | Global, with concentration in North America and Europe | Medium term (2-4 years) |
| Rapid adoption of cloud-hosted desktops and DaaS | +2.1% | Global, led by North America and Asia Pacific | Short term (≤ 2 years) |
| Need for centralized security and compliance | +1.8% | Global, particularly Europe (GDPR) and North America (HIPAA, SOC 2) | Medium term (2-4 years) |
| Cost savings from GPU virtualization for CAD/CAE users | +0.9% | North America, Europe, and Asia Pacific manufacturing hubs | Long term (≥ 4 years) |
| Edge-computing-enabled low-latency VDI roll-outs | +0.7% | Asia Pacific and Middle East, with 5G infrastructure deployment | Long term (≥ 4 years) |
| Data-residency regulations spurring in-country VDI | +1.2% | Europe (GDPR), China (Data Security Law), Middle East | Medium term (2-4 years) |
| Source: Mordor Intelligence | |||
Surge in Bring-Your-Own-Device Policies
Organizations have embedded BYOD programs to reduce hardware outlay and support hybrid work, yet unmanaged endpoints expose corporate assets to malware and data exfiltration. NIST Special Publication 800-46 Rev. 3 urged federal agencies to conduct device-posture checks before launching VDI sessions, a recommendation private-sector chief information security officers adopted to satisfy cyber-insurance requirements.[1]National Institute of Standards and Technology, “Guide to Enterprise Telework, Remote Access, and BYOD Security – SP 800-46 Rev. 3,” nist.gov By streaming only pixel data to personal devices, desktop virtualization creates an air gap between sensitive workloads and consumer operating systems. JPMorgan Chase delivered VDI to 60,000 traders in 2025, enabling algorithmic models to remain within data-center enclaves while employees worked from home networks. As zero-trust frameworks mature, conditional-access policies that verify device health and user identity before session launch are accelerating desktop virtualization market adoption.
Rapid Adoption of Cloud-Hosted Desktops and DaaS
Cloud-native VDI displaces on-premises builds because IT teams no longer forecast peak capacity years ahead, a practice that created stranded hardware or performance bottlenecks. Azure Virtual Desktop and AWS WorkSpaces introduced autoscaling in 2025, spinning up additional compute within 90 seconds once average session density crosses 80%. Enterprises such as Siemens consolidated 200 regional VDI clusters into three Azure regions, eliminating data-center leases and saving EUR 18 million (USD 19.44 million) annually. Multi-cloud deployment is now a hedge against vendor lock-in, with one-third of enterprises running desktops across two or more hyperscalers to meet data-sovereignty rules.
Need for Centralized Security and Compliance
Regulators emphasize data sovereignty and audit trails, prompting organizations to centralize application delivery through VDI. CISA’s Zero Trust Maturity Model positions VDI as a core control for Level 3 compliance because it enforces least-privilege isolation and curtails lateral movement. HIPAA’s technical safeguards require immutable access logs, which VDI records at the hypervisor layer without relying on possibly disabled endpoint agents. Financial institutions use VDI to segregate trading systems from human-resources networks, blocking privilege escalation between domains. GDPR Article 32 on encryption is easier to meet when data never leaves ISO 27001-certified facilities.
Cost Savings from GPU Virtualization for CAD/CAE Users
Engineering workloads once required dedicated USD 3,000-8,000 workstations, but pooled vGPU resources now serve intermittent graphics needs. NVIDIA vGPU 17.0 introduced time-sliced scheduling so a single A100 GPU can host 16 concurrent AutoCAD users with 60-plus fps performance.[2]NVIDIA Corporation, “NVIDIA Virtual GPU Software Documentation – Release 17.0,” nvidia.com Automotive leaders such as BMW migrated 1,200 CAD engineers to GPU-backed VDI and trimmed hardware refresh budgets by EUR 4.2 million (USD 4.54 million). Fractional GPU instances from hyperscalers, including AWS EC2 G6, rent one-eighth of an NVIDIA L4 at USD 0.52 per hour, reinforcing the desktop virtualization market shift toward consumption pricing.
Restraint Impact Analysis*
| Restraint | (~)% Impact on CAGR Forecast | Geographic Relevance | Impact Timeline |
|---|---|---|---|
| High upfront cost of on-premises VDI infrastructure | -1.3% | Global, particularly impacting SMEs and emerging markets | Short term (≤ 2 years) |
| Network latency and bandwidth constraints | -1.1% | Asia Pacific, Africa, South America (limited broadband penetration) | Medium term (2-4 years) |
| Complex multi-session OS licensing models | -0.6% | Global, with acute impact in regulated industries | Medium term (2-4 years) |
| Limited GPU passthrough on ARM-based endpoints | -0.4% | Global, affecting organizations transitioning to ARM processors | Long term (≥ 4 years) |
| Source: Mordor Intelligence | |||
High Upfront Cost of On-Premises VDI Infrastructure
Building an in-house VDI stack demands hypervisor licenses, shared storage arrays, and GPU-ready servers that can exceed USD 2,500 per user before networking upgrades. Enterprises must provision N+1 redundancy to preserve service during hardware failures, effectively doubling server spend. Hyper-converged alternatives reduce complexity yet still require capital that smaller firms struggle to amortize over refresh cycles. Consequently, many SMEs favor Desktop-as-a-Service subscriptions that bundle infrastructure, patching, and support into monthly fees, shifting the cost curve and drawing spend away from on-premises equipment.
Network Latency and Bandwidth Constraints
Remote-display protocols need modest bandwidth for text tasks but spike to 10-25 Mbps for 3D rendering. An ITU study showed that 42% of rural Asia-Pacific enterprises and 58% of sub-Saharan Africa businesses lacked 25 Mbps broadband in 2025. Latencies above 100 ms degrade mouse responsiveness and shrink user-satisfaction scores. Edge caches placed closer to end users mitigate delay but reintroduce hardware and operating burdens. 5G fixed-wireless promises sub-30 ms round-trip, though coverage outside tier-one cities remains limited through 2026, slowing desktop virtualization market expansion in underserved geographies.
*Our forecasts treat driver/restraint impacts as directional, not additive. The impact forecasts reflect baseline growth, mix effects, and variable interactions.
Segment Analysis
By Desktop Delivery Platform: DaaS Disrupts Traditional Hosting Models
Hosted Virtual Desktop retained 45.92% of 2025 market revenue, yet the desktop virtualization market size for Desktop-as-a-Service is projected to grow at an annual rate of 11.52% to 2031. Cloud-provisioned desktops eliminate the need for hypervisor management while enabling administrators to enforce identical security baselines on every session. Microsoft integrated Azure Virtual Desktop with Intune in 2025, allowing policy inheritance between physical and virtual endpoints. Seasonal sectors, such as retail, scale seat counts by 300% during holidays, a use case that hosted shared servers cannot match. At the same time, low-latency demands in equities trading still justify the use of private VDI clusters located near exchange engines. Citrix reported 68% of on-premises customers operated in regulated niches, illustrating that hybrid coexistence will persist well into the forecast horizon. Emerging container delivery models, notably VMware Horizon Cloud Next-Gen, blur boundaries further by streaming Docker-packed Windows apps through HTML5 browsers.
Hosted Shared Desktop finds niche growth in academic labs and call centers where standardized workloads prevail. Desktop-as-a-Service (DaaS) removes administrator restrictions that plagued shared servers, allowing contractors to install project-specific plugins without jeopardizing neighboring sessions. GPU-fractionalization now lets cloud-hosted desktops serve designers with 4 GB slices reserved only during rendering, shrinking idle overspend. Vendors market vertical bundles, such as financial DaaS packages that embed Bloomberg terminals and audit logging, commanding 20% premiums over generic seats. Consequently, the desktop virtualization market continues to diversify delivery formats rather than converging on a single architecture.


By Deployment: Cloud Dominance Reshapes Infrastructure Economics
Cloud held 60.44% of market value in 2025, and its desktop virtualization market share will deepen as hyperscalers achieve 70-80% CPU utilization. Ten-minute workstation provisioning is eclipsing the three-day lead time for on-premises builds. AWS launched a USD 195 WorkSpaces Thin Client in 2025 that boots directly into a cloud session and removes Windows license costs on edge devices.[3]Amazon Web Services, “What’s New with AWS – WorkSpaces Announcements,” amazon.com Data gravity keeps seismic modeling and genomic workloads on-premises, but even these sectors experiment with hybrid setups that reserve cloud desktops for contractors. Hyper-converged appliances reduce operational drag by bundling compute, storage, and networking into scale-out nodes, trimming five-year ownership costs by 28% compared with traditional SANs.
Europe’s GDPR localization clause steers many enterprises toward private clouds hosted inside regional borders, sustaining on-premises investment despite global migration patterns. Nutanix AHV 7.0 added dynamic GPU assignment, consolidating workloads and postponing hardware refreshes. For edge factories requiring sub-10 ms round-trip to shop-floor robots, local nodes remain indispensable. However, AWS, Azure, and Google Cloud are deploying metro-edge zones that bring core services within city limits, undermining latency arguments for private clusters. Over the forecast horizon, most organizations will run persistent desktops on-premises for executives while bursting cloud seats for contingent staff, illustrating a pragmatic rather than ideological deployment split.
By End-User Vertical: Healthcare Accelerates Adoption for Telemedicine Workflows
Healthcare recorded the highest 9.26% CAGR as clinicians accessed imaging and electronic health records from remote clinics without downloading protected data. HIPAA technical safeguards favor server-side rendering and encrypted pixel streams, enabling hospitals to meet audit requirements while letting doctors consult from home or temporary triage centers. IT and Telecom dominated absolute spending at 28.37% in 2025, leveraging mature cloud skills to integrate virtual desktops with DevSecOps pipelines and continuous compliance scanners. Financial firms adopted desktop virtualization to isolate trading algorithms; Goldman Sachs deployed 15,000 cloud desktops in 2024 to accommodate multi-site quant teams.
Manufacturers employ rugged thin clients on assembly lines where dust and vibration shorten PC lifecycles, pushing workloads into hardened data centers. Retailers scale seasonal hiring by spinning temporary desktops rather than imaging tens of thousands of laptops. Education segments deliver MATLAB, CAD, and design suites over HTML5, erasing physical lab bottlenecks and cutting license pools by 30% through concurrent use. Government agencies meet FedRAMP controls while supporting telework for civil servants, with 180,000 U.S. federal employees already migrated to virtual desktops. The desktop virtualization market size tied to frontline and field workers is therefore expanding beyond knowledge-worker confines.
By Organization Size: SMEs Drive Growth Through Managed Services
Large enterprises generated 58.86% revenue in 2025 thanks to complex line-of-business integrations, yet SMEs will grow 9.88% per year as turnkey managed services lower entry barriers. Packages priced at USD 50-75 per user per month bundle support, endpoint devices, and compliance reporting, undercutting legacy PC refresh cycles by up to 35%. Windows 365’s flat-rate tiers resonated with firms lacking hypervisor skills, accelerating the desktop virtualization market footprint among businesses with fewer than 1,000 staff.
Awareness remains a hurdle; an IDC survey found more than half of small firms were unfamiliar with VDI, indicating substantial white space. Midsize organizations, however, straddle cost sensitivity and sophisticated needs, driving adoption of co-managed models where hyperscalers handle infrastructure while internal IT teams govern applications. Vertical-specific DaaS bundles, such as radiology imaging or financial compliance desktops, further shorten proof-of-concept cycles. Consequently, the desktop virtualization industry expects steady SME penetration that outpaces but does not eclipse large-enterprise spend.
Geography Analysis
North America led 2025 revenue at 37.21% due to early hybrid-work mandates and substantial cloud budgets. Growth is now moderating as deployments shift from greenfield to license renewals and capacity tweaks. Regional vendors differentiate through FedRAMP High and StateRAMP certifications that unlock public-sector contracts.
Asia Pacific is projected to post a 13.26% CAGR, the fastest worldwide. China’s Data Security Law compels in-country data storage, pushing multinationals to deploy local VDI clusters rather than route sessions through foreign regions. India’s Digital India funding is expanding fiber networks and hyperscale data centers, prerequisites for mass rollouts in education and municipal health clinics. Edge nodes from carriers such as China Mobile cut round-trip latency below 20 ms, enabling GPU-intensive editing suites to run in the cloud without perceptible lag.
Europe remains a steady adopter. GDPR localization rules encourage private or sovereign clouds; 62% of enterprises operated VDI inside member-state borders in 2025, according to CISPE.[4]Cloud Infrastructure Services Providers in Europe, “GDPR Compliance in Cloud Services – 2025 Survey Report,” cispe.cloud Middle East governments invest in national-cloud infrastructure, with Saudi Arabia’s Public Investment Fund allocating USD 6.4 billion for data centers to host government desktops. South America and Africa remain nascent because broadband costs and taxation schemes inflate total cost of ownership, but 5G fixed-wireless pilots in Brazil and Kenya signal a potential inflection by 2028. For multinationals, the desktop virtualization market is fragmenting into regional silos governed by data-residency laws rather than a single global deployment footprint.

Competitive Landscape
The desktop virtualization market is moderately concentrated: Microsoft, Citrix, AWS, and Nutanix controlled about 55% of 2025 revenue. Hyperscalers undercut traditional vendors by monetizing compute capacity and layering value-added security or AI features on top. Microsoft added AI-driven host optimization in 2025, reducing per-user infrastructure costs by 18%. AWS implemented session-persistence technology allowing users to pause and resume desktops across devices, trimming reconnection time for road warriors.
Niche players IGEL and Stratodesk gained share with Linux-based endpoints that remove Windows license fees and repurpose aging PCs. Broadcom’s 2023 purchase of VMware and the 2024 Omnissa spin-out signaled a shift toward subscription revenue and cloud-agnostic control planes. Patent filings focus on GPU partitioning, session shadowing for help-desk support, and AI-based anomaly detection. Browser-native competitors such as Chrome Enterprise circumvent hypervisors entirely, streaming Windows apps through the Chrome browser.
Regulatory credentials shape competitive moats. Providers with ISO 27001, GDPR, and HIPAA attestations win contracts in healthcare, finance, and public administration. Vertical bundles fetch 20-30% premiums, prompting vendors to integrate compliance toolkits, industry-specific software, and pre-configured policies. Entering 2026, rivalry centers less on hypervisor choice and more on price-performance for GPU workloads, regulatory coverage, and breadth of ecosystem integrations.
Desktop Virtualization Industry Leaders
Citrix Systems Inc.
Cisco Systems, Inc.
Amazon Web Services, Inc.
Dell Technologies Inc.
Google LLC
- *Disclaimer: Major Players sorted in no particular order

Recent Industry Developments
- November 2025: Microsoft launched Azure Virtual Desktop with NVIDIA L40S GPUs, supporting up to 32 concurrent CAD sessions per GPU and lowering total cost of ownership by 40%.
- September 2025: AWS released WorkSpaces Thin Client Gen 2, a USD 195 ARM-based device that boots directly into cloud desktops and supports dual 4K displays.
- July 2025: Citrix partnered with Tencent Cloud to deliver China-compliant DaaS by keeping sessions within mainland data centers.
- May 2025: Nutanix AHV 7.0 introduced dynamic GPU reallocation, reducing provisioning overhead by 35%.
- March 2025: Dell committed USD 120 million to expand VDI appliance production in Penang, Malaysia, targeting Asia Pacific demand.


Global Desktop Virtualization Market Report Scope
Desktop virtualization is a virtualization technique that separates a personal computing desktop from a physical machine using the client-server computing model. Desktop virtualization involves separating the physical client device from the operating system. The data needed for the desktop is stored on a centralized or remote server, not on the client's device.The increasing deployment of KVM Switch solutions in enterprise IT environments is supporting efficient management of multiple virtual desktop systems and centralized workstation operations. This allows users to access their data from anywhere and at any time.
The Desktop Virtualization Market Report is Segmented by Desktop Delivery Platform (Hosted Virtual Desktop, Hosted Shared Desktop, Desktop-as-a-Service), Deployment (On-Premises, Cloud), End-User Vertical (Financial Services, Healthcare, Retail and E-commerce, Manufacturing, IT and Telecom, Government and Public Sector, Education), Organization Size (SMEs, Large Enterprises), and Geography (North America, South America, Europe, Asia-Pacific, Middle East, Africa). The Market Forecasts are Provided in Terms of Value (USD).
By Desktop Delivery Platform
| Hosted Virtual Desktop (HVD) |
| Hosted Shared Desktop (HSD) |
| Desktop-as-a-Service (DaaS)/Other Forms |
By Deployment
| On-Premises |
| Cloud |
By End-User Vertical
| Financial Services |
| Healthcare |
| Retail and E-commerce |
| Manufacturing |
| IT and Telecom |
| Government and Public Sector |
| Education |
| Other End-Use Verticals |
By Organization Size
| Small and Medium Enterprises (SMEs) |
| Large Enterprises |
By Geography
| North America | United States |
| Canada | |
| Mexico | |
| South America | Brazil |
| Argentina | |
| Rest of South America | |
| Europe | Germany |
| United Kingdom | |
| France | |
| Italy | |
| Spain | |
| Rest of Europe | |
| Asia-Pacific | China |
| Japan | |
| India | |
| South Korea | |
| ASEAN | |
| Rest of Asia-Pacific | |
| Middle East | Saudi Arabia |
| United Arab Emirates | |
| Rest of Middle East | |
| Africa | South Africa |
| Nigeria | |
| Rest of Africa |
| By Desktop Delivery Platform | Hosted Virtual Desktop (HVD) | |
| Hosted Shared Desktop (HSD) | ||
| Desktop-as-a-Service (DaaS)/Other Forms | ||
| By Deployment | On-Premises | |
| Cloud | ||
| By End-User Vertical | Financial Services | |
| Healthcare | ||
| Retail and E-commerce | ||
| Manufacturing | ||
| IT and Telecom | ||
| Government and Public Sector | ||
| Education | ||
| Other End-Use Verticals | ||
| By Organization Size | Small and Medium Enterprises (SMEs) | |
| Large Enterprises | ||
| By Geography | North America | United States |
| Canada | ||
| Mexico | ||
| South America | Brazil | |
| Argentina | ||
| Rest of South America | ||
| Europe | Germany | |
| United Kingdom | ||
| France | ||
| Italy | ||
| Spain | ||
| Rest of Europe | ||
| Asia-Pacific | China | |
| Japan | ||
| India | ||
| South Korea | ||
| ASEAN | ||
| Rest of Asia-Pacific | ||
| Middle East | Saudi Arabia | |
| United Arab Emirates | ||
| Rest of Middle East | ||
| Africa | South Africa | |
| Nigeria | ||
| Rest of Africa | ||


Key Questions Answered in the Report
How large is the desktop virtualization market in 2026 and where is it heading?
The desktop virtualization market size reached USD 13.64 billion in 2026 and is forecast to climb to USD 20.54 billion by 2031 on an 8.53% CAGR.
Which segment is growing fastest within desktop delivery platforms?
The Desktop-as-a-Service segment is projected to expand at 11.52% annually through 2031, surpassing growth in Hosted Virtual Desktop and Hosted Shared Desktop models.
Why is Asia Pacific the fastest-growing region?
Digital-sovereignty mandates such as China’s Data Security Law and India’s Digital India investment are pushing local deployments, driving a 13.26% regional CAGR.
What are the main barriers to desktop virtualization adoption?
High upfront costs for on-premises infrastructure and network latency in regions lacking reliable broadband remain key restraints, shaving 1.3% and 1.1% off CAGR, respectively.
How are SMEs benefiting from desktop virtualization?
Turnkey subscription bundles priced at USD 50-75 per user per month remove hypervisor management burdens, letting SMEs adopt secure virtual desktops while cutting total ownership costs up to 35%.
Which industries are accelerating adoption fastest?
Healthcare leads with a 9.26% CAGR due to telemedicine, while IT and Telecom maintains the largest spending base at 28.37% of 2025 revenue.
Page last updated on:


