Retail Desktop Virtualization Market Size and Share
Market Overview
| Study Period | 2019 - 2030 |
|---|---|
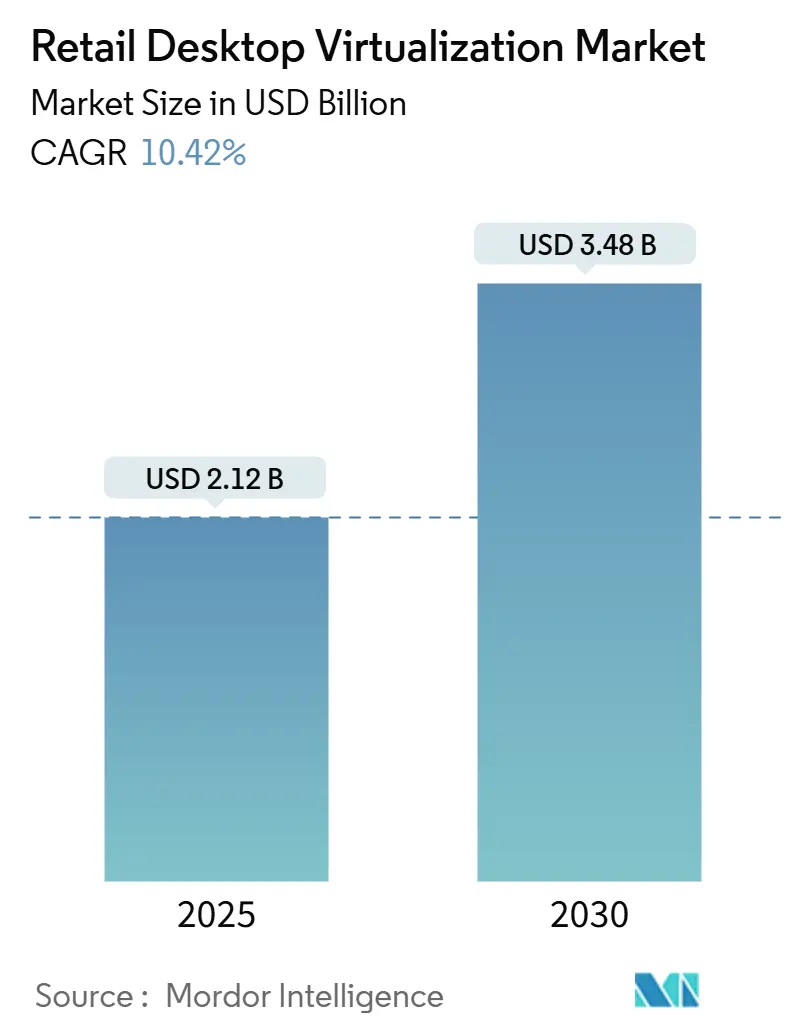
| Market Size (2025) | USD 2.12 Billion |
| Market Size (2030) | USD 3.48 Billion |
| Growth Rate (2025 - 2030) | 10.42% CAGR |
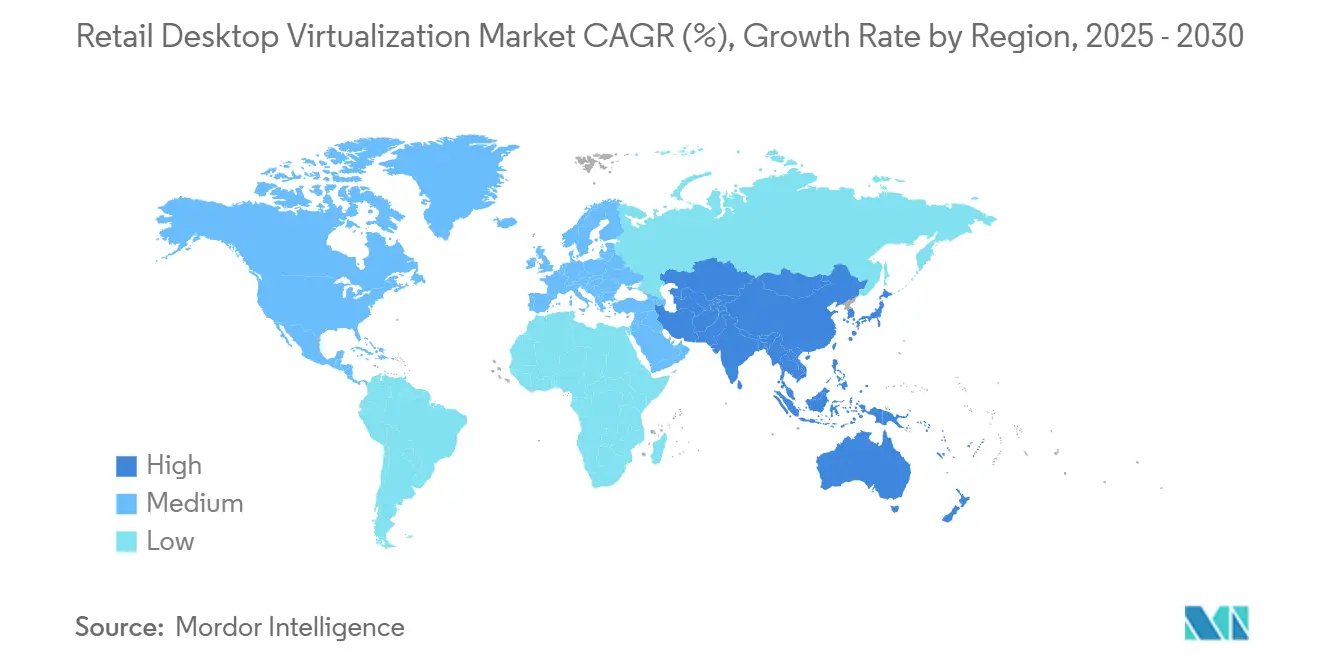
| Fastest Growing Market | Asia Pacific |
| Largest Market | North America |
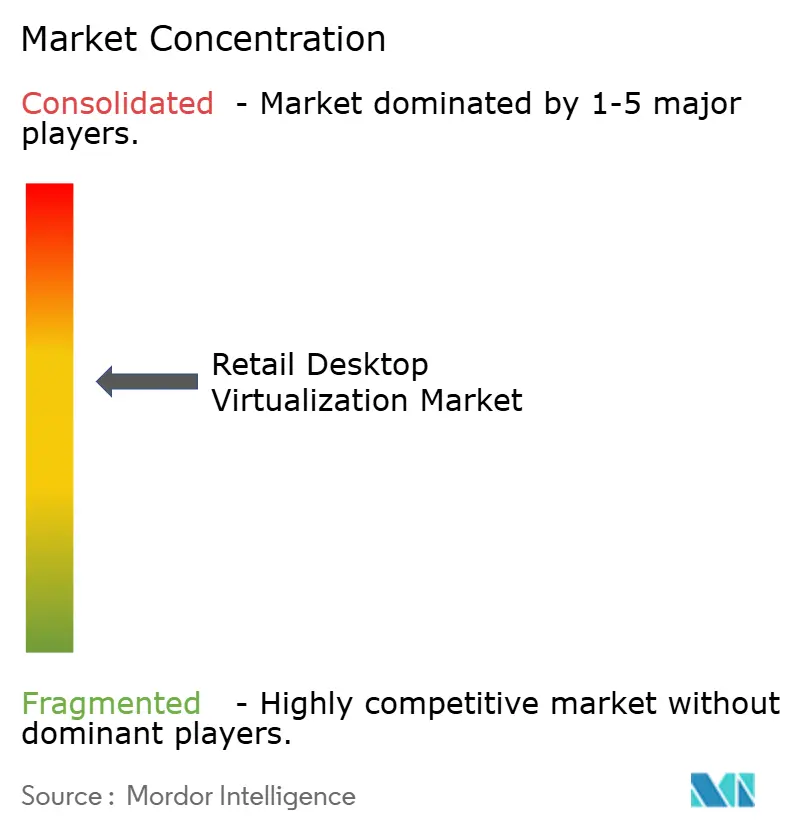
| Market Concentration | Medium |
Major Players *Disclaimer: Major Players sorted in no particular order Image © Mordor Intelligence. Reuse requires attribution under CC BY 4.0. | |
Retail Desktop Virtualization Market Analysis by Mordor Intelligence
The retail desktop virtualization market size is USD 2.12 billion in 2025 and is projected to reach USD 3.48 billion by 2030, registering a 10.42% CAGR during the forecast period. Demand accelerates as retailers replace monolithic on-premise stacks with cloud-native and edge-distributed desktop environments that scale across thousands of stores while centralizing security controls. Broadcom’s overhaul of VMware’s perpetual licenses nudged many chains toward Desktop-as-a-Service (DaaS) subscriptions, creating new whitespace for consumption-based offerings that flex with seasonal headcount. Uptake is strongest among organizations pursuing zero-trust architectures, hybrid work enablement, and rapid store rollouts. Vendors differentiate on price flexibility, ease of management, and integrations with adjacent cloud services, while telecom fiber build-outs remove the last-mile bandwidth bottleneck that once curtailed remote desktop performance.
Key Report Takeaways
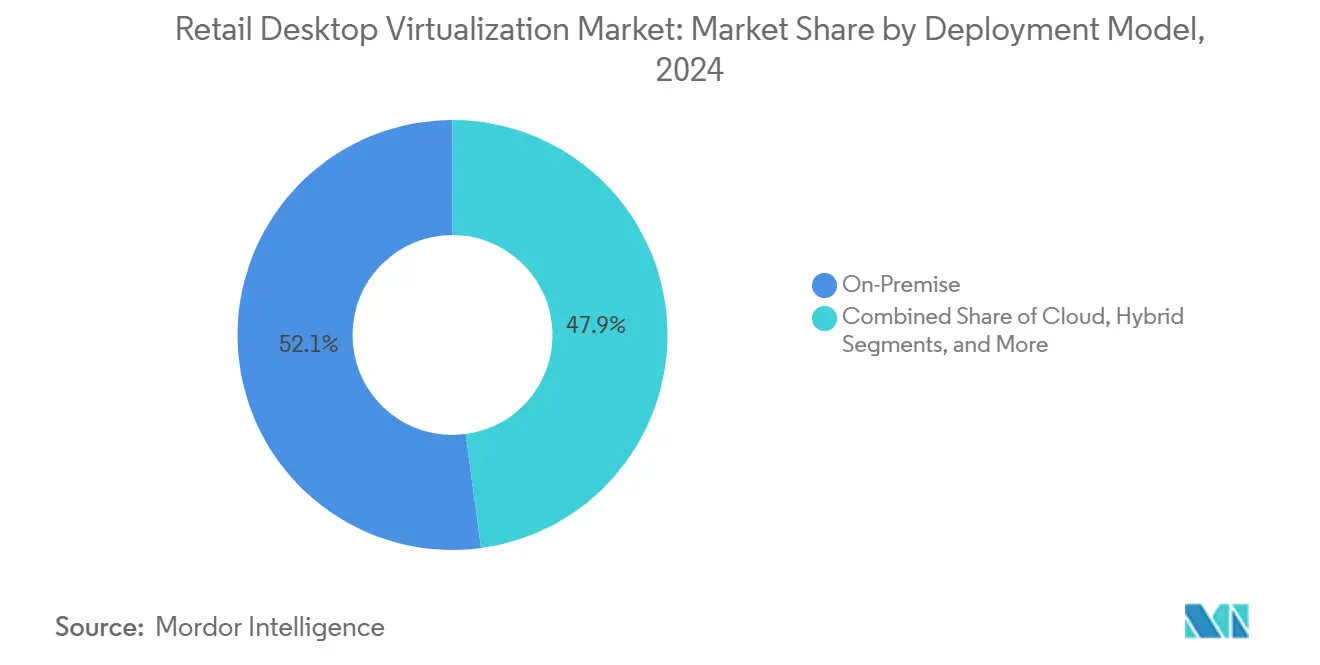
- By deployment model, on-premise configurations held 52.12% of the retail desktop virtualization market share in 2024; edge deployment is projected to advance at a 12.56% CAGR through 2030.
- By 2024, Virtual Desktop Infrastructure led the market with a 41.32% share, whereas Desktop-as-a-Service is forecast to post an 11.53% CAGR through 2030.
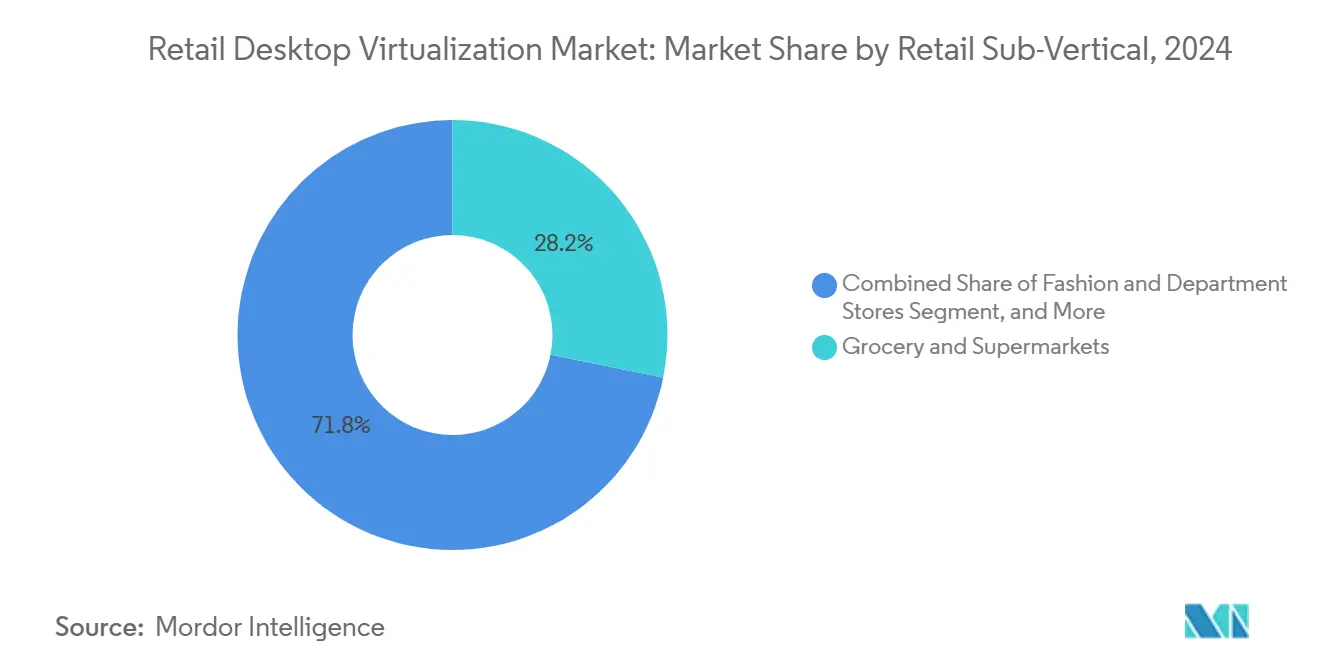
- By retail sub-vertical, grocery and supermarkets accounted for 28.16% of the retail desktop virtualization market size in 2024, while e-commerce fulfillment centers are projected to grow at a 12.23% CAGR through 2030.
- By organization size, large enterprises captured a 63.28% share in 2024; small and medium enterprises are expected to expand at a 12.68% CAGR between 2025 and 2030.
- By geography, North America commanded a 37.48% share in 2024, whereas the Asia Pacific is projected to record an 11.32% CAGR through 2030.
Global Retail Desktop Virtualization Market Trends and Insights
Drivers Impact Analysis*
| Driver | % Impact on CAGR Forecast | Geographic Relevance | Impact Timeline |
|---|---|---|---|
| Accelerating Cloud Migration Across Retail Chains | +1.8% | Global, concentrated in North America and Europe | Medium term (2-4 years) |
| Expansion of Hybrid Work Policies in Retail Corporate Functions | +1.2% | North America, Europe, Asia Pacific urban centers | Short term (≤ 2 years) |
| Rising Need for Centralized Security and Compliance Management | +2.1% | Global, strongest in North America and Europe | Medium term (2-4 years) |
| Proliferation of Zero Trust Security Mandates in Retail | +1.5% | North America, Europe, Asia Pacific financial hubs | Short term (≤ 2 years) |
| Edge-Based VDI Adoption to Support Offline Store Operations | +1.4% | Global, critical where connectivity is intermittent | Long term (≥ 4 years) |
| Vendor Transition Away From Legacy Hypervisor Licensing | +1.9% | Global, most acute in North America and Europe | Short term (≤ 2 years) |
| Source: Mordor Intelligence | |||
Accelerating Cloud Migration Across Retail Chains
Retailers are shifting workloads to hyperscale platforms to synchronize inventory, pricing, and loyalty data across distributed stores without exposing internal APIs to the public internet. AWS reported a 40% year-over-year rise in WorkSpaces seats from retail customers in 2024, led by grocery chains and quick-service restaurants. Microsoft Azure Virtual Desktop mirrored this momentum among fashion retailers needing temporary desktops for seasonal hires. Cloud-hosted desktops eliminate refresh cycles for store PCs and convert capital outlays into variable costs that scale with headcount, while conditional-access policies help merchants comply with PCI-DSS v4.0 requirements.
Expansion of Hybrid Work Policies in Retail Corporate Functions
Merchandising, finance, and marketing teams now expect remote flexibility comparable to technology sectors. Desktop virtualization decouples the user experience from hardware, enabling secure access to corporate applications over consumer broadband. Citrix recorded a 35% jump in DaaS subscriptions by retail customers in 2024, with persistent desktops for power users and pooled instances for call-center staff. Retailers mitigate home-network latency by deploying analytics that identify session bottlenecks and by enforcing SLAs guaranteeing sub-100-ms round-trip times.
Rising Need for Centralized Security and Compliance Management
The attack surface in omnichannel retail has widened to include mobile POS devices and IoT sensors. Virtual desktops centralize patching and disable risky peripherals at scale. The U.S. Cybersecurity and Infrastructure Security Agency recommends zero-trust architectures that verify every request regardless of location.[1]U.S. Cybersecurity and Infrastructure Security Agency, “Zero Trust Maturity Model,” cisa.gov Because data remains in the data center and only pixels traverse the network, retailers can narrow PCI audit scope and revoke compromised accounts in minutes, reducing breach dwell time.
Proliferation of Zero Trust Security Mandates in Retail
Public-sector directives are shaping private-sector procurement. The U.S. Office of Management and Budget requires federal agencies to achieve zero-trust maturity by 2026, prompting retailers that handle pharmacy or government contracts to adopt similar standards. Virtual desktops enforce granular, context-aware policies, for instance, denying payroll access from unmanaged smartphones, aligning with 2024 NIST guidance on continuous verification.
Restraints Impact Analysis*
| Restraint | % Impact on CAGR Forecast | Geographic Relevance | Impact Timeline |
|---|---|---|---|
| Network Bandwidth Limitations in Rural Store Locations | -1.3% | Rural North America, Latin America, Africa | Medium term (2-4 years) |
| High Ongoing Cloud Desktop Subscription Costs | -0.9% | Global, impacting SMEs | Short term (≤ 2 years) |
| Resistance to Change Among Store-Level Staff | -0.6% | Global, culture-specific | Medium term (2-4 years) |
| Talent Shortage in EUC Observability and FinOps Skills | -0.8% | North America and Europe | Long term (≥ 4 years) |
| Source: Mordor Intelligence | |||
Network Bandwidth Limitations in Rural Store Locations
Protocols such as VMware Blast and Citrix HDX need at least 150 kbps per user, yet 19 million U.S. residents still lack 25/3 Mbps broadband per the 2024 FCC report.[2]Federal Communications Commission, “2024 Broadband Progress Report,” fcc.gov Retailers keep legacy PCs in low-bandwidth stores, fragmenting patch cycles. USDA’s ReConnect program committed USD 1.7 billion in 2024 to extend rural fiber, but build-outs run three to five years. Edge-based VDI appliances that cache desktops locally reduce live bandwidth needs to hundreds of kilobits per second, providing a stop-gap.
High Ongoing Cloud Desktop Subscription Costs
While DaaS removes capital expense, workloads that remain powered on 24/7 incur sizable operational charges. FinOps Foundation research found 68% of enterprises lacked dedicated cost-optimization skills in 2024. Over-provisioned pools can inflate bills by 30%-50%. Vendors now embed automated rightsizing recommendations, yet human oversight is still required to balance user experience with cost.
*Our forecasts treat driver/restraint impacts as directional, not additive. The impact forecasts reflect baseline growth, mix effects, and variable interactions.
Segment Analysis
By Deployment Model: Edge Gains Ground as Stores Demand Autonomy
Edge deployment is set to grow at a 12.56% CAGR, the fastest among all models, as retailers require continuous POS operation during WAN outages. A three-node cluster hosting 50 desktops now costs under USD 30,000, down 40% from 2022. Grocery chains running price-lookup and deli-scale apps have been early adopters, while fashion retailers favor cloud models that scale during holiday spikes. Hybrid configurations combine edge for latency-sensitive workloads and cloud for analytics, aligning with data-residency rules in the EU and China.
On-premise VDI still holds 52.12% of retail desktop virtualization market share due to legacy VMware and Citrix estates. However, maintenance renewals and hardware refresh cycles are steering budgets toward operating expenses. Cloud deployment resonates with fulfillment centers that spin up hundreds of temporary desktops each November, avoiding idle hardware the rest of the year. The retail desktop virtualization market will increasingly bifurcate between edge appliances for resilience and cloud pools for elasticity.


By Virtualization Technology: DaaS Disrupts Traditional VDI Economics
Desktop-as-a-Service is forecast to post an 11.53% CAGR, propelled by usage-based billing. AWS WorkSpaces’ USD 25 per user per month plan for 80 hours tackles part-time associate needs.[3]AWS, “AWS WorkSpaces Adoption Trends,” Amazon Web Services, aws.amazon.com Microsoft’s free control plane plus pay-as-you-go compute further reduces entry barriers. Virtual Desktop Infrastructure retains a 41.32% slice of the retail desktop virtualization market size among grocery chains amortizing prior investments. Application streaming, though niche, serves task workers needing one ERP module rather than a full desktop.
Compliance mandates such as PCI-DSS and ISO 27001 are technology-agnostic, provided encryption, MFA, and audit logging are in place. This parity removes a historic advantage VDI enjoyed, accelerating the shift toward fully managed DaaS platforms.
By Retail Sub-Vertical: E-Commerce Fulfillment Centers Accelerate Adoption
Fulfillment centers should expand at a 12.23% CAGR, virtualizing dashboards for order picking and autonomous robots. Amazon added 50 North American warehouses in 2024, each deploying thin clients on forklifts streaming desktops over Wi-Fi 6. Grocery chains, with 28.16% of 2024 revenue, standardize desktops to simplify the rollout of pharmacy and self-checkout systems.
Fashion retailers are migrating to Windows 11 sessions that support touch POS and mobile payments. Specialty stores and quick-service restaurants follow, driven by omnichannel integration and centralized labor scheduling, respectively.
By Organization Size: SMEs Embrace Subscription Models
SMEs are slated to grow at 12.68% CAGR as per-user DaaS bundles include backup and endpoint management. A 20-store regional grocer can now provision 200 desktops for USD 5,000 monthly, sidestepping the USD 100,000 capex once needed for on-premise clusters.
Large enterprises, with 63.28% share, continue to value uniform patching and extended endpoint lifespans, yet migrations of thousands of users stretch over 18-24 months. Tiered pricing from vendors like Citrix USD 20 standard versus USD 35 premium per user lets SMEs match spend to feature needs.
Geography Analysis
North America generated 37.48% of 2024 revenue, leveraging mature broadband and early zero-trust adoption. Growth is slowing as the installed base nears saturation, and retailers renegotiate DaaS contracts to curb spend. The CISA zero-trust roadmap is also influencing private retailers working with government clients. Canada mirrors U.S. trends, while Mexico shows faster expansion as chains modernize for omnichannel fulfillment.
Asia Pacific is the fastest-growing territory, projected at an 11.32% CAGR. India’s GSTN requires real-time tax reporting, pushing merchants toward centrally managed desktops. China’s dual-circulation strategy and Japan’s labor shortages likewise promote virtualization. Australia and South Korea see steady migrations from legacy Citrix to Azure Virtual Desktop, while Southeast Asian markets offer greenfield opportunities for hyperscalers.
Europe experiences moderate uptake constrained by GDPR data-sovereignty rules. Retailers in the United Kingdom and Germany migrate VMware estates to Azure or sovereign clouds to simplify licensing. Spain and Italy lag due to a fragmented store base. South America, the Middle East, and Africa remain small but benefit from government cloud initiatives such as Saudi Vision 2030 that fund cybersecurity upgrades.

Competitive Landscape
The top five vendors, VMware, Citrix, Microsoft, AWS, and Nutanix, control roughly 60% of revenue, indicating moderate concentration. Broadcom’s 2023 acquisition of VMware and shift to subscriptions unsettled long-time customers, enabling Microsoft to bundle Azure Virtual Desktop into enterprise agreements and AWS to position WorkSpaces as a ready extension of existing e-commerce workloads. Nutanix differentiates itself with a hybrid architecture that spans on-premise, edge, and public cloud environments.
White-space opportunities include edge VDI appliances for rural stores, application streaming for task workers, and FinOps automation to trim cloud waste. Niche players IGEL and Parallels specialize in Linux thin-client OS and Mac virtualization, respectively, while Google’s ChromeOS Flex converts legacy PCs into web-managed thin clients, extending hardware life. Compliance credentials, including PCI-DSS, ISO 27001, and NIST alignment, remain critical in procurement scoring.
Retail Desktop Virtualization Industry Leaders
VMware Inc.
Citrix Systems Inc.
Microsoft Corporation
Amazon Web Services Inc.
Nutanix Inc.
- *Disclaimer: Major Players sorted in no particular order

Recent Industry Developments
- January 2025: Microsoft made Azure Virtual Desktop generally available on Azure Stack HCI, enabling retailers to run cloud-managed desktops on local hardware.
- October 2024: Microsoft launched Azure Virtual Desktop on Azure Stack HCI, offering hybrid management via the Azure portal.
- September 2024: AWS introduced WorkSpaces Thin Client, a USD 195 device with dual-monitor support for low-maintenance store endpoints.
- August 2024: Nutanix rolled out Frame on Nutanix Cloud Clusters, extending DaaS to customer-managed public-cloud infrastructure.


Global Retail Desktop Virtualization Market Report Scope
The Retail Desktop Virtualization Market covers technologies and solutions that enable retail businesses to deliver virtual desktops and applications across diverse operational environments. It includes a range of deployment models, including on-premise, cloud, hybrid, and edge, as well as multiple virtualization technologies such as VDI, DaaS, RDS, and application streaming. The market serves various retail sub-verticals, including grocery and fashion, specialty retail, QSR, and e-commerce fulfillment centers, across both large enterprises and SMEs.
The Retail Desktop Virtualization Market Report is Segmented by Deployment Model (On-Premise, Cloud, Hybrid, Edge), Virtualization Technology (VDI, DaaS, RDS, Application Streaming), Retail Sub-Vertical (Grocery and Supermarkets, Fashion and Department Stores, Specialty Retail, QSR, E-Commerce Fulfillment Centers), Organization Size (Large Enterprises, SMEs), and Geography (North America, South America, Europe, Asia Pacific, Middle East and Africa). Market Forecasts are Provided in Terms of Value (USD).
| On-Premise |
| Cloud |
| Hybrid |
| Edge |
| Virtual Desktop Infrastructure (VDI) |
| Desktop-As-A-Service (DaaS) |
| Remote Desktop Services (RDS) |
| Application Streaming |
| Grocery and Supermarkets |
| Fashion and Department Stores |
| Specialty Retail |
| Quick-Service Restaurants |
| E-Commerce Fulfillment Centers |
| Large Enterprises |
| Small and Medium Enterprises |
| North America | United States | |
| Canada | ||
| Mexico | ||
| South America | Brazil | |
| Argentina | ||
| Rest of South America | ||
| Europe | United Kingdom | |
| Germany | ||
| France | ||
| Spain | ||
| Italy | ||
| Rest of Europe | ||
| Asia Pacific | China | |
| India | ||
| Japan | ||
| Australia | ||
| South Korea | ||
| Rest of Asia Pacific | ||
| Middle East and Africa | Middle East | Saudi Arabia |
| United Arab Emirates | ||
| Turkey | ||
| Rest of Middle East | ||
| Africa | South Africa | |
| Kenya | ||
| Rest of Africa | ||
| By Deployment Model | On-Premise | ||
| Cloud | |||
| Hybrid | |||
| Edge | |||
| By Virtualization Technology | Virtual Desktop Infrastructure (VDI) | ||
| Desktop-As-A-Service (DaaS) | |||
| Remote Desktop Services (RDS) | |||
| Application Streaming | |||
| By Retail Sub-Vertical | Grocery and Supermarkets | ||
| Fashion and Department Stores | |||
| Specialty Retail | |||
| Quick-Service Restaurants | |||
| E-Commerce Fulfillment Centers | |||
| By Organization Size | Large Enterprises | ||
| Small and Medium Enterprises | |||
| By Geography | North America | United States | |
| Canada | |||
| Mexico | |||
| South America | Brazil | ||
| Argentina | |||
| Rest of South America | |||
| Europe | United Kingdom | ||
| Germany | |||
| France | |||
| Spain | |||
| Italy | |||
| Rest of Europe | |||
| Asia Pacific | China | ||
| India | |||
| Japan | |||
| Australia | |||
| South Korea | |||
| Rest of Asia Pacific | |||
| Middle East and Africa | Middle East | Saudi Arabia | |
| United Arab Emirates | |||
| Turkey | |||
| Rest of Middle East | |||
| Africa | South Africa | ||
| Kenya | |||
| Rest of Africa | |||


Key Questions Answered in the Report
What is the projected value of retail desktop virtualization solutions by 2030?
The market is expected to reach USD 3.48 billion by 2030, growing at a 10.42% CAGR.
Which deployment approach is expanding fastest across retail chains?
Edge-based virtual desktop infrastructure is forecast to grow at 12.56% CAGR as stores seek resilience during network outages.
How are small retailers funding virtualization projects?
Government subsidy programs in India, China, and Japan cover up to 50% of cloud costs, while DaaS providers offer usage-based tiers starting near USD 20 per user per month.
Why are retailers moving away from traditional VMware licenses?
Broadcoms switch to subscription-only licensing increased renewal costs, prompting chains to adopt cloud DaaS or hybrid alternatives bundled with existing cloud agreements.
What bandwidth is needed for a smooth virtual desktop session in stores?
Modern protocols require roughly 150 kbps per user for productivity workloads, but HD video and CAD tasks can need up to 5 Mbps.
Which regions show the highest growth potential through 2030?
Asia Pacific leads with an 11.32% CAGR, driven by digitalization mandates and cloud subsidies for small and medium retailers.
Page last updated on:


