Virtual Interior Design Services Market Size and Share
Market Overview
| Study Period | 2020 - 2031 |
|---|---|
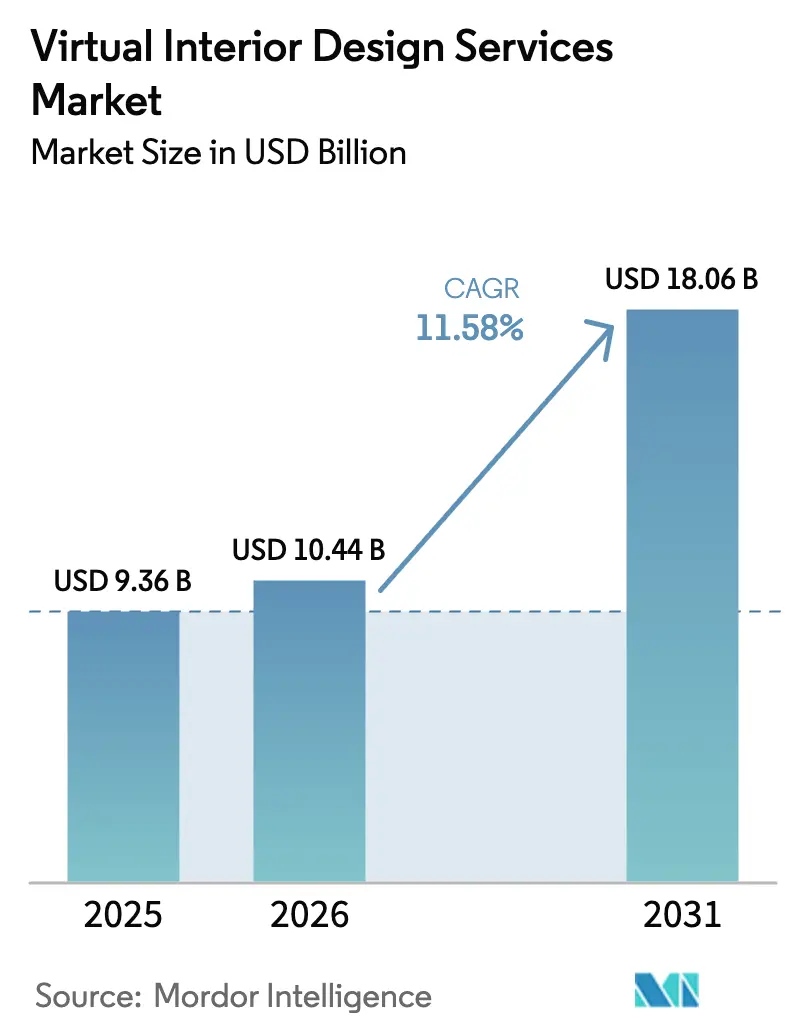
| Market Size (2026) | USD 10.44 Billion |
| Market Size (2031) | USD 18.06 Billion |
| Growth Rate (2026 - 2031) | 11.58% CAGR |
| Fastest Growing Market | Asia Pacific |
| Largest Market | North America |
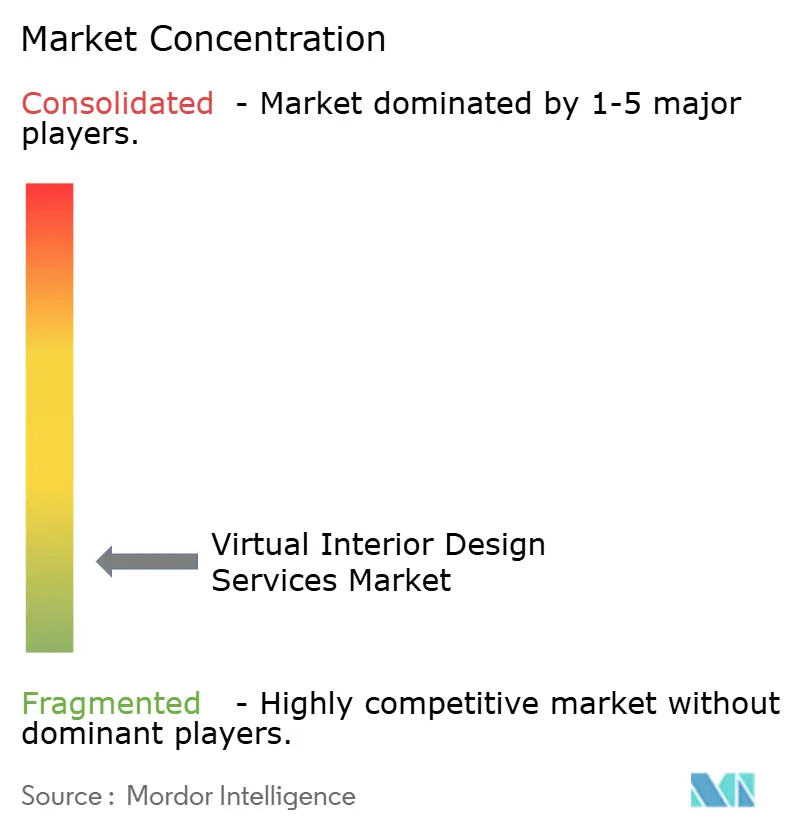
| Market Concentration | Low |
Major Players *Disclaimer: Major Players sorted in no particular order Image © Mordor Intelligence. Reuse requires attribution under CC BY 4.0. | |
Virtual Interior Design Services Market Analysis by Mordor Intelligence
The Virtual Interior Design Services market size was valued at USD 9.36 billion in 2025 and estimated to grow from USD 10.44 billion in 2026 to reach USD 18.06 billion by 2031, at a CAGR of 11.58% during the forecast period (2026-2031). The robust outlook reflects a sector that has shifted from a niche digital add-on to a mainstream delivery channel for both professional and do-it-yourself (DIY) customers. Key tailwinds include elevated home-improvement spending, rising adoption of affordable 3D and augmented-reality tools, and the expansion of reliable broadband networks in emerging economies. Platform operators also benefit from artificial-intelligence (AI) engines that shorten concept development cycles and from e-commerce tie-ins that unlock new revenue streams beyond design fees. Competitive intensity remains high because the top five providers command only 24% of global revenue, leaving substantial white space for technology-driven entrants that can scale across borders while localizing aesthetics and regulatory compliance. The Virtual Interior Design Services market is therefore poised for sustained double-digit growth as digital visualization becomes an entrenched step in both residential and commercial project workflows.
Key Report Takeaways
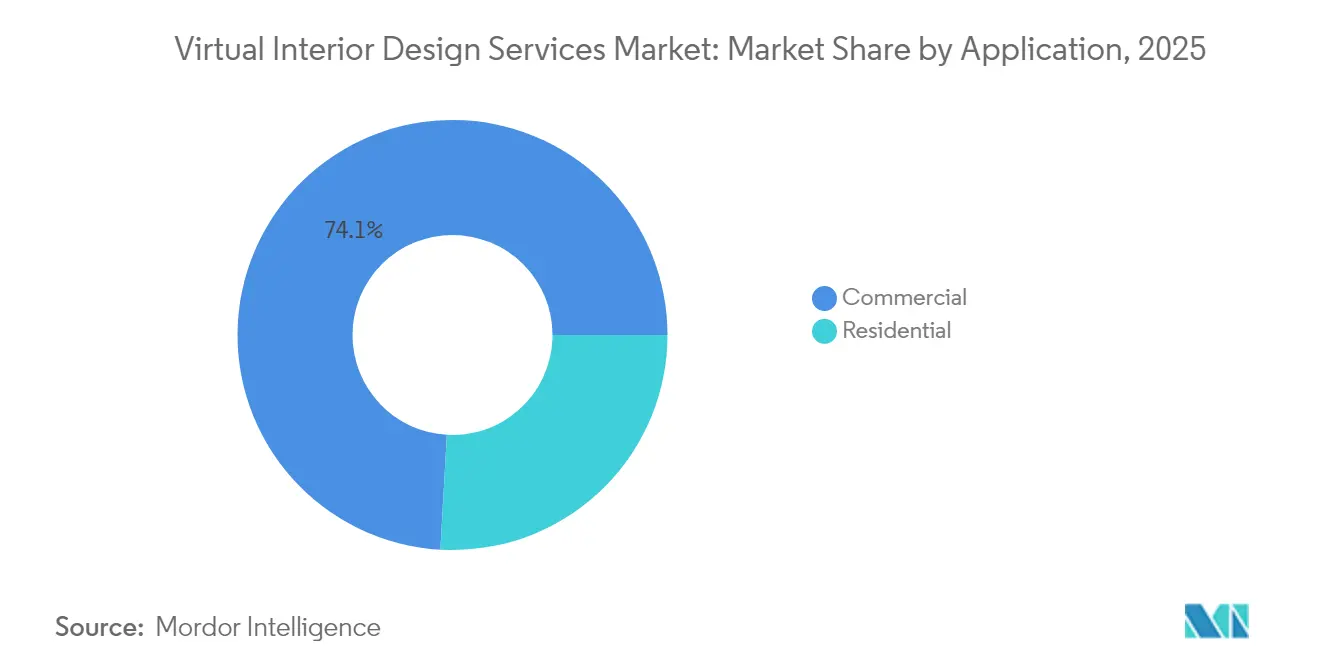
- By application, commercial projects led with 74.10% of the Virtual Interior Design Services market share in 2025, while residential projects are advancing at an 8.62% CAGR to 2031.
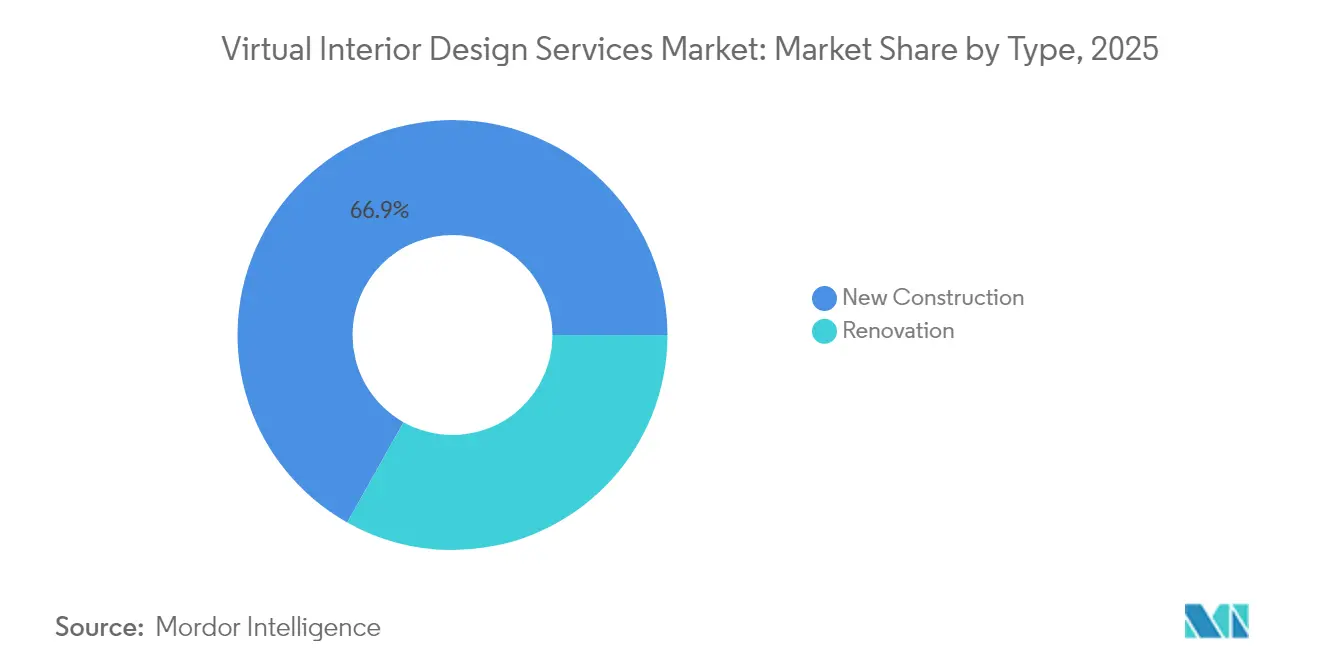
- By project type, newly decorated spaces held 66.85% of the Virtual Interior Design Services market size in 2025 and renovation projects are tracking a 9.88% CAGR through 2031.
- By service model, full-service offerings commanded 46.84% share of the Virtual Interior Design Services market size in 2025, yet DIY packages are expanding at 13.95% CAGR between 2026-2031.
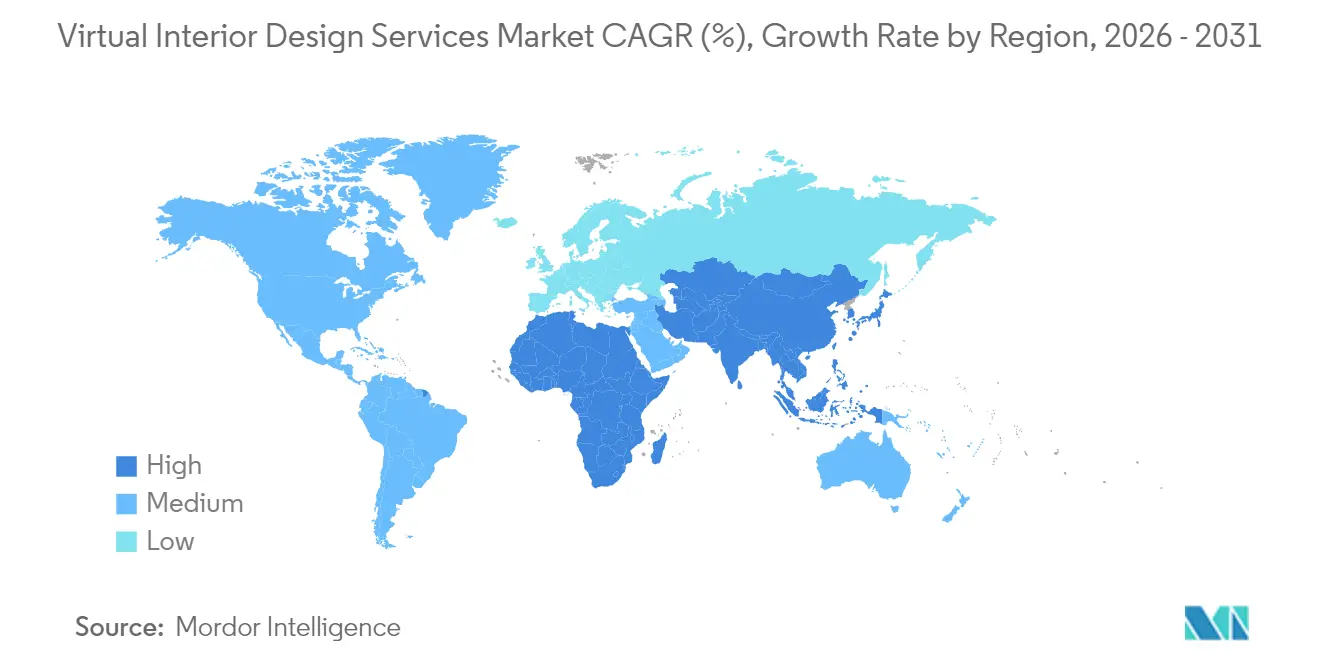
- By geography, North America retained 39.05% of the Virtual Interior Design Services market share in 2025, whereas Asia-Pacific is projected to register the fastest 10.52% CAGR during the forecast horizon.
Note: Market size and forecast figures in this report are generated using Mordor Intelligence’s proprietary estimation framework, updated with the latest available data and insights as of 2026.
Global Virtual Interior Design Services Market Trends and Insights
Drivers Impact Analysis*
| Driver | (~) % Impact on CAGR Forecast | Geographic Relevance | Impact Timeline |
|---|---|---|---|
| Post-pandemic home-remodel boom | +2.2% | Global, strongest in North America & Europe | Medium term (2-4 years) |
| Affordable 3D/AR-VR visualization uptake | +1.8% | Global, accelerated in Asia-Pacific | Short term (≤ 2 years) |
| E-commerce décor tie-ins boost conversions | +1.5 | Global, led by North America & Europe | Short term (≤ 2 years) |
| Broadband growth in emerging markets | +1.3% | Asia-Pacific core, spill-over to MEA & South America | Long term (≥ 4 years) |
| AI-generated design cuts iteration time | +1.0% | Global, early adoption in North America | Medium term (2-4 years) |
| Built-in green-design calculators align with incentives | +0.8% | Europe & North America, expanding to APAC | Long term (≥ 4 years) |
| Source: Mordor Intelligence | |||
Post-pandemic Home-Remodel Boom Sustains Virtual Demand
Elevated renovation budgets have created a structural tailwind for the Virtual Interior Design Services market as owners pursue professional guidance for more complex upgrades. Harvard data confirms that U.S. home-improvement outlays reached USD 420 billion in 2020 and have held near that level through 2025, establishing a higher baseline than pre-pandemic cycles[1]Harvard Joint Center for Housing Studies, “Improving America’s Housing 2021,” jchs.harvard.edu. . This spending coincides with wider acceptance of remote consultations, with 67% of homeowners preferring to visualize changes digitally before committing to construction. Platforms now monetize that behavioral shift through premium visualization tiers that speed decision-making and reduce costly rework. Commercial remodels follow the same pattern as companies reconfigure offices for hybrid work, further widening the addressable base. Because these trends are global, platform operators that optimize localized content but maintain a unified tech stack gain scale efficiency. Consequently, the home-remodel boom will continue to add more than 2 percentage points to the sector’s CAGR over the medium term.
Affordable 3D/AR-VR Visualization Technology Democratizes Design
The sharp fall in rendering and AR pricing has removed barriers for smaller studios and DIY consumers. Consumer-grade AR subscriptions now cost under USD 100 per month, compared with enterprise licenses that exceeded USD 10,000 in 2023. Retail pilots such as CartMagician report 40-60% jumps in online furniture conversions after embedding room-scale visualization into storefronts [2]Interior Design Magazine, “Technology Report 2024,” interiordesign.net.. As intuitive apps proliferate, network effects take hold: user familiarity grows, feeding more designer adoption, which in turn widens the overall Virtual Interior Design Services market. For commercial clients, cloud-rendering tools let procurement teams preview entire facility rollouts without expensive on-site mockups, slashing lead times from weeks to hours. Because low-cost mobile devices can now display high-fidelity scenes, adoption accelerates fastest in data-hungry Asia-Pacific cities where smartphone penetration already exceeds 80%.
E-commerce Décor Integration Transforms Revenue Models
Embedding design tools directly into retail pipelines allows platforms to capture margin on every SKU placed, pushing average revenue per user 150-200% above fee-only models. Havenly’s partnerships with The Citizenry and Interior Define illustrate this flywheel: design recommendations translate to one-click purchases, simplifying logistics for clients and growing order values for retailers. Commission-sharing aligns incentives between designers and vendors, while real-time stock feeds ensure that specified items can ship immediately. As a result, platforms move beyond a transactional service toward recurring revenue that covers design, financing, and last-mile delivery. The Virtual Interior Design Services market benefits because monetization improves unit economics, unlocking capital for R&D and marketing, which further expands the user base.
Broadband Infrastructure Expansion Unlocks Emerging Markets
Mobile-first economies in Asia-Pacific and Latin America are crossing the 60% broadband-penetration inflection point that triggers rapid digital-service adoption. GSMA forecasts mobile data usage in the region to quadruple to 53 GB per month by 2030, sufficient for cloud-based 3D streaming and synchronous collaboration[3]GSMA, “Mobile Economy Asia Pacific 2024,” gsma.com. . Cities without dense physical design networks can leapfrog to virtual services, closing an expertise gap for mid-income households and small businesses. Localized language packs and culturally relevant style templates further lower entry frictions. For platform operators, the incremental cost of serving these markets is minimal once infrastructure is in place, yet revenue upside is significant because annual interior spend per capita is rising off a low base. Consequently, broadband expansion adds another 1.3 percentage points to the forecast CAGR over the long term.
Restraints Impact Analysis*
| Restraint | (~) % Impact on CAGR Forecast | Geographic Relevance | Impact Timeline |
|---|---|---|---|
| Remote measurement accuracy limits | -1.5% | Global, acute in complex residential remodels | Short term (≤2 years) |
| Digital-skill shortages among designers | -1.2% | Global, sharper in emerging markets | Medium term (2-4 years) |
| Home-layout data-privacy concerns | -0.9% | Global, with heightened sensitivity in North America and EU due to stricter data regulations | Medium term (2–4 years) |
| Cross-border licensing fragmentation | -0.7% | International, especially challenging for firms operating across North America, EU, and APAC | Medium to Long term (3–5 years) |
| Source: Mordor Intelligence | |||
Remote Measurement Accuracy Constraints Limit Complex Project Adoption
Laser-based scanning tools such as Canvas achieve 1-2% tolerances under ideal conditions, but real-world environments often degrade precision. Kitchens and baths demand millimeter accuracy, so designers still schedule on-site validation, eroding the cost advantage of fully virtual workflows. Mistakes cascade into cabinetry reorders, plumbing conflicts, and schedule overruns that frustrate clients and hurt platform reputations. Hybrid models that blend virtual schematics with localized verification are emerging, yet they add fees that price-sensitive customers may reject. Until hardware improvements narrow the accuracy gap, high-value remodels will remain partially tethered to physical site visits, trimming as much as 1.5 percentage points from near-term CAGR.
Digital Skills Gap among Traditional Designers Constrains Adoption
Many seasoned professionals excel at tactile material selection and in-person relationship building, but lack fluency in modern visualization software. Surveys by The Design Cure Academy show that 60% of practicing interior designers are not proficient in advanced 3D modeling, limiting their ability to monetize virtual opportunities[4]The Design Cure Academy, “Digital Design Training Curriculum,” thedesigncure.com.. Younger graduates possess digital fluency but often lack the client-management acumen needed to price premium engagements. This bifurcation slows enterprise adoption, especially for luxury residential and hospitality projects that demand both artisanal expertise and digital delivery. Upskilling programs and more intuitive tools are closing the gap, yet the short-term drag on growth is notable, subtracting an estimated 1.2 percentage points from the sector’s expansion rate.
*Our forecasts treat driver/restraint impacts as directional, not additive. The impact forecasts reflect baseline growth, mix effects, and variable interactions.
Segment Analysis
By Type: Renovation Projects Accelerate Long-Term Expansion
New-build projects held 66.85% of 2025 revenue, benefiting from architect-supplied floor plans that simplify virtual space planning. However, renovation work is growing faster at a 9.88% CAGR as owners choose to optimize current footprints rather than relocate amid elevated property prices. The Virtual Interior Design Services market, therefore, finds fertile ground in retrofit scenarios where visualization clarifies constraints and mitigates costly surprises. Platforms that integrate building information model (BIM) data with AI layout engines can now detect plumbing runs, load-bearing walls, and electrical circuits before construction starts, reducing change orders by as much as 25%. As these capabilities mature, renovation projects will close the share gap, unlocking higher average project values and subscription renewals for providers. Compliance with local permitting also becomes easier when digital twins document existing conditions, lowering regulatory friction and speeding approvals.
For consumers, the ability to preview structural changes in photorealistic 3D de-risks major spending decisions. Homeowners report higher satisfaction scores when virtual renderings align closely with finished outcomes, reinforcing word-of-mouth referrals that expand platform reach. On the supply side, contractors collaborate more efficiently when uploads include precise demolition notes and parts lists. This interoperability drives down labor hours and material waste, further boosting renovation’s share within the Virtual Interior Design Services market. Economies of learning kick in as algorithms train on a growing library of retrofit scenarios, shortening design cycles for subsequent clients. As a result, renovation work is expected to account for a significantly larger slice of market revenue by 2030, even if new-construction volumes remain stable.


By Application: Commercial Dominance Faces Residential Disruption
Corporate and hospitality clients delivered 74.10% of 2025 turnover, valuing virtual design for brand-consistent rollouts across multiple sites. Facility managers leverage centralized dashboards to track furniture specifications, color palettes, and lighting schemes in real time, shortening design-to-installation timelines by 30% on average. Meanwhile, the Virtual Interior Design Services market is witnessing a residential surge, with home projects expanding 8.62% annually as remote work and social-media inspiration drive demand for stylish, functional spaces. AI recommendations lower the barrier for first-time buyers who might never have hired a traditional designer.
Homeowners also respond positively to cost transparency; virtual staging can run USD 300–600 compared with USD 2,000–6,000 for physical staging, enabling agents to list properties faster. In commercial spheres, AI models simulate foot-traffic patterns and acoustic profiles, adding data-driven rigor to aesthetic decisions and reducing post-occupancy complaints. Yet procurement cycles in enterprise settings can be lengthy, which gives nimble residential platforms room to iterate quickly and capture emerging consumer trends. Over time, the residential share of the Virtual Interior Design Services market is projected to rise, narrowing but not eliminating the lead held by commercial accounts.
By Service Model: DIY Platforms Challenge Full-Service Leadership
Full-service virtual engagements retained 46.84% of 2025 spending due to the depth of personalized guidance and turnkey project management they deliver. Clients appreciate end-to-end accountability, from initial concept to product ordering and logistics coordination. However, DIY packages are scaling fastest at a 13.95% CAGR, enabled by AI engines that translate a single smartphone photo into multiple style iterations within minutes. Consumers enjoy immediate gratification, lower prices, and gamified interfaces that make the design process feel interactive. The Virtual Interior Design Services market thus bifurcates into experience-rich concierge offerings and high-volume self-service platforms. Consultation-only models serve as an on-ramp, letting users sample professional input before committing. Importantly, some full-service firms now license their proprietary AI to maintain relevance, blending human oversight with algorithmic speed to meet varied budget segments. As capabilities converge, differentiation may hinge on exclusive product catalogs, proprietary visualization engines, and vertically integrated fulfillment. Nonetheless, DIY momentum signals a democratization wave that will keep downward pressure on average project fees even as total market value climbs.
Geography Analysis
North America controlled 39.05% of global revenue in 2025, a position underpinned by high disposable incomes, mature e-commerce systems, and early platform adoption. Corporate workplace reconfigurations remain a dependable revenue pillar, while a stable USD 420 billion annual home-improvement outlay anchors residential demand. Yet saturation among early adopters slows incremental growth, pushing operators to diversify into mid-tier cities and retrofit projects that still lack digital-first offerings. Regulatory frameworks such as NCIDQ certification shape feature roadmaps, as platforms must embed compliance filters for professional practice standards. Over the forecast window, the region is expected to post steady but moderate gains, reinforcing its role as an innovation test bed rather than the primary engine of global expansion.
Asia-Pacific is the growth pace-setter, projected at a 10.52% CAGR as urbanization and mobile-first behaviors converge. Countries like China and India leapfrog desktop-centric workflows, adopting cloud-rendering and smartphone-based LiDAR for instant room scans. Government 5G rollouts lower latency, enabling real-time collaborative sessions between designers and clients in different time zones. The Virtual Interior Design Services market thrives in dense metropolitan centers where small living spaces heighten the value of precision planning. Investment momentum is evident in HomeLane’s INR 3,000 crore (USD 360 million) acquisition of Design Café, which signals interest from both strategic buyers and private equity. Localization remains critical: style libraries must reflect regional aesthetics, and payment gateways need to support diverse digital-wallet ecosystems.
Europe ranks second by revenue, buoyed by stringent sustainability mandates that reward platforms capable of lifecycle carbon assessments. GDPR requirements elevate data-security expenditures, giving an edge to well-capitalized incumbents able to certify compliance. DIY adoption also gains traction as the continent’s EUR 388 billion home-improvement sector shifts online, with EUR 66 billion already digital. Meanwhile, South America and the Middle East & Africa post 7.05% and 8.11% CAGRs respectively, catalyzed by improved broadband coverage and youthful demographics. These emerging regions favor mobile apps with offline caching and local-language support, allowing designers to operate where skilled labor is scarce. Collectively, geographic trends reinforce a pivot from saturated Western markets toward high-growth corridors across Asia, Africa, and Latin America, underscoring the global-scalability imperative for platform providers.

Competitive Landscape
The Virtual Interior Design Services market remains fragmented, with leading providers holding a limited share of global revenue. Market concentration is moderate, suggesting a competitive landscape where no single player dominates. A wide range of firms, from established platforms to niche specialists, compete for market share. Lowe’s USD 1.325 billion purchase of Artisan Design Group highlights a retail push to own the customer journey from inspiration through installation. Similarly, HNI’s USD 2.2 billion Steelcase acquisition shows furniture makers valuing design services as entry points for product upselling. AI-centric startups such as Collov AI, which secured USD 10 million in Series A funding, exemplify investor appetite for algorithmic differentiation.
Strategic positioning now hinges on three pillars: AI capability, e-commerce integration, and regulatory compliance. Platforms with proprietary recommendation engines can cut concept time by 80%, improving designer productivity and client satisfaction. E-commerce tie-ins capture product margins that boost lifetime value and justify aggressive user-acquisition spending. Compliance know-how, from GDPR to local professional-licensing norms, forms a defensive moat against smaller rivals. In this environment, mid-size regional players face pressure either to specialize in vertical niches such as real-estate staging or to merge for scale.
Opportunity clusters include sustainability tooling, where MDPI research finds existing green-building protocols underweight interior material impacts. Providers integrating carbon calculators into design workflows could win share among environmentally conscious clients and qualify for public-sector contracts. Another frontier is mixed-reality collaboration; Microsoft’s entry via Mesh-enabled devices may spur incumbents to partner on hardware to enhance experiential quality. Over the next five years, expect a wave of consolidation, especially in markets where economic headwinds make capital-intensive standalone growth difficult. Firms that can align AI, supply-chain integration, and compliance leadership will likely emerge as global champions.
Virtual Interior Design Services Industry Leaders
Havenly
Decorilla
Houzz Pro
Foyr
Spacejoy
- *Disclaimer: Major Players sorted in no particular order

Recent Industry Developments
- September 2025: Google launched Mixboard, an AI-powered mood board application featuring automatic image sourcing, color palette generation, and collaborative editing capabilities. The platform integrates with Google's ecosystem services and represents the technology giant's entry into virtual design tools, potentially disrupting existing mood board and concept development workflows.
- February 2025: MattoBoard raised USD 2 million in funding to develop AI visual search capabilities for 3D mood boards and interior design applications. The investment validates growing investor interest in AI-powered design automation tools and positions the company to compete with established platforms through advanced computer vision and pattern recognition technologies.
- February 2024: Collov AI completed a USD 10 million Series A funding round to advance AI-driven interior design automation capabilities. The platform demonstrates the ability to generate multiple design variations from single room photographs within minutes, representing a significant advancement in automated design generation.
- February 2024: Higharc achieved USD 83 million in total funding with a USD 53 million Series B round to expand its cloud-based home design and construction platform. The investment supports the company's development of integrated design-to-construction workflows that could transform how virtual design services connect with physical implementation processes.


Global Virtual Interior Design Services Market Report Scope
A virtual interior design service is a type of interior design service that is conducted remotely, typically online, without the need for in-person consultations or visits to the client's physical space. This service leverages digital communication tools and technologies to collaborate with clients and provide personalized interior design solutions tailored to their needs, preferences, and budgets.
The virtual interior design services market is segmented by type, application, and geography. Based on type, the market is segmented into new construction and renovation, and by application, the market is segmented into residential and commercial. By geography, the market is segmented into North America, Europe, Asia-Pacific, South America, and the Middle East and Africa. The report offers market size and forecasts for the virtual interior design services market in value terms (USD) for all the abovementioned segments.
| New Construction |
| Renovation |
| Residential |
| Commercial |
| Full-Service Virtual Design |
| DIY Design Package |
| Consultation-Only |
| North America | United States |
| Canada | |
| Mexico | |
| South America | Brazil |
| Peru | |
| Chile | |
| Argentina | |
| Rest of South America | |
| Europe | United Kingdom |
| Germany | |
| France | |
| Spain | |
| Italy | |
| BENELUX | |
| NORDICS | |
| Rest of Europe | |
| Asia-Pacific | India |
| China | |
| Japan | |
| Australia | |
| South Korea | |
| South East Asia | |
| Rest of Asia-Pacific | |
| Middle East and Africa | United Arab Emirates |
| Saudi Arabia | |
| South Africa | |
| Nigeria | |
| Rest of Middle East and Africa |
| By Type | New Construction | |
| Renovation | ||
| By Application | Residential | |
| Commercial | ||
| By Service Model | Full-Service Virtual Design | |
| DIY Design Package | ||
| Consultation-Only | ||
| By Geography | North America | United States |
| Canada | ||
| Mexico | ||
| South America | Brazil | |
| Peru | ||
| Chile | ||
| Argentina | ||
| Rest of South America | ||
| Europe | United Kingdom | |
| Germany | ||
| France | ||
| Spain | ||
| Italy | ||
| BENELUX | ||
| NORDICS | ||
| Rest of Europe | ||
| Asia-Pacific | India | |
| China | ||
| Japan | ||
| Australia | ||
| South Korea | ||
| South East Asia | ||
| Rest of Asia-Pacific | ||
| Middle East and Africa | United Arab Emirates | |
| Saudi Arabia | ||
| South Africa | ||
| Nigeria | ||
| Rest of Middle East and Africa | ||


Key Questions Answered in the Report
What is the current value of the Virtual Interior Design Services market?
The sector is valued at USD 10.44 billion in 2026.
How fast is the Virtual Interior Design Services market expected to grow?
Revenue is forecast to expand at an 11.58% CAGR through 2031.
Which region is expanding the fastest?
Asia-Pacific is projected to grow at a 10.52% CAGR, outpacing all other regions.
Why are DIY design platforms gaining momentum?
AI tools let consumers create professional-quality concepts quickly and inexpensively, driving a 13.95% CAGR for DIY packages.
What limits adoption in high-value renovations?
Remote measurement inaccuracies often necessitate on-site validation, reducing purely virtual cost advantages.
Page last updated on:


