Vacation Rental Market Size and Share
Market Overview
| Study Period | 2020 - 2031 |
|---|---|
| Market Size (2026) | USD 109.40 Billion |
| Market Size (2031) | USD 136.78 Billion |
| Growth Rate (2026 - 2031) | 4.57% CAGR |
| Fastest Growing Market | Asia Pacific |
| Largest Market | North America |
| Market Concentration | Medium |
Major Players
*Disclaimer: Major Players sorted in no particular order Image © Mordor Intelligence. Reuse requires attribution under CC BY 4.0. |
|
Vacation Rental Market Analysis by Mordor Intelligence
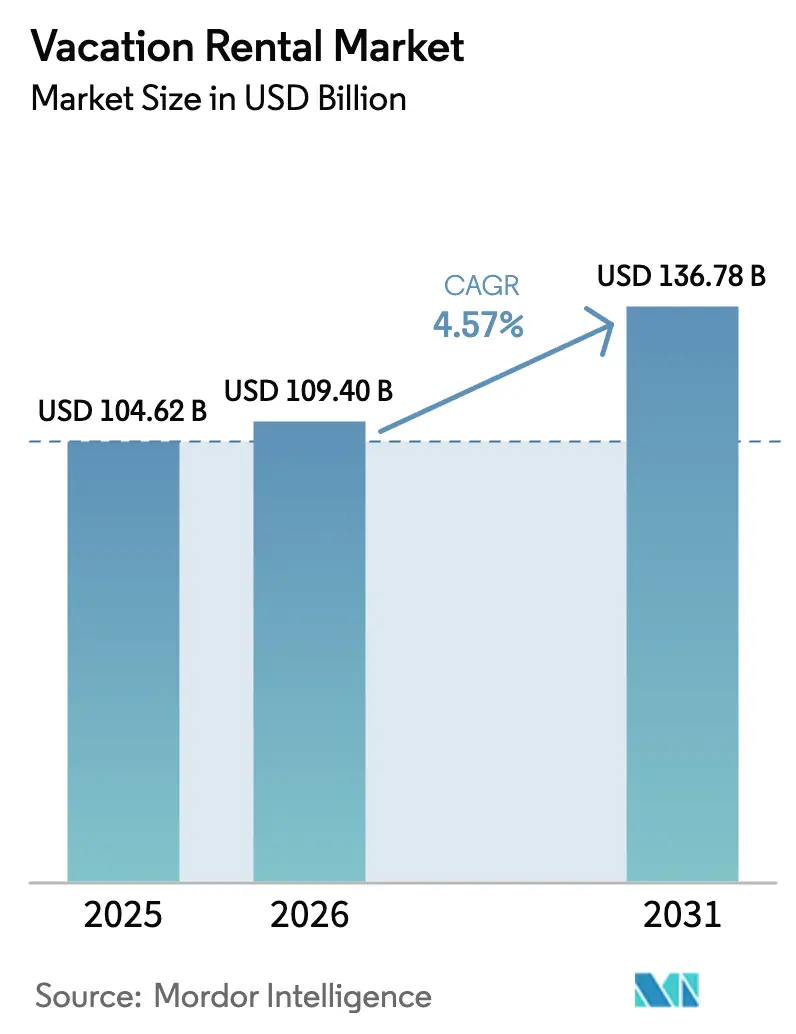
The Vacation Rental Market size is projected to be USD 104.62 billion in 2025, USD 109.40 billion in 2026, and reach USD 136.78 billion by 2031, growing at a CAGR of 4.57% from 2026 to 2031.
Demand moderation versus the pre-pandemic years signals that the vacation rental market is moving from hyper-growth to disciplined expansion, driven by new local rules that reward professionally managed inventory and stable occupancy. Millennials and Gen Z now account for 42% of users, amplifying digital-first booking behavior and spurring platform consolidation as operators race to offer friction-free mobile journeys. Bleisure travel is expanding the addressable base because 46% of business travelers extend trips for leisure, a pattern that funnels incremental nights into the vacation rental market. Regionally, Asia-Pacific shows the strongest acceleration as international arrivals rebound and the region’s expanding middle class channels discretionary spending into domestic road trips and outbound tourism. Technology adoption, especially AI-enabled pricing, is improving yield management, while premiumization raises average daily rates in the luxury tier.
Key Report Takeaways
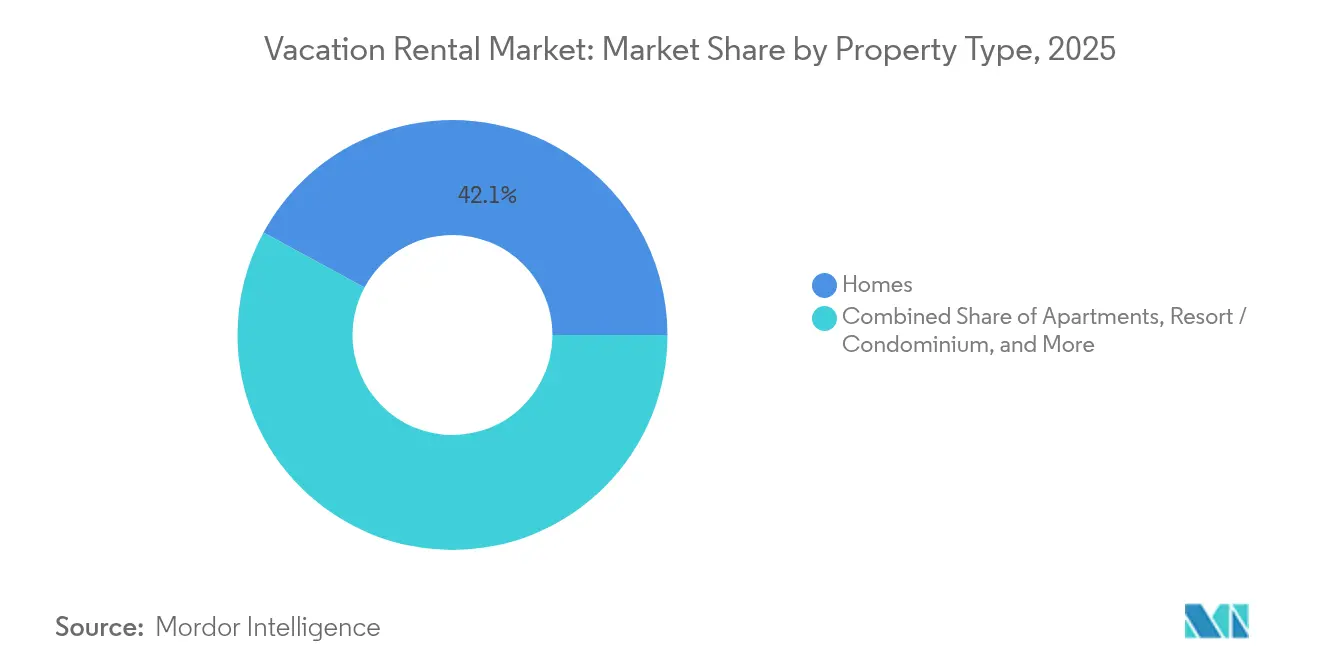
- By property type, homes held 42.10% of the vacation rental market share in 2025; resort and condominium units are forecast to expand at a 5.52% CAGR through 2031.
- By booking mode, offline channels retained 50.60% share of the vacation rental market in 2025; online portals are projected to post a 6.38% CAGR to 2031.
- By rental duration, short-term stays accounted for 61.75% share of the vacation rental market size in 2025; mid-term stays are set to advance at a 7.42% CAGR over the same period.
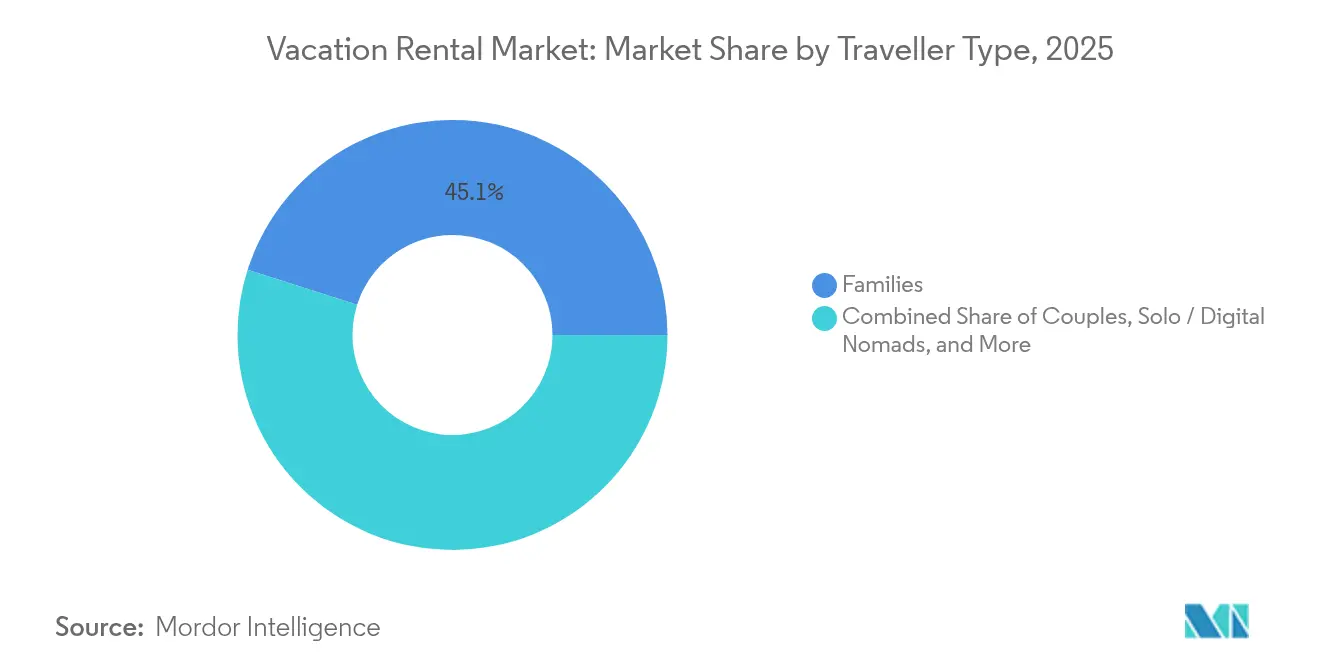
- By traveller type, families represented 45.10% share of the vacation rental market in 2025; solo travellers and digital nomads are anticipated to climb at a 7.73% CAGR to 2031.
- By price tier, mid-scale listings captured 46.85% share of the vacation rental market in 2025; luxury and premium properties are on course for a 6.18% CAGR up to 2031.
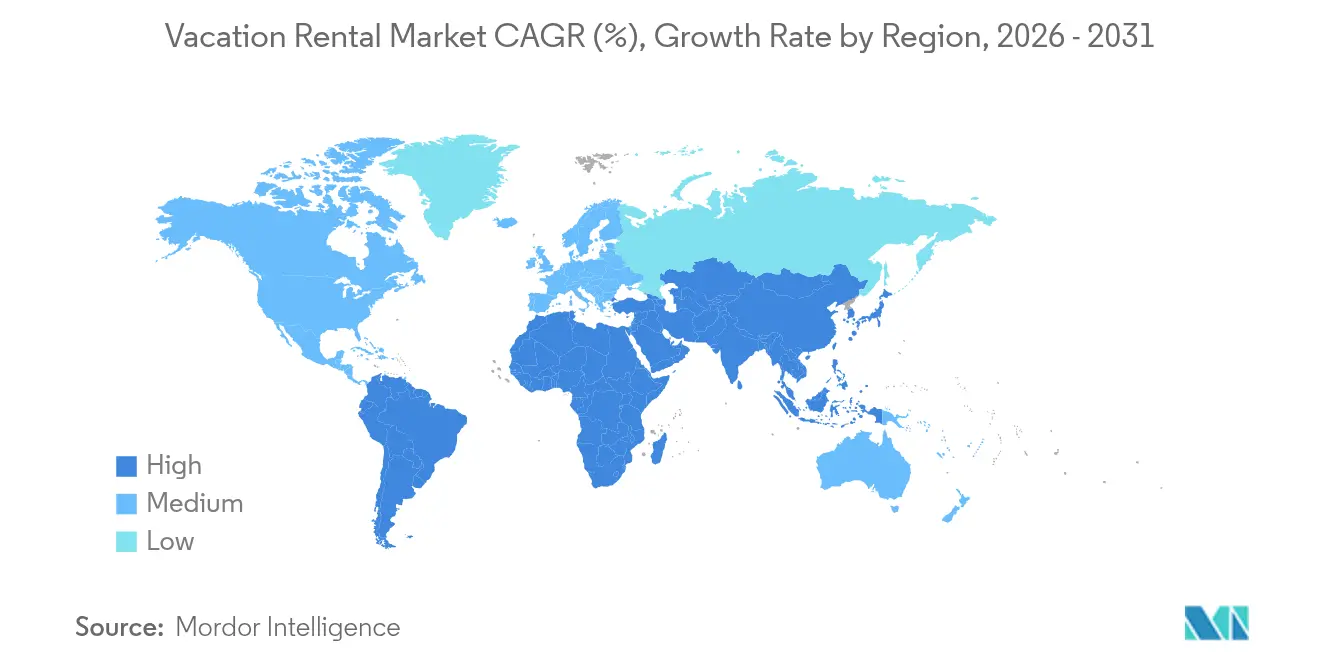
- By geography, North America controlled 36.10% revenue share of the vacation rental market in 2025; Asia-Pacific is expected to accelerate at an 8.76% CAGR through 2031.
Note: Market size and forecast figures in this report are generated using Mordor Intelligence’s proprietary estimation framework, updated with the latest available data and insights as of 2026.
Global Vacation Rental Market Trends and Insights
Drivers Impact Analysis*
| Driver | (~) % Impact on CAGR Forecast | Geographic Relevance | Impact Timeline |
|---|---|---|---|
| Mainstream rise of online booking platforms | +1.2% | Global with focus in Asia-Pacific | Medium term (2-4 years) |
| Growing millennial and Gen Z travel spending | +0.9% | North America and Europe | Long term (≥ 4 years) |
| Expansion of mid-term “workcation” demand | +0.7% | Urban peripheries and digital-nomad hubs | Medium term (2-4 years) |
| AI-driven dynamic pricing adoption | +0.4% | Technology-advanced markets worldwide | Short term (≤ 2 years) |
| Professionalisation of property management | +0.5% | North America and Europe | Long term (≥ 4 years) |
| Regulatory incentives for rural tourism | +0.3% | Europe and Asia-Pacific | Long term (≥ 4 years) |
| Source: Mordor Intelligence | |||
Mainstream rise of online booking platforms
Digital journeys dominate discovery and purchase as 90% of Gen Z travellers source trip ideas on social media and then convert within app-based ecosystems within the vacation rental market. Inventory depth and instant confirmations are increasing platform stickiness, illustrated by a 22.2% jump in Booking Holdings’ merchant revenue in Q1 2025 [1]Securities and Exchange Commission, “Booking Holdings Inc. Form 10-Q Q1 2025,” sec.gov. Operators deploying AI search and voice assistants report lower abandonment rates, signalling that frictionless UX is now a competitive baseline.
Growing millennial and Gen Z travel spending
Delayed home ownership and a bias toward experiences over assets redirect discretionary income toward travel. A Global Business Travel Association study confirmed that 46% of corporate travellers now combine work and holiday, blending spending from employer budgets with personal outlays [2]Global Business Travel Association, “BTI Outlook 2025,” gbta.org. Price rather than brand loyalty guides 88% of younger customers, favouring transparent marketplaces that surface total stay costs up-front in the vacation rental market.
Expansion of mid-term “workcation” demand
Remote-friendly employment policies sustain longer itineraries. Purpose-built extended-stay listings in Bangkok produced an 18.8% year-on-year revenue improvement, supported by strong fibre availability and co-working access. Countries such as Thailand are adding digital-nomad visas, which lengthens average length of stay and boosts local spend on groceries, transport and entertainment.
AI-driven dynamic pricing adoption
Yield-management engines scrape local events, competitor rates and lead-time curves to refresh nightly prices. OYO credited machine-learning tools for a 15% revenue rise in its UK portfolio during 2024. Smaller hosts plug into third-party APIs to match these capabilities, creating a data gap advantage for tech-enabled managers.
Restraints Impact Analysis*
| Restraint | (~) % Impact on CAGR Forecast | Geographic Relevance | Impact Timeline |
|---|---|---|---|
| Safety and security concerns | -0.8% | Global, pronounced for solo and female guests | Medium term (2-4 years) |
| Tightening local STR regulations | -1.1% | North America, Europe, select Asia-Pacific | Short term (≤ 2 years) |
| Rising cleaning and compliance costs | -0.6% | High-labour-cost markets worldwide | Medium term (2-4 years) |
| Hotel sector’s targeted loyalty discounts | -0.4% | North America and Europe | Short term (≤ 2 years) |
| Source: Mordor Intelligence | |||
Safety and security concerns
High-profile incidents remind travellers that host-run properties lack uniform brand standards. The fragmented supply base complicates regulatory supervision, while many travel-insurance products exclude damage cover for vacation rentals. Platforms now require identity verification and install tamper-proof smart locks, yet inconsistent roll-outs perpetuate guest hesitation.
Tightening local STR regulations
Municipal bodies are imposing licence caps, principal-residence rules and zoning limits. Barcelona’s plan to phase out short-term rental licences by 2028 underscores the political risk that trims inventories and raises compliance costs. Platform engineering teams must refactor listings to surface only fully compliant homes, reducing available nights in high-demand cities.
*Our forecasts treat driver/restraint impacts as directional, not additive. The impact forecasts reflect baseline growth, mix effects, and variable interactions.
Segment Analysis
By Property Type: sustained appetite for resort-style condominiums
Resort and condominium units are expanding at a 5.52% CAGR, surpassing traditional homes that still hold 42.10% of the vacation rental market share in 2025. The vacation rental market size for resort-style inventory is forecast to widen further as affluent travellers migrate from hotels toward full-service apartments with on-site gyms and pools.
Premiumisation deepens as smart locks, touchless thermostats and integrated media hubs become standard. Villas and cabins secure niche demand among privacy-seekers and rural tourists, but scale economics currently favour multi-unit complexes that amortise amenity investments across larger keys.


By Booking Mode: online portals widen revenue gap
Offline agents still controlled 50.60% of the vacation rental market share in 2025, yet online portals are forecast to grow at a 6.38% CAGR. Mobile usage climbs as 68% of travellers now complete an entire booking journey on a smartphone, favouring one-click checkout and in-app support.
Hosts are investing in direct-booking engines to preserve margin, but aggregated marketplaces remain discovery gateways thanks to SEO dominance and loyalty wallets that unlock instant refunds. Social media’s influence is unmistakable; 90% of Gen Z travellers say trip ideas start on TikTok or Instagram. Voice search adoption is next: early pilots by Booking Holdings show a 9% uplift in conversion when travellers can query accommodation options hands-free. To safeguard brand trust, portals now highlight verified reviews, mandatory identity checks, and flexible cancellation badges, dampening post-purchase anxiety and nudging indecisive browsers toward confirmation.
By Rental Duration: mid-term stays rewrite operating models
Short-term bookings dominated with 61.75% of vacation rental market share in 2025, but mid-term contracts spanning 8–30 nights are expanding at a 7.42% CAGR. Corporate “workcation” policies fuel demand for units with ergonomic desks, dual monitors and 100 Mbps fibre. Cities such as Bangkok recorded 18.8% year-over-year revenue growth for properties targeting these travellers.
For owners, lower cleaning frequency and decreased vacancy offset the slightly reduced nightly rate, lifting net yields by as much as 11 percentage points. Platforms have responded with calendar tools that auto-discount longer inquiries and integrate coworking passes. Municipal regulators, keen to discourage speculative flips, often grant preferential licences to stays above seven nights, inadvertently steering hosts toward the mid-term segment. This regulatory nudge, combined with remote-first employment cultures, positions mid-term inventory as the single largest source of incremental nights sold through 2030.
By Traveller Type: solo explorers and digital nomads take off
Families generated 45.10% of the vacation rental market share during 2025, whereas solo travellers and digital nomads are scaling fastest at a 7.73% CAGR. Parental demand centres on multi-bedroom safety-certified homes close to theme parks and beaches, sustaining high-season spikes.
Single guests prioritise location independence, reliable Wi-Fi, and community events; listings that bundle co-living gatherings achieve 12% longer average stays. Hassle-free self-check-in reassures female travellers concerned about late-night arrivals, while smart-lock audit trails reduce host liability. Loyalty programmes now experiment with wellness add-ons, yoga classes, and local language workshops to retain this increasingly experience-driven cohort. The blended effect is a wider demand spectrum that compels property managers to segment amenities and pricing with greater precision.
By Price Tier : mid-scale leads, luxury lifts margins
Mid-scale units accounted for 46.85% of vacation rental market share in 2025, yet luxury and premium properties are expanding at a 6.18% CAGR. Affluent households gravitate toward private pools, cinema rooms and chef services, underpinning a 73% spike in demand for rentals priced above USD 1,000 per night since 2019.
Operators upsell airport transfers, yacht charters, and personalised excursions, boosting ancillary revenue by up to 22%. Sustainability credentials matter: solar panels and grey-water recycling often feature in listing descriptions aimed at high-income but eco-conscious travellers. Budget stock, although slower growing, benefits from cash-strapped millennials who still prefer homes over economy hotels, preserving stable off-peak occupancy. Closing the value gap, mid-scale hosts adopt dynamic pricing dashboards that harvest 3%–5% incremental RevPAR, ensuring this bracket remains the foundation for consistent cash flow across seasons.
Geography Analysis
North America commands 36.10% of 2025 revenue in the vacation rental market, reflecting a mature but regulation-strained environment. Inventory caps in New York and Los Angeles suppress listing growth, but suburban and drive-to destinations gain share as domestic leisure trips remain sticky. AI pricing tools and smart-device automation improve cost control for professional managers in Orlando and Scottsdale.
Asia-Pacific is the growth engine with an 8.76% CAGR to 2031. The Pacific Asia Travel Association projects international arrivals to reach 813.7 million by 2027, fuelling room-night demand across Japan, Indonesia, and India . Middle-class expansion, supported by Mastercard’s consumer-expenditure forecasts, channels spending into domestic long-weekend breaks and outbound group tours . Governments from Thailand to Malaysia now issue digital-nomad visas that stimulate mid-term bookings and diversify seasonal revenue.
Europe remains structurally important yet highly fragmented. Municipal crack-downs restrict city-core supply, pushing growth to rural wine routes and coastal eco-villages backed by European Union sustainability grants. Hosts retrofit energy-efficient HVAC and install solar panels to comply with upcoming carbon-reporting directives, positioning green features as a rate premium rather than a cost burden.

Competitive Landscape
Market structure is moderately fragmented: the five largest operators capture about 35% of gross bookings. Airbnb retains brand primacy but Booking Holdings and Expedia Group leverage metasearch traffic to narrow the gap. Cross-listing APIs allow hosts to syndicate inventory effortlessly, intensifying price competition and accelerating response times.
Professional management platforms pursue scale via mergers. Casago’s May 2025 purchase of Vacasa for USD 128.6 million created a 40,000-unit portfolio with unified revenue-management software and a shared housekeeping workforce. Guesty added USD 130 million of growth capital in 2024 to broaden its property-tech stack into 80 countries.
Strategic alliances flourish. Mastercard and select operators run joint marketing campaigns that bundle cardholder perks with instant booking credits. Telecommunications firms in Korea and Japan supply discounted fibre to hosts in exchange for in-unit branding. These moves underscore that technology integrations, regulatory compliance capacity and financing heft are now core differentiators in the vacation rental market.
Vacation Rental Industry Leaders
-
Airbnb Inc.
-
Booking Holdings, Inc.
-
Expedia Group, Inc.
-
Vacasa LLC
-
Sonder Holdings Inc.
- *Disclaimer: Major Players sorted in no particular order

Recent Industry Developments
- May 2025: Casago completed its acquisition of Vacasa for USD 128.6 million, creating a management platform spanning 40,000 North American properties Vacasa.
- April 2025: Booking.com partnered with Maldives to widen listing depth, while HomeToGo launched five localized portals to improve price discovery Rental Scale-Up.
- April 2025: Garnett Station Partners introduced Stayterra, a premium management collection targeting high-end U.S. destinations.
- February 2025: OYO announced the India launch of its European vacation-rental brand DanCenter to diversify domestic supply.


Research Methodology Framework and Report Scope
Market Definitions and Key Coverage
Our study frames the vacation rental market as all privately owned, fully-furnished dwellings, homes, apartments, villas, cabins, and resort condominiums leased to travelers for stays of fewer than thirty nights and booked either directly with owners or through online platforms.
Scope exclusion: Long-stay corporate housing and unfurnished residential leases are not considered part of this market.
Segmentation Overview
-
By Property Type
- Homes
- Apartments
- Resort / Condominium
- Villas
- Cabins / Cottages
- Others
-
By Booking Mode
- Online Platforms
- Direct-to-Owner Websites
- Offline / Travel Agent
-
By Rental Duration
- Short-Term (<7 nights)
- Mid-Term (8-30 nights)
- Long-Term (>30 nights)
-
By Traveller Type
- Families
- Couples
- Solo / Digital Nomads
- Business Travellers
- Groups (Friends, Events)
-
By Price Tier
- Budget
- Mid-scale
- Luxury / Premium
-
By Geography
-
North America
- United States
- Canada
- Mexico
-
South America
- Brazil
- Argentina
- Rest of South America
-
Europe
- Germany
- United Kingdom
- France
- Italy
- Spain
- Russia
- Rest of Europe
-
Asia-Pacific
- China
- Japan
- India
- South Korea
- Australia and New Zealand
- Rest of Asia-Pacific
-
Middle East and Africa
-
Middle East
- Saudi Arabia
- United Arab Emirates
- Turkey
- Rest of Middle East
-
Africa
- South Africa
- Nigeria
- Egypt
- Rest of Africa
-
Middle East
-
North America
Detailed Research Methodology and Data Validation
Primary Research
Mordor analysts interviewed property managers, channel managers, tourism boards, and revenue-management software vendors across North America, Europe, and Asia-Pacific. These discussions tested secondary findings, refined assumptions on average length of stay, and revealed fast-moving factors such as short-term rental caps and dynamic pricing adoption.
Desk Research
We began by mapping supply, demand, and pricing fundamentals through public sources such as UNWTO arrival dashboards, the U.S. Bureau of Economic Analysis's travel-related PCE tables, Eurostat nights-spent data, and AirDNA's open performance indices. Region-level tourism satellite accounts, national short-let registries (for example, "Numero d'enregistrement"), and filings submitted to the SEC by listed platforms enriched our view of inventory, occupancy, and average daily rate trends. Select paid databases, including D&B Hoovers for host-operator financials and Dow Jones Factiva for transaction news, helped validate company-level signals. This list is illustrative; many other credible sources were tapped for cross-checks and clarifications.
Market-Sizing & Forecasting
We anchored the 2025 baseline with a top-down reconstruction that starts from country tourism receipts and short-stay penetration rates, which are then adjusted for ADR by property class and guest cohort. Target outputs were subsequently corroborated with bottom-up roll-ups of sampled host inventory and channel bookings in key cities to fine-tune totals. Key variables feeding the model include inbound tourist arrivals, domestic holiday intention surveys, city-level license issuance, platform fee trajectories, occupancy seasonality patterns, and remote-work prevalence. Multivariate regression, complemented by scenario analysis for regulatory risk, produces the 2025-2030 outlook while gap-handling routines flag and smooth anomalies when micro-data are sparse.
Data Validation & Update Cycle
Every draft table passes a three-layer review: analyst, senior analyst, and research manager. Outliers trigger re-contact of sources. Models refresh annually, with interim updates when material regulations, tax rules, or travel shocks surface.
Why Our Vacation Rental Baseline Earns Uncommon Trust
Published values differ because firms choose distinct property buckets, pricing assumptions, and refresh rhythms.
Key gap drivers include whether shared-room listings are counted, how off-line bookings are proxied, and if homestay or serviced-apartment revenue is bundled. Our work reports a balanced base case and uses yearly source updates, whereas others often freeze exchange rates or extrapolate older ADRs.
Benchmark comparison
| Market Size | Anonymized source | Primary gap driver |
|---|---|---|
| USD 104.62 B (2025) | Mordor Intelligence | - |
| USD 95.66 B (2024) | Global Consultancy A | Excludes shared-economy "private room" listings; static pricing grid |
| USD 174.84 B (2024) | Industry Publisher B | Bundles hostel, homestay, and hybrid hotel revenue; broad location scope |
The comparison shows that by selecting the right property definitions, applying recent ADR data, and refreshing our model each year, we deliver a dependable, transparent baseline that decision-makers can trace back to clear variables and repeatable steps.


Key Questions Answered in the Report
What is the current size of the vacation rental market?
The vacation rental market is worth USD 109.4 billion in 2026 and is forecast to grow to USD 136.78 billion by 2031.
Which region is expanding fastest for vacation rentals?
Asia-Pacific leads with an 8.76% CAGR through 2031 due to rebounding international arrivals and supportive digital-nomad policies.
Why are mid-term stays important?
Stays of 8–30 nights are growing at 7.42% CAGR as remote work and bleisure trends lengthen average trip duration and boost total booking value.
How are regulations affecting the market?
Cities in North America and Europe impose stricter short-term rental licences and zoning rules, limiting supply and raising compliance costs.
What technologies influence host revenue?
AI-powered dynamic pricing, smart-home automation and direct-booking engines help hosts increase occupancy, streamline operations and enhance guest experience.
Is luxury inventory outperforming?
Yes, luxury and premium homes record 6.18% CAGR due to affluent travellers seeking privacy, space and concierge-style amenities not available in traditional hotels.
Page last updated on:


