Space Tourism Market Size and Share
Market Overview
| Study Period | 2020 - 2031 |
|---|---|
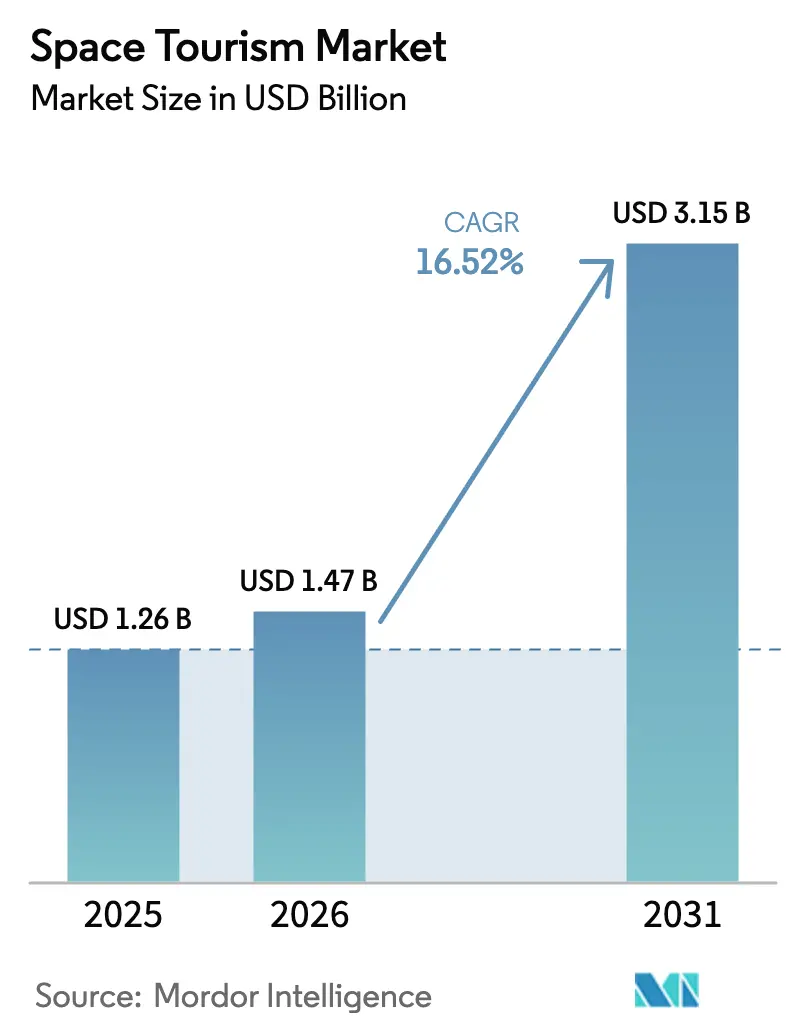
| Market Size (2026) | USD 1.47 Billion |
| Market Size (2031) | USD 3.15 Billion |
| Growth Rate (2026 - 2031) | 16.52% CAGR |
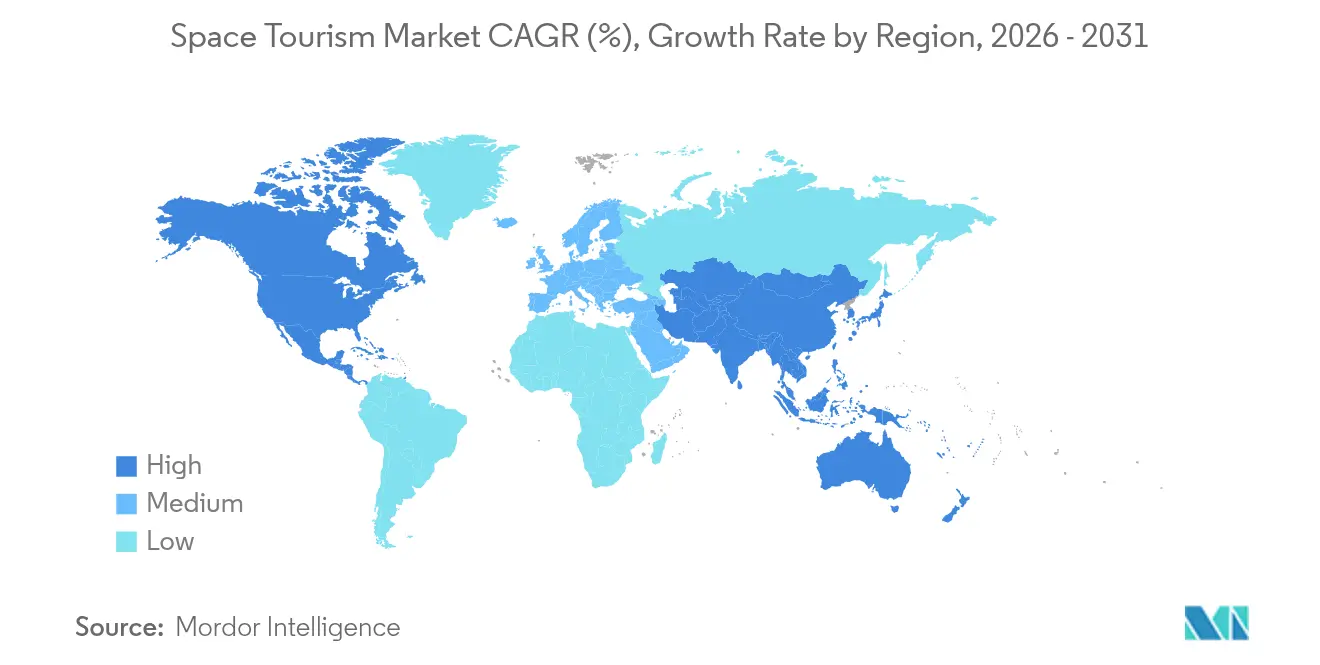
| Fastest Growing Market | Asia Pacific |
| Largest Market | North America |
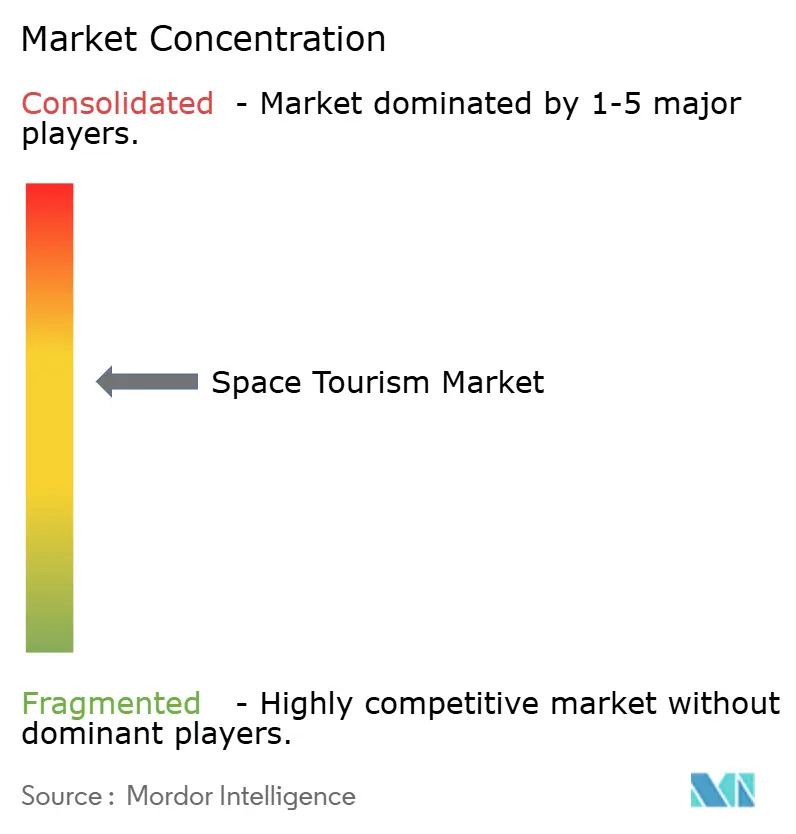
| Market Concentration | Medium |
Major Players
*Disclaimer: Major Players sorted in no particular order Image © Mordor Intelligence. Reuse requires attribution under CC BY 4.0. |
|
Space Tourism Market Analysis by Mordor Intelligence
The space tourism market size is expected to grow from USD 1.26 billion in 2025 to USD 1.47 billion in 2026 and is forecast to reach USD 3.15 billion by 2031 at 16.52% CAGR over 2026-2031. Growth rests on falling launch costs, maturing reusable vehicles, and the widening appeal of high-altitude balloon flights that bring ticket prices below USD 200,000. Sub-orbital experiences account for the largest slice of the space tourism market, yet orbital missions and lunar fly-bys post the quickest gains as national “Commercial LEO Destinations” programs clear the regulatory path. Competition remains centered on technology leadership and vertical integration, with SpaceX, Blue Origin, and Virgin Galactic dictating standards for cost, safety, and flight cadence. Meanwhile, Asian and European entrants leverage public-private funding to compress development timelines, and hospitality partners design in-orbit accommodation to diversify revenue. Headline risks stem from safety incidents, carbon-emission scrutiny, and fragmented liability rules, but the long-term trajectory of the space tourism market still relies on sustained cost innovation and clearer cross-border regulation.
Key Report Takeaways
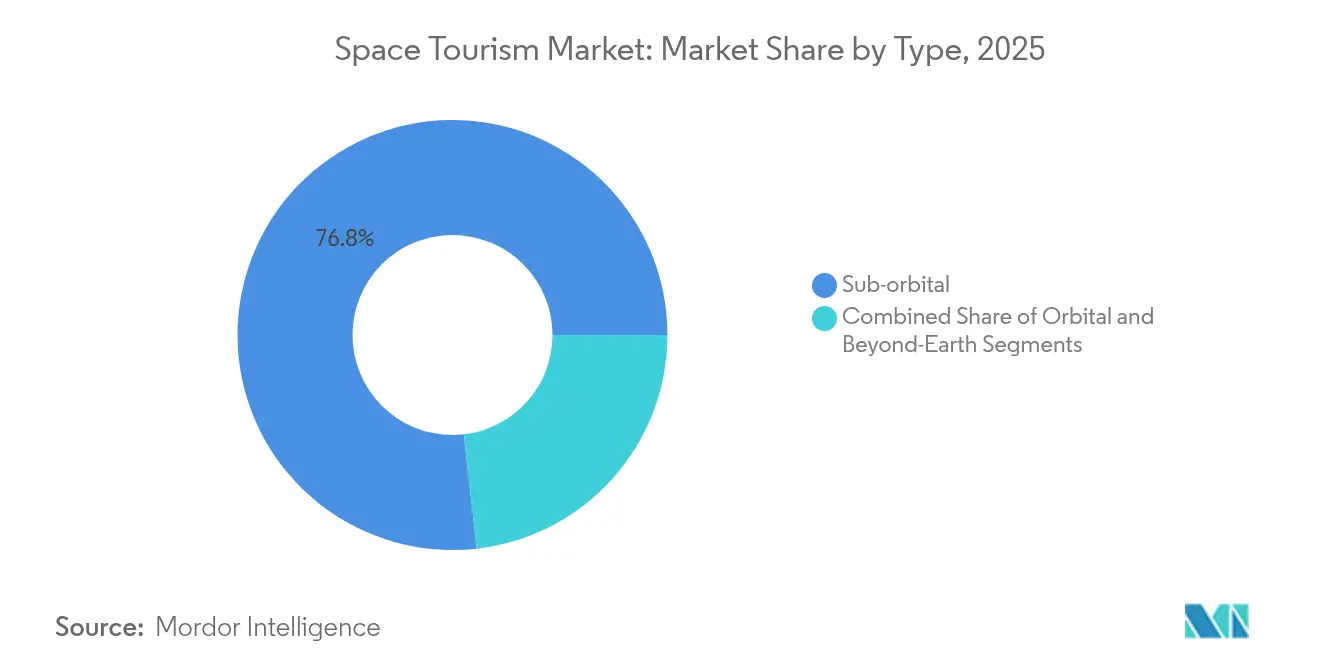
- By type, sub-orbital flights led with 76.80% revenue share in 2025, while orbital tourism is projected to accelerate at a 35.4% CAGR through 2031.
- By end-user, commercial HNWIs commanded 85.30% of the space tourism market share in 2025; ultra-HNWIs register the fastest 40.1% CAGR to 2031.
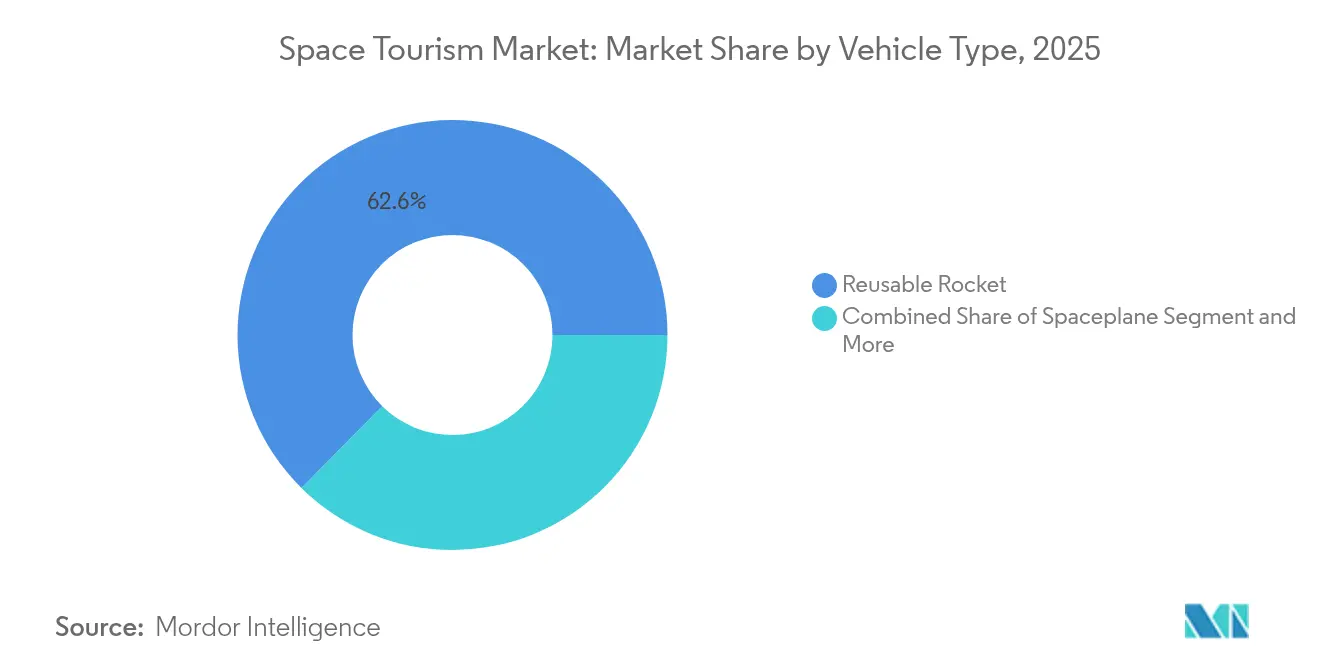
- By vehicle type, reusable rockets held 62.60% of the space tourism market size in 2025 as high-altitude balloons are set to expand at a 44.2% CAGR.
- By destination, edge-of-space trips captured 53.90% share in 2025, while lunar fly-by missions are poised for a 51.8% CAGR.
- By geography, North America controlled 60.70% of revenues in 2025 and Asia-Pacific is on track for the highest 22.1% CAGR.
Note: Market size and forecast figures in this report are generated using Mordor Intelligence’s proprietary estimation framework, updated with the latest available data and insights as of 2026.
Global Space Tourism Market Trends and Insights
Drivers Impact Analysis*
| Driver | (~) % Impact on CAGR Forecast | Geographic Relevance | Impact Timeline |
|---|---|---|---|
| Continuous improvements in reusable launch systems | +4.1% | Global | Medium term (2-4 years) |
| Falling ticket prices as launch costs decline | +3.6% | North America, Asia-Pacific | Medium term (2-4 years) |
| Expanding private and SPAC funding pipeline | +2.8% | Global, especially Asia, US | Short term (≤ 2 years) |
| National “Commercial LEO Destinations” programmes | +2.3% | US, China, EU, Japan | Long term (≥ 4 years) |
|
High-altitude balloon tourism opening |
+1.1% | Europe, US, China | Short term (≤ 2 years) |
| Brand-activation demand for in-orbit marketing stunts | +0.9% | Global, with US/EU focus | Short term (≤ 2 years) |
| Source: Mordor Intelligence | |||
Continuous improvements in reusable launch systems
Reusable launch vehicles now fly with turnaround times measured in days rather than months, pushing per-kilogram costs down from above USD 18,000 to nearly USD 1,400. Blue Origin’s New Shepard and SpaceX’s Falcon 9 show reliable recovery rates, while Starship prototypes aim for full reusability and heavy-lift capacity. Similar VTVL projects in China, Japan, and Europe narrow the technology gap, creating more operators who can offer frequent sub-orbital and LEO experiences at lower price points. These gains ripple across the space tourism market, boosting flight frequency, improving asset utilization, and driving ticket price elasticity.
Falling ticket prices as launch costs decline
Ticket prices for sub-orbital experiences fell from USD 450,000 in 2024 to a 2025–2030 outlook of USD 200,000–300,000. High-altitude balloon concepts already list seats near USD 140,000, signaling that the customer base is broadening beyond ultra-wealthy pioneers. The price drop re-positions the space tourism market as a premium adventure segment rather than an ultra-luxury one, creating volume gains that offset thinner margins. Asian providers add further downward pressure through livestream sales and low-margin entry strategies, spurring incumbents to accelerate cost-reduction roadmaps[2]https://edition.cnn.com/2024/10/25/china/china-space-tourism-ticket-sale-livestream-intl-hnk/index.html.
Expanding private and SPAC funding pipeline
Private equity, sovereign funds, and SPAC deals inject unprecedented capital into early-stage vehicle programs, stratospheric balloon fleets, and commercial LEO stations. Titans Space reached a USD 25 billion valuation in 2025, validating investor confidence in long-term revenue potential from luxury hotels, in-orbit sponsorships, and lunar excursions. Japan’s USD 6.4 billion Space Strategy Fund matches these private flows, while India’s startup ecosystem counts more than 200 new ventures since 2024. This funding surge compresses R and D cycles and supports multiple technology bets, increasing competitive diversity within the space tourism market.
National “Commercial LEO Destinations” programs
NASA’s transition plan from ISS to commercial platforms grants providers clearer licensing and indemnification terms, unlocking new demand for orbital stays. Parallel initiatives in China, Japan, and India promise crewed access and shared microgravity labs, giving the space tourism market a multi-national supply base. Long-term contracts for cargo, crew transfer, and science payloads help operators stabilize cash flows, which in turn support tourism hardware investment and hospitality partnerships[1]National Aeronautics and Space Administration, “Commercial LEO Destinations Liability Framework,” nasa.gov.
Restraint Impact Analysis*
| Restraint | (~) % Impact on CAGR Forecast | Geographic Relevance | Impact Timeline |
|---|---|---|---|
| Safety incidents and perceived catastrophic-risk profile | -3.1% | Global | Short term (≤ 2 years) |
| Regulatory and liability uncertainty across jurisdictions | -2.8% | US, EU, Asia | Medium term (2-4 years) |
| Carbon-emissions scrutiny and potential flight quotas | -1.1% | EU, US, China | Long term (≥ 4 years) |
| Rising space-weather/insurance premia for crewed flights | -0.8% | Global | Medium term (2-4 years) |
| Source: Mordor Intelligence | |||
Safety incidents and perceived catastrophic-risk profile
High-profile test failures and operational pauses quickly dominate headlines, amplifying public concern and elevating insurance costs. Current passenger-safety regulations emphasize informed consent yet omit detailed radiation-exposure limits and emergency-evacuation rules. As a result, potential travelers hesitate, insurers widen exclusions, and operators incur higher reserve requirements that could slow fleet expansion.
Regulatory and liability uncertainty across jurisdictions
The lapse of the US learning-period moratorium means the FAA can impose new crew and passenger standards, but final rules remain uncertain. Cross-border missions face additional complexity as insurers demand higher liability ceilings without government backstops. The resulting premium inflation directly affects ticket pricing and capital allocation, delaying some orbital-station projects and balloon deployments.
*Our forecasts treat driver/restraint impacts as directional, not additive. The impact forecasts reflect baseline growth, mix effects, and variable interactions.
Segment Analysis
By Type: Sub-orbital dominance, orbital acceleration
Sub-orbital flights generated 76.80% of 2025 revenue because single-day itineraries and lower risk profiles attract a broader traveler base. The segment benefits from frequent launches by New Shepard and SpaceShipTwo and from the rapid turnaround of reusable stages. Orbital missions, while accounting for a small share today, will grow at 35.4% CAGR as Crew Dragon rides, Chinese capsule variants, and Japanese reusable systems lower seat cost and extend stay durations. The space tourism market size for orbital trips is expected to surge, highlighting the shift toward multi-day, research-rich experiences. Demand elasticity, however, remains tied to insurance costs and regulatory clarity on in-orbit medical standards.
Passenger demographics show a pivot to aspirational adventure seekers once ticket prices fall below the psychological USD 250,000 threshold. The space tourism market will see bundled offers that mix astronaut training, edge-of-space photography, and orbital entertainment content to maximize perceived value. This packaged approach alleviates sub-orbital revenue concentration risk and diversifies operator income streams. Microgravity research add-ons for corporates and universities further boost load factors and stabilize flight manifests.


By End-User: Commercial HNWI lead, ultra-HNWIs surge
Commercial HNWIs and corporations contributed 85.30% of 2025 demand, underscoring the buying power of individuals whose net worth exceeds USD 5 million. Ultra-HNWIs, however, will post a 40.1% CAGR, motivated by bespoke lunar fly-bys and private ISS stays that offer exclusivity. Axiom Space sells multi-week orbital packages that combine lab time and personal exploration, hinting at a future where research and leisure blend. The space tourism market size for ultra-HNWIs is forecast to triple by 2031, supported by concierge services and personalized training.
Corporate clients expand beyond prestige branding into product testing and in-orbit marketing stunts, spurring demand for branded modules and experiential content. Insurance portability and tax deductibility of space-based R and D expenses further widen the corporate share of the space tourism market. Marketing agencies now place signed contracts for weightless product debuts, adding resilience to flight-manifest pipelines.
By Vehicle Type: Reusable rockets rule, balloons rise
Reusable rockets and spaceplanes hold 62.60% revenue today because they reach microgravity in minutes and already conform to emerging safety codes. The long service life of engines and airframes amplifies the cost advantage, making rockets the baseline technology for premium orbital itineraries. High-altitude balloons post the fastest 44.2% CAGR because they operate under aviation rather than spaceflight regulations in many jurisdictions, streamlining certification.
Modular cabin architecture and panoramic windows redefine customer experience while keeping capsule mass low. Material cost volatility for composites and specialty alloys prompted balloon developers to adopt local supply chains and in-house fabrication, enabling tighter control over ticket pricing. As a result, the space tourism market share for balloon vehicles could reach double digits by 2031 without diluting overall profitability.
By Destination: Edge-of-space leads, lunar ambitions accelerate
Edge-of-space trips command 53.90% revenue thanks to frequent launch opportunities and low infrastructural demands. The space tourism market size for edge-of-space experiences is growing on the back of balloon and sub-orbital demand. These short missions provide panoramic views, several minutes of microgravity, and a tangible astronaut-like experience that resonates on social media.
Lunar fly-by missions post a 51.8% CAGR because vehicle reliability improves and mission economics benefit from declining propellant costs. Hilton’s Starlab and Axiom’s LEO stations enable pre-lunar acclimatization, adding cruise-like itineraries that mix LEO lodging with cislunar sightseeing. Operators position lunar packages as once-in-a-lifetime adventure holidays that integrate medical screenings, specialized suits, and post-flight recovery programs. Such high-touch services reinforce the ultra-luxury profile while keeping volume manageable during the early adoption phase.
Geography Analysis
North America generated 60.70% of 2025 sales as SpaceX, Blue Origin, and Virgin Galactic launched the bulk of tourist missions. An established insurance market, clear-cut indemnification rules, and sustained public-private R and D support create a stable operating environment. Policy updates that fold the Commercial Space Launch Competitiveness Act into FAA rules clarify passenger-safety responsibilities and streamline permitting, reinforcing the region’s lead.
Asia-Pacific will outpace all regions with a 22.1% CAGR through 2031. China’s reusable rocket advances and livestream ticketing, Japan’s goal of doubling its space economy by 2030 through sizeable government grants, and India’s first commercial crewed mission combine to broaden supply and demand. Regional alliances, such as the Maldives’ spaceport plan and Thailand’s dual participation in US and Chinese lunar programs, offer new infrastructure nodes that lower logistics costs. These developments enrich the space tourism market’s geographic diversification and foster cross-border itinerary options.
Europe invests heavily in green propulsion and composite-rich launch vehicles, but slower private-capital mobilization limits launch cadence. Hydrogen-powered upper stages and reusable winged boosters remain focal points for research funding. The EU positions sustainability credentials as a differentiator, expecting regulators to tighten emission thresholds that could steer global customer preference toward low-carbon operators. This stance influences the competitive posture of the space tourism market by importing ESG frameworks into flight purchasing decisions.

Competitive Landscape
The space tourism market shows moderate concentration because the top three operators dominate operational history, brand recognition, and vehicle readiness. SpaceX pioneers vertical integration, using in-house engines, avionics, and ground infrastructure to compress launch costs. Blue Origin diversifies into orbital stations and balloon ventures, while Virgin Galactic focuses on spaceplanes for rapid-turnaround sub-orbital excursions.
Strategic partnerships proliferate. Hilton co-designs hospitality modules for Starlab, offering familiar customer-service layers inside orbital hotels. Axiom collaborates with national space agencies to host mixed astronaut-tourist crews, ensuring science payloads subsidize tourism overheads. Patent activity in electric pump-fed engines and green propellants rose 9% in 2025, signaling competitive emphasis on sustainability. Asian disruptors rely on livestream sales and modular vehicle platforms to cut go-to-market time, adding pressure on incumbents to match price agility.
White-space potential lies in branded in-orbit events, luxury orbital fine dining, and regional spaceports catering to short-notice charters. The Maldives spaceport concept aims to bundle terrestrial resort stays with stratospheric balloon launches, blending hospitality and aerospace into a single itinerary. AI-driven operational analytics underpin fleet scheduling and predictive maintenance, turning data management into an additional competitive lever.
Space Tourism Industry Leaders
-
Blue Origin, LLC
-
Virgin Galactic Holdings, Inc.
-
SpaceX, Inc.
-
Axiom Space, Inc.
-
Space Adventures, Inc.
- *Disclaimer: Major Players sorted in no particular order

Recent Industry Developments
- May 2025: Virgin Galactic announced a USD 567 million cash position and targeted 2026 service entry for its Delta-class spacecraft while evaluating an Italian spaceport expansion.
- April 2025: Titans Space secured a USD 25 billion valuation driven by UHNWI and astronaut investors.
- October 2024: Deep Blue Aerospace confirmed sales of two sub-orbital tickets for 2027 at 1.5 million yuan each.
- August 2024: Blue Origin’s NS-26 mission carried six tourists, including the youngest woman to reach space.


Research Methodology Framework and Report Scope
Market Definitions and Key Coverage
Our study defines the space tourism market as revenue earned from selling sub-orbital, orbital, and lunar-fly-by seats to private individuals or organizations for leisure, prestige promotion, or micro-gravity experiments. Flights operated by reusable rockets, winged spaceplanes, or high-altitude balloons are counted when the vehicle crosses the 80 km atmospheric boundary that the US FAA recognizes as space.
Scope Exclusion: We exclude government-only astronaut missions, cargo resupply launches, and merchandising linked to spaceflight memorabilia.
Segmentation Overview
-
By Type
- Sub-orbital
- Orbital
- Beyond-Earth (Cislunar/Lunar fly-by)
-
By End-User
- Commercial (HNWIs and Corporates)
- Government Payload Specialists
- Research and Academia
-
By Vehicle Type
- Reusable Rocket / Rocket-plane
- Spaceplane
- High-Altitude Balloon
-
By Destination
- Edge-of-Space
- Low-Earth-Orbit / ISS
- Private Orbital Station / Hotel
- Lunar Fly-by / Surface
-
By Geography
-
North America
- United States
- Canada
- Mexico
-
South America
- Brazil
- Argentina
- Rest of South America
-
Europe
- United Kingdom
- Germany
- France
- Italy
- Spain
- Nordics
- Rest of Europe
-
Middle East and Africa
-
Middle East
- Saudi Arabia
- United Arab Emirates
- Turkey
- Rest of Middle East
-
Africa
- South Africa
- Egypt
- Nigeria
- Rest of Africa
-
Middle East
-
Asia-Pacific
- China
- India
- Japan
- South Korea
- ASEAN
- Australia
- New Zealand
- Rest of Asia-Pacific
-
North America
Detailed Research Methodology and Data Validation
Primary Research
Our team interviewed launch executives, former astronauts, space-insurance underwriters, luxury travel agents, and regulators across North America, Europe, and Asia. Their insights let us validate seat capacity, willingness-to-pay ranges, and realistic flight cadence before we freeze the numbers.
Desk Research
We build the baseline with publicly available launch statistics from the FAA Commercial Space Launch database, NASA manifests, and the UN launch registry, then layer macro inputs taken from the Space Foundation's Space Report, Credit Suisse Global Wealth Databook, and World Bank tourism spending. Proprietary reads from D&B Hoovers and Dow Jones Factiva help us verify company pipelines and funding health.
We also use parliamentary hearing transcripts, patent filings, and national export ledgers to follow ticket-price shifts and vehicle certification progress; these signals let Mordor analysts anticipate regulatory bottlenecks.
The sources listed here are illustrative only, and many additional open datasets aid data collection, validation, and clarification.
Market-Sizing & Forecasting
We begin with a top-down pool of global high-net-worth individuals, multiply it by surveyed intent rates, apply an average ticket price that declines with projected launch costs, and then cross-check results through selective bottom-up totals from announced vehicle capacity, ticket deposits, and supplier roll-ups. Key variables include sub-orbital seat counts, orbital station availability, FAA licensing milestones, ticket price elasticity, and regional HNWI growth. Forecasts combine multivariate regression with ARIMA to capture cyclical wealth effects and regulatory lags, and gap handling follows sensitivity bands agreed with interviewees.
Data Validation & Update Cycle
We run outputs through variance screens against independent indicators, after which senior reviewers sign off. Reports refresh each year, and we issue interim updates whenever a serious accident, price reset, or policy change materially alters the baseline.
Why Mordor's Space Tourism Baseline Commands Reliability
We find published estimates diverge because firms pick different customer pools, ticket assumptions, and update schedules. By restricting scope to confirmed passenger seats and refreshing every twelve months, Mordor keeps its baseline tightly aligned with verifiable launch and demand metrics.
Key gap drivers include rivals counting government astronauts, using list prices instead of realized tickets, or projecting flight cadences beyond licensed capacity.
Benchmark comparison
| Market Size | Anonymized source | Primary gap driver |
|---|---|---|
| USD 1.26 B (2025) | Mordor Intelligence | |
| USD 1.09 B (2024) | Global Consultancy A | Extends 2024 value forward using a uniform 45 % CAGR without seat-capacity checks |
| USD 1.58 B (2025) | Industry Association B | Adds government astronaut revenue and applies list prices |
| USD 1.36 B (2025) | Trade Journal C | Builds outlook on manufacturer delivery targets rather than licensed launches |
Together, the comparison shows that Mordor's transparent seat-based model, anchored to clear variables and repeatable steps, delivers a balanced, dependable baseline for decision-makers.


Key Questions Answered in the Report
What is the current size of the space tourism market?
The market reached USD 1.47 billion in 2026 and is forecast to hit USD 3.15 billion by 2031.
Which segment grows fastest within the space tourism industry?
Orbital tourism registers the quickest 35.4% CAGR as reusable capsules drive down multi-day mission costs.
How quickly are ticket prices falling?
Sub-orbital seat prices declined from USD 450,000 in 2024 to projected ranges of USD 200,000–300,000 by 2030 as launch costs drop.
Which region will see the strongest growth?
Balloons represent the fastest 44.2% CAGR segment due to simplified certification and lower ticket prices near USD 140,000.
What are the main risks facing operators?
Safety incidents, regulatory uncertainty, and carbon-emission scrutiny could trim market CAGR by a combined 7.8 percentage points if left unaddressed.
Page last updated on:


