Market Overview
| Study Period | 2021 - 2031 |
|---|---|
| Market Size (2026) | USD 58.99 Billion |
| Market Size (2031) | USD 100.52 Billion |
| Growth Rate (2026 - 2031) | 11.26% CAGR |
| Fastest Growing Market | Middle East and Africa |
| Largest Market | Asia Pacific |
| Market Concentration | Medium |
Major Players *Disclaimer: Major Players sorted in no particular order Image © Mordor Intelligence. Reuse requires attribution under CC BY 4.0. | |
Ridesharing Market Analysis by Mordor Intelligence
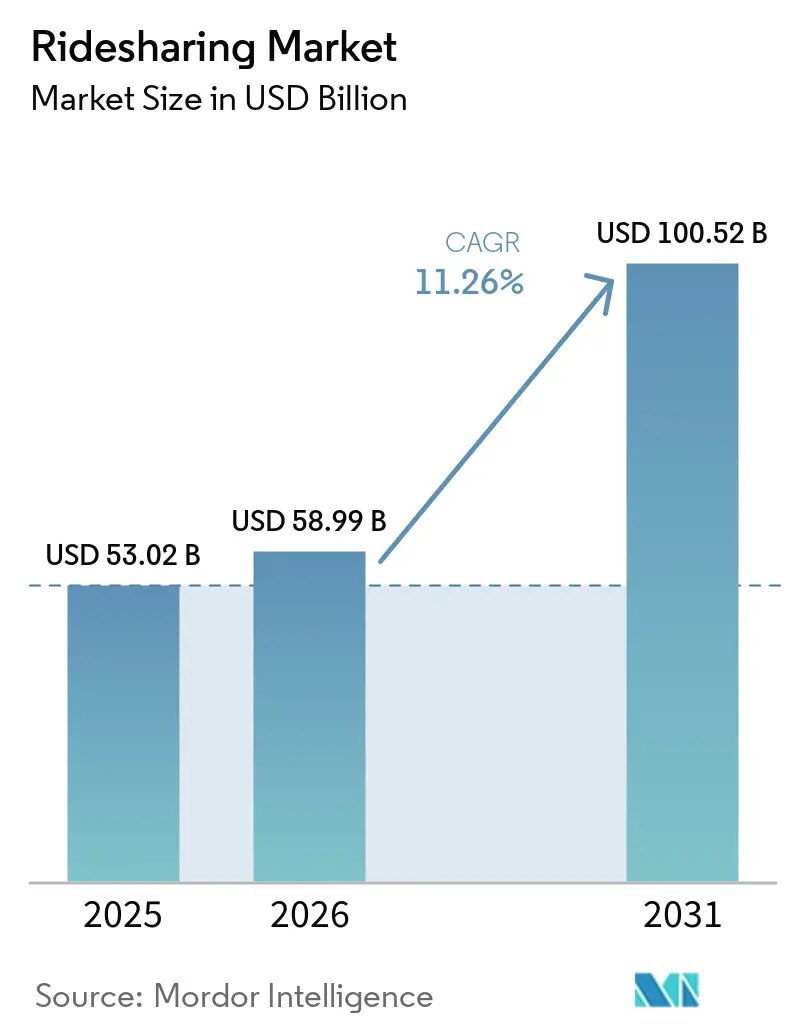
The ridesharing market size is expected to grow from USD 53.02 billion in 2025 to USD 58.99 billion in 2026 and is forecast to reach USD 100.52 billion by 2031 at 11.26% CAGR over 2026-2031. Rising smartphone adoption, the spread of 5G, corporate sustainability mandates, and supportive policy measures such as congestion pricing are reinforcing demand. Platform-led electrification of driver fleets is lowering per-mile economics while super-apps bundle scooters, bikes, and transit tickets to lift user retention. Fragmented but consolidating competitive dynamics favour operators that secure autonomous-vehicle partnerships and enterprise contracts. Regulatory clarity on worker classification and data localization will remain a decisive growth moderator as platforms scale across borders.[1]U.S. Government Accountability Office, “Ridesharing and Taxi Safety: Information on Background Checks and Safety Features,” gao.gov
Key Report Takeaways
- By membership type, dynamic ridesharing held 45.62% of the global ridesharing market share in 2025, while the corporate segment is advancing at an 17.85% CAGR through 2031.
- By service type, app-based platforms controlled 71.84% revenue in 2025; web and app-based hybrids are forecast to expand at an 15.05% CAGR to 2031.
- By vehicle type, internal-combustion cars accounted for 64.52% of the global ridesharing market size in 2025, but electric fleets are projected to grow at a 24.10% CAGR.
- By trip distance, intracity rides captured 56.45% of the 2025 value, whereas intercity services are set to rise at a 17.55% CAGR.
- By payment mode, digital wallets processed 60.62% of 2025 transactions and are growing at a 19.25% CAGR.
- By geography, Asia-Pacific commanded 37.48% revenue in 2025, while Africa is the fastest-growing region at 16.55% CAGR.
Note: Market size and forecast figures in this report are generated using Mordor Intelligence’s proprietary estimation framework, updated with the latest available data and insights as of 2026.
Global Ridesharing Market Trends and Insights
Drivers Impact Analysis*
| Driver | (~) % Impact on CAGR Forecast | Geographic Relevance | Impact Timeline |
|---|---|---|---|
| Rise of multi-modal "super-apps" integrating micro-mobility | +2.10% | Global, with early adoption in APAC and Europe | Medium term (2-4 years) |
| Growing corporate sustainability mandates for Scope-3 emission cuts | +1.80% | North America and EU, expanding to APAC | Long term (≥ 4 years) |
| Urban congestion pricing and curbside policy reforms | +1.50% | Major metropolitan areas globally | Medium term (2-4 years) |
| High smartphone and 5G penetration in emerging economies | +2.30% | APAC core, spill-over to MEA and Latin America | Short term (≤ 2 years) |
| Surge in gig-economy workforce participation | +1.70% | Global, with concentration in urban centers | Short term (≤ 2 years) |
| EV-specific incentives lowering per-mile operating cost | +2.00% | North America, EU, China, with expansion to other markets | Long term (≥ 4 years) |
| Source: Mordor Intelligence | |||
Rise of Super-Apps Integrating Micromobility
Platforms are widening their service mix to include scooters and bikes within the same interface, creating network effects that cut customer-acquisition costs and lengthen lifetime value. Lyft’s app users can now rent scooters and Citi Bikes, completing 45 million rides across 35,000 bikes in 2024.[3]Lyft, “Citi Bike and Scooter Integration Metrics,” lyft.com Cities such as San Francisco have rolled out unified permits that let one operator serve multiple modes, simplifying compliance. The shift boosts trip frequency, especially for journeys under two miles, where cars are less efficient. Because users stay inside a single app, cross-selling rates on higher-margin car trips improve. The strategy also buffers operators against regulatory shocks in any one segment.
Growing Corporate Sustainability Mandates
Enterprises are embedding ridesharing into Scope-3 emission plans, replacing taxis and rental cars with pooled trips that cut per-employee carbon footprints. Large U.S. banks and tech firms now reimburse only shared rides for airport transfers, creating predictable weekday demand spikes. Dedicated business dashboards offer carbon tracking, automated billing, and policy controls, positioning corporate ridesharing well for double-digit expansion over the forecast period. Steady enterprise volumes cushion seasonality, improve driver earnings, and raise platform valuation multiples.
Urban Congestion Pricing and Curbside Reform
New York’s USD 15 congestion fee for Manhattan cars tilts the cost equation toward shared trips that spread the charge across several riders. Similar schemes under evaluation in London and Singapore will make private car ownership less attractive. Cities are also converting parking spots into pick-up zones, cutting curbside dwell time by 30%. As waiting costs fall, platform service reliability improves, lifting market penetration in central business districts.
High Smartphone and 5G Penetration in Emerging Economies
Smartphone ownership in India and Nigeria passed 70% in 2024, and 5G roll-outs deliver latency below 10 milliseconds. Low-cost data plans support real-time location sharing, fraud detection, and instant digital payments. DiDi’s international gross transaction value grew more than 30% for four straight quarters on the back of emerging-market adoption. Enhanced connectivity also enables safety features such as live video within the driver app, reducing incident rates.
Restraints Impact Analysis*
| Restraint | (~) % Impact on CAGR Forecast | Geographic Relevance | Impact Timeline |
|---|---|---|---|
| Increasing regulatory caps on driver supply and surge pricing | -1.90% | North America, EU, with expansion to other developed markets | Medium term (2-4 years) |
| Fragmented payment standards and data-privacy mandates | -1.40% | Global, with varying intensity by region | Long term (≥ 4 years) |
| Safety-related brand perception issues | -1.60% | Global, with heightened sensitivity in developed markets | Short term (≤ 2 years) |
| Intensifying labor-rights litigation impacting unit economics | -2.10% | North America, EU, with potential spread to other markets | Long term (≥ 4 years) |
| Source: Mordor Intelligence | |||
Increasing Regulatory Caps on Drivers and Surge Pricing
Minimum-wage ordinances in U.S. cities are pushing platforms to trim driver pools or raise fares. Minneapolis mandated USD 15 per driver hour in 2024, triggering temporary ride suspensions by leading platforms while they recalibrated pricing models. Restrictions on surge multipliers dampen supply elasticity during peak demand, elongating wait times and eroding user satisfaction.
Safety-Related Brand Perception Issues
The U.S. GAO logged almost 10,000 assault allegations on leading platforms between 2017 and 2024, keeping safety in the spotlight. Negative headlines disproportionately deter women and older riders, slowing penetration in valuable cohorts. Operators are investing in in-app emergency buttons, trip-audio recording, and mandatory driver selfie verification. Although these upgrades trim incident rates, they add compliance and insurance expenses that pressure margins.
*Our forecasts treat driver/restraint impacts as directional, not additive. The impact forecasts reflect baseline growth, mix effects, and variable interactions.
Segment Analysis
By Membership Type: Corporate Segment Drives Premium Growth
Corporate customers are reshaping the global ridesharing market as firms formalize travel policies that prioritize low-carbon, pooled mobility. The corporate segment is on an 17.85% CAGR path to 2031, steadily enlarging its slice of the global ridesharing market size. Enterprise bookings often occur during business-day peaks, yielding higher per-mile yields than consumer off-peak trips. Dynamic ridesharing, still the volume leader with 45.62% of 2025 revenue, benefits from dense urban networks that match riders efficiently, but its growth rate now lags the premium corporate tier.
Large companies value end-to-end reporting of greenhouse-gas savings and automatic expensing interfaces, capabilities that consumer-focused products rarely offer. As corporate contracts typically run multi-year, churn risk is lower, allowing platforms to forecast driver hours and fleet electrification needs with greater accuracy. Competitive differentiation pivots on integrating ride-level carbon dashboards and duty-of-care features like real-time itinerary sharing with travel managers. Over the forecast period, dynamic ridesharing will keep enlarging absolute revenue given its broad addressable base, yet the share shift underscores how enterprise demand is becoming a stabilizing anchor for the global ridesharing market.


By Service Type: Integration Accelerates Multi-Channel Adoption
App-centric models continue to dominate, capturing 71.84% of 2025 turnover. The mobile interface remains unrivalled for push notifications, surge alerts, and digital-wallet convenience, anchoring user engagement in the global ridesharing market. Nonetheless, hybrid web-plus-app services are expanding fastest at 15.05% CAGR because corporate travel desks and accessibility regulations require browser-based booking.
Integrated channels broaden reach to non-smartphone users and offer redundancy when cellular data is spotty. Customer-service AI embedded in apps cut resolution times by 87% for Lyft, freeing agents for complex cases. Web portals, meanwhile, allow batch booking for events and conferences, a capability mobile apps lack. As omnichannel access becomes table stakes, platforms that streamline code bases across devices will curb maintenance costs and speed feature deployment, reinforcing brand preference in the global ridesharing market.
By Vehicle Type: Electric Transition Reshapes Fleet Economics
Internal-combustion cars still held 64.52% of rides in 2025, but fleets are tilting rapidly toward battery electric models, propelling a 24.10% CAGR for the segment. EVs already deliver more than half of all annual kilometres on DiDi’s network, underlining their suitability for high-utilization scenarios. Lower fuel and maintenance outlays translate into a 20% cost advantage per mile, allowing operators to share savings with drivers via higher net earnings.
Municipal incentives such as New York’s Green Rides rebates accelerate adoption further. Hybrids act as a bridge where charging is sparse, but direct EV migration is favoured in dense metros with fast-charger buildouts. As the global ridesharing market size expands, electric drivetrain dominance will climb, aided by falling battery prices and stricter low-emission zones that penalize gasoline cars.
By Trip Distance: Intercity Expansion Unlocks Growth
Intracity rides retained 56.45% of 2025 receipts, a reflection of urban commuting patterns that underpin the global ridesharing market. Intercity trips, however, are scaling at 17.55% CAGR as platforms extend coverage to secondary corridors. BlaBlaCar’s EUR 253 million revenue on 80 million bookings substantiates profitability for long-haul carpooling.
Longer trips yield ticket sizes multiple times urban averages, improving driver economics and platform take rates. They also diversify demand beyond rush hours, smoothing driver utilization curves. As highway fast-charging networks densify, EV compatibility will remove the final constraint on intercity electrified rides, locking in a new profit pool for the global ridesharing market.

By Payment Mode: Digital Wallets Dominate Transaction Flow
Digital wallets accounted for 60.62% of 2025 ridesharing fare volume as users gravitated toward frictionless, card-free checkouts. Wallet adoption is growing 19.25% annually, more than twice the pace of card payments. Boku forecasts local payment methods to command 59% of global ecommerce spend by 2028, with account-to-account rails doubling to 17% share.
For platforms, wallet rails lower chargeback risk, enable instant driver payouts, and unlock innovative incentives such as micro-cashbacks. Cash persists mainly in markets with under-banked populations but shrinks as mobile money ecosystems mature. Compliance with data-localization and KYC rules will remain a hurdle, nudging operators to partner with domestic fintechs rather than build proprietary stacks.
Geography Analysis
Asia-Pacific’s 37.48% share anchored the global ridesharing market in 2025, supported by population density, low car ownership, and policymaker support for shared mobility. DiDi’s Q1 2025 rebound, with revenue up 8.5%, affirmed post-regulation resilience in China. India followed with Ola trimming FY23 losses by 65%, achieving sustainable profitability amid surging demand. High 5G penetration and digital-wallet ubiquity enable platforms to overlay advanced safety and loyalty features, strengthening network effects across megacities and Tier-2 towns.
Africa posted the fastest trajectory, projected at 16.55% CAGR, propelled by urban migration and mobile-money ubiquity. Bolt’s commitment to invest EUR 500 million across the continent underscores the region’s strategic priority for global operators. Nairobi, Lagos, and Johannesburg are early beneficiaries, with young demographics fostering rapid uptake. Nonetheless, inconsistent road infrastructure and electricity reliability pose operational challenges that platforms address through localized driver-support hubs and offline booking kiosks.
North America and Europe display mature yet incremental growth driven by technological upgrades and corporate programs. Uber’s tie-up with Waymo began offering 250,000 weekly autonomous rides in Atlanta and Austin, a milestone that trims driver-cost overheads. The EU’s Platform Worker Directive, effective December 2026, will standardize benefits, elevating compliance barriers for smaller apps. Consolidation is intensifying, exemplified by Lyft’s purchase of FREENOW that enlarged its European reach to nine markets. Regulatory certainty plus high disposable incomes underpins sustained, if moderate, volume expansion in both regions, keeping them pivotal revenue pools within the global ridesharing market.


Competitive Landscape
Competition is moderately concentrated, with the top five operators controlling roughly 55% of global bookings, signalling room for regional challengers and specialized niches. Strategic acquisitions and alliances around autonomous driving and super-app ecosystems dominate the playbook. Lyft’s EUR 175 million takeover of FREENOW gives it a licensed taxi supply in continental Europe and boosts multi-modal depth. Uber’s marketplace model now hosts fleets from Waymo, Cruise, and WeRide, allowing category breadth without heavy capital outlay on proprietary self-driving systems.
Technology differentiation centers on AI-based dispatch, fraud detection, and customer-support chatbots that cap human-agent costs. Blockchain-enabled peer-to-peer platforms such as CRUIZ aim to bypass intermediaries, but regulatory uncertainty and scale economics remain obstacles.[4]CRUIZ, “AI-Driven Rideshare DePIN Protocol,” docs.cruiz.ai Fleet electrification partnerships with automakers, including Hyundai and Toyota, furnish early access to discounted EV supply, cushioning driver transition costs.
Regulatory compliance is emerging as a competitive moat. Large incumbents allocate sizable budgets to privacy, wage, and safety mandates, while smaller rivals struggle to match. As corporate clients prioritize ESG-aligned suppliers, operators that track and disclose ride-level emissions are capturing long-term contracts. Autonomous-ride pilots enhance brand prestige and reduce driver-related legal exposure but require billions in R&D or deep-pocket alliances, further consolidating leadership in the global ridesharing market.
Ridesharing Industry Leaders
OmniRide (Potomac and Rappahannock Transportation Commission)
Kangaride
Planète Covoiturage inc./CarpoolWorld Inc.
Via Transportation Inc.
Ridesharing.com (COVOITURAGEMONTREAL Inc.)
- *Disclaimer: Major Players sorted in no particular order


Recent Industry Developments
- July 2025: Lyft completed the acquisition of FREENOW for EUR 175 million (USD 191 million), broadening its reach to 11 countries and nearly 1,000 cities.
- June 2025: Uber and Waymo rolled out a commercial robotaxi service in Atlanta, covering 65 square miles with driverless Jaguar I-PACE units.
- April 2025: Waymo and Toyota revealed plans to integrate autonomous technology into privately owned vehicles.
- March 2025: DiDi’s autonomous division began fundraising at a USD 5 billion valuation to expand robotaxi operations across China.


Global Ridesharing Market Report Scope
A ride sharing company, also known as a ride-hailing service, matches passengers with drivers of app-taxis or e-taxis through websites and mobile apps, unlike taxis that can be hailed from a street.
The ride sharing market is defined based on the membership count and overall revenues acquired by the pure-play ride sharing companies that provide different types of services, such as fixed long-distance ridesharing, dynamic (short-distance) ridesharing, and corporate ridesharing. The market scope excludes companies like Uber, Lyft, and Grab (among others) that primarily specialize in providing ride-hailing services, as their key business objective and nature of the engagement between rider and customer is fundamentally different from that of ride-sharing vendors. Additionally, the scope does not include local and informal carpool programs that operate at a very limited scale owing to a lack of credible information on their operations. The analysis is based on the market insights captured through secondary research and the primaries. The market also covers major factors impacting the growth of the market in terms of drivers and restraints.
The ride sharing market is segmented by membership type (fixed ridesharing, dynamic ridesharing, and corporate ridesharing), by service type (web-based, app-based, and web & app-based), and by geography (North America, Europe, Asia Pacific, and the rest of the World). The market sizes and forecasts are provided in terms of value (USD) for all the above segments.
By Membership Type
| Fixed Ridesharing |
| Dynamic Ridesharing |
| Corporate Ridesharing |
By Service Type
| Web-Based |
| App-Based |
| Web and App Based |
By Geography***
| North America |
| Europe |
| Asia |
| Australia and New Zealand |
| Latin America |
| Middle East and Africa |
| By Membership Type | Fixed Ridesharing |
| Dynamic Ridesharing | |
| Corporate Ridesharing | |
| By Service Type | Web-Based |
| App-Based | |
| Web and App Based | |
| By Geography*** | North America |
| Europe | |
| Asia | |
| Australia and New Zealand | |
| Latin America | |
| Middle East and Africa |


Key Questions Answered in the Report
How big is the Global Ridesharing Market?
The Global Ridesharing Market size is expected to reach USD 58.99 billion in 2026 and grow at a CAGR of 11.26% to reach USD 100.52 billion by 2031.
What is the current Global Ridesharing Market size?
In 2026, the Global Ridesharing Market size is expected to reach USD 58.99 billion.
Who are the key players in Global Ridesharing Market?
OmniRide (Potomac and Rappahannock Transportation Commission), Kangaride, Planète Covoiturage inc./CarpoolWorld Inc., Via Transportation Inc. and Ridesharing.com (COVOITURAGEMONTREAL Inc.) are the major companies operating in the Global Ridesharing Market.
Which is the fastest growing region in Global Ridesharing Market?
Africa is estimated to grow at the highest CAGR over the forecast period (2026-2031).
Which region has the biggest share in Global Ridesharing Market?
In 2026, the Asia-Pacific accounts for the largest market share in Global Ridesharing Market.
What years does this Global Ridesharing Market cover, and what was the market size in 2025?
In 2025, the Global Ridesharing Market size was estimated at USD 53.02 billion. The report covers the Global Ridesharing Market historical market size for years: 2020, 2021, 2022, 2023, 2024 and 2025. The report also forecasts the Global Ridesharing Market size for years: 2026, 2027, 2028, 2029, 2030 and 2031.
Page last updated on:


