Middle East Feed Additives Market Size and Share
Market Overview
| Study Period | 2021 - 2031 |
|---|---|
| Forecast Data Period | 2026 - 2031 |
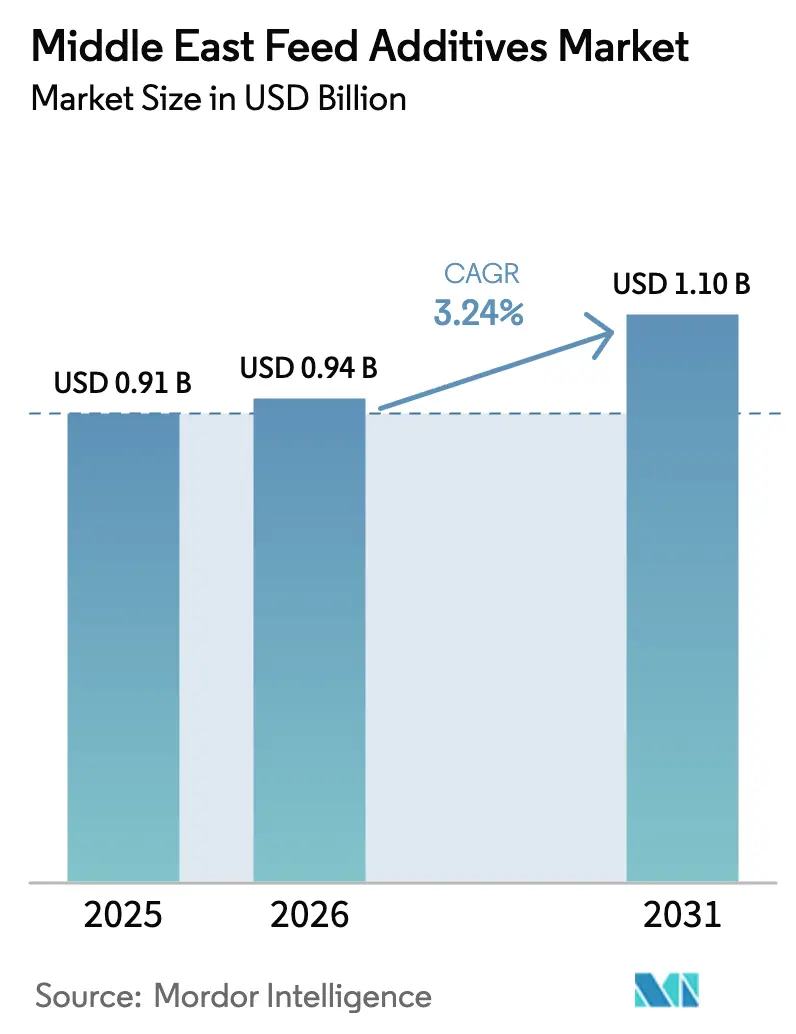
| Base Year Market Size (2025) | USD 0.91 Billion |
| Market Size (2026) | USD 0.94 Billion |
| Market Size (2031) | USD 1.10 Billion |
| Growth Rate (2026 - 2031) | 3.24% CAGR |
| Market Concentration | Low |
Major Players *Disclaimer: Major Players sorted in no particular order Image © Mordor Intelligence. Reuse requires attribution under CC BY 4.0. | |
Middle East Feed Additives Market Analysis by Mordor Intelligence
The Middle East feed additives market size is projected to expand from USD 0.91 billion in 2025 and USD 0.94 billion in 2026 to USD 1.10 billion by 2031, registering a fastest-growing 3.24% CAGR between 2026 and 2031. Sustained investment in domestic poultry complexes, a swift pivot away from antibiotic growth promoters, and persistent heat-stress conditions underpin steady additive volume growth. Saudi Arabia’s Vision 2030 and similar Gulf self-sufficiency programs continue to stimulate broiler and layer capacity expansions that require precise inclusion of amino acids, enzymes, and electrolytes. At the same time, rising mycotoxin levels in imported corn and soybean shipments are increasing demand for antioxidants and enzymatic biotransformers that protect feed quality. Parallel mariculture build-outs along the Red Sea and Persian Gulf are creating a nascent but premium segment for marine-specific pigment and amino acid blends, though volumes still trail those for poultry and ruminants.
Key Report Takeaways
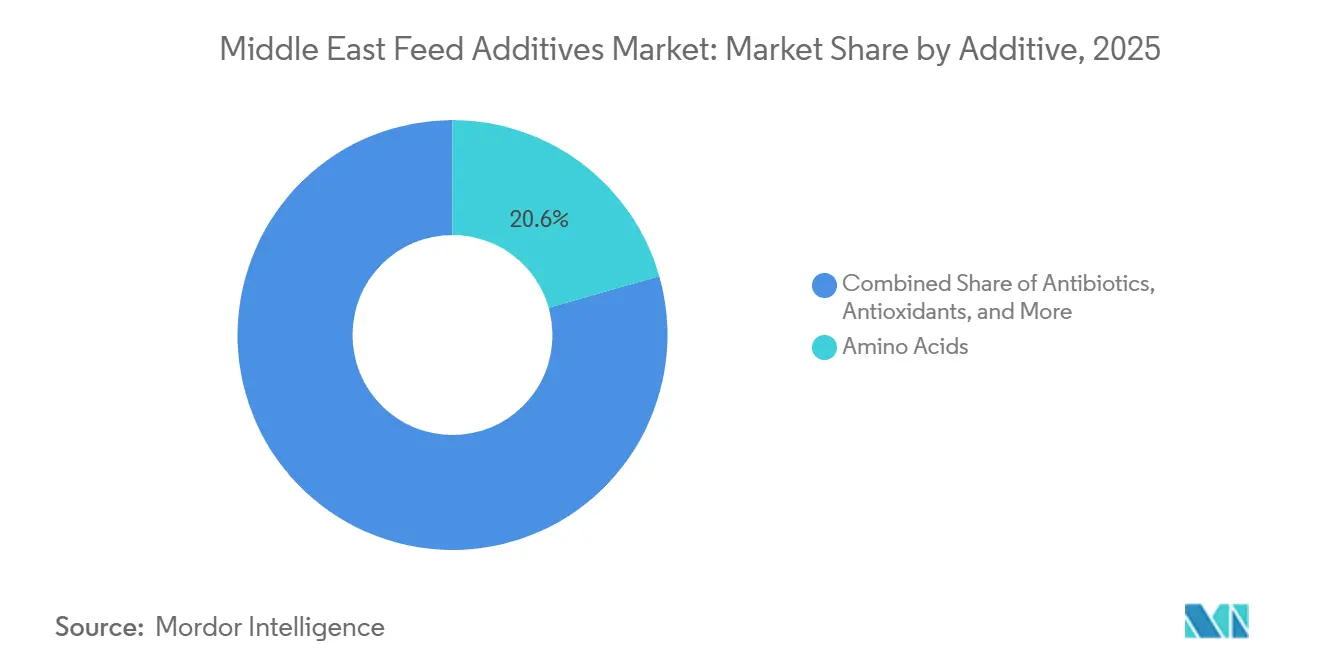
- By additive type, amino acids accounted for 20.6% of the Middle East feed additives market size in 2025, whereas antioxidants are projected to record the fastest-growing 3.6% CAGR from 2026-2031.
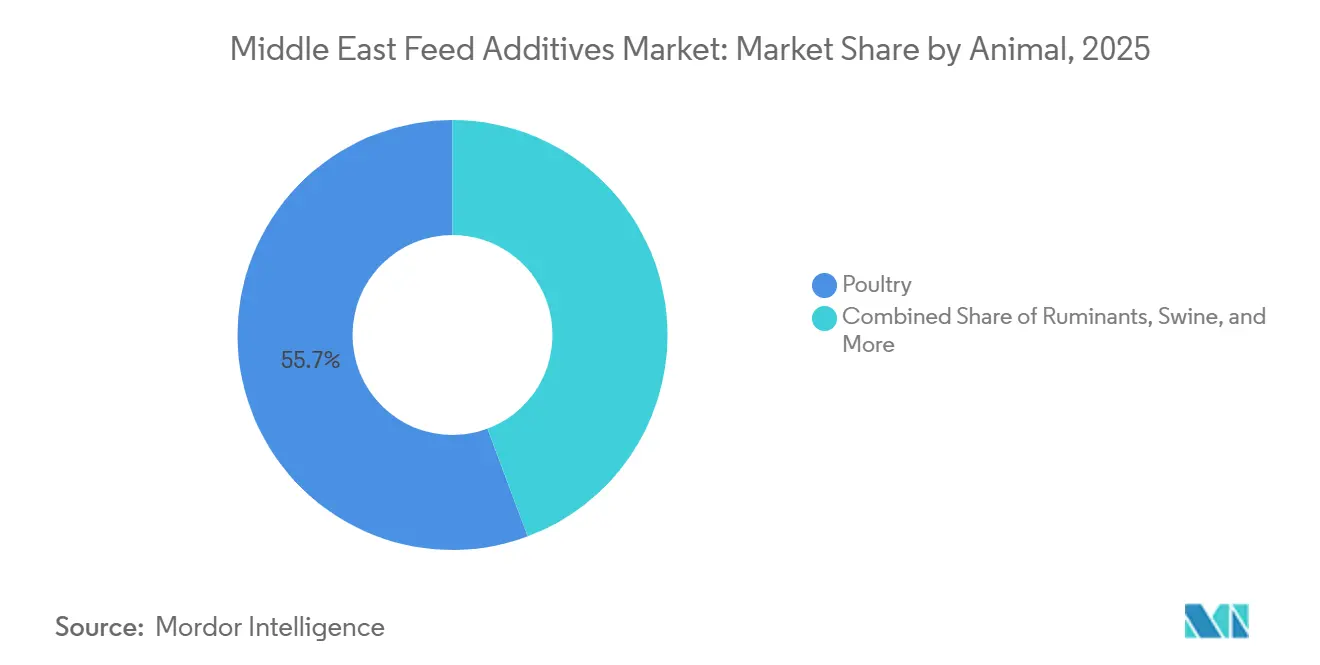
- By animal type, poultry accounted for 55.7% of the Middle East feed additives market size in 2025 and posted the fastest projected CAGR of 3.4% from 2026 to 2031.
- By geography, Saudi Arabia leads with 39.0% of the Middle East feed additives market share in 2025, while Iran is poised to expand at a 2.9% CAGR from 2026 to 2031.
Note: Market size and forecast figures in this report are generated using Mordor Intelligence’s proprietary estimation framework, updated with the latest available data and insights as of January 2026.
Middle East Feed Additives Market Trends and Insights
Drivers Impact Analysis*
| Driver | (~) % Impact on CAGR Forecast | Geographic Relevance | Impact Timeline |
|---|---|---|---|
| Poultry-sector expansion aligned with Gulf self-sufficiency roadmaps | +0.6% | Saudi Arabia, United Arab Emirates, Qatar | Medium term (2-4 years) |
| Accelerated removal of antibiotic growth promoters and shift to specialty additives | +0.5% | Saudi Arabia, United Arab Emirates, Bahrain, Kuwait | Short term (≤ 2 years) |
| Heat-stress events driving adoption of precision electrolyte and betaine blends | +0.3% | Gulf Cooperation Council countries, Iraq | Short term (≤ 2 years) |
| Rapid mariculture build-outs along the Red Sea and Persian Gulf | +0.4% | Saudi Arabia, United Arab Emirates, Oman | Long term (≥ 4 years) |
| Halal-certified phytogenics gaining traction among value-added exporters | +0.2% | Saudi Arabia, United Arab Emirates, Iran | Medium term (2-4 years) |
| Availability of green-hydrogen-based methionine cuts import dependence | +0.3% | Saudi Arabia, United Arab Emirates | Long term (≥ 4 years) |
| Source: Mordor Intelligence | |||
Poultry-Sector Expansion Aligned with Gulf Self-Sufficiency Roadmaps
Gulf governments are channeling incentives into domestic broiler and layer complexes to trim import dependence and stabilize protein prices. Alwadi Poultry Farms, for example, will commission a 90 metric tons per hour feed mill in Riyadh during the first half of 2026, where the production lines are dedicated to both poultry feed and ruminant feed[1]Source: Poultry World Staff, “Worsening Feed Supply in Iran Drives up Meat and Egg Costs,” PoultryWorld.net. Existing integrators are also retrofitting legacy mills with precision dosing equipment to tighten amino acid and enzyme formulations, raising feed conversion efficiency.
Accelerated Removal of Antibiotic Growth Promoters and Shift to Specialty Additives
Regulators in Saudi Arabia and the United Arab Emirates tightened limits on antibiotic growth promoters in 2024 and 2025, forcing nutritionists to adopt costlier yet compliant organic acids, probiotics, and phytogenics. Mycotoxin contamination in imported grain cargos worsened during the same period, intensifying the need for binders and enzymatic detoxifiers. Specialty additives are three to five times more expensive per metric ton than conventional antibiotics, straining smallholder economics.
Heat-Stress Events Driving Adoption of Precision Electrolyte and Betaine Blends
Summer temperatures above 45 °C across Gulf states depress feed intake and raise mortality in poultry and ruminants. Nutritionists now prescribe balanced blends of sodium, potassium, chloride, and bicarbonate, complemented by betaine as an osmolyte that helps maintain cell integrity under thermal stress. Peer-reviewed research in Egypt showed paprika inclusion improved egg production under heat stress, underscoring the complementary role of natural antioxidants. Demand for these formulations is structural, as climate projections indicate more frequent extreme-heat days. Suppliers able to tailor electrolyte ratios to variable water salinity gain first-mover advantage in the Middle East feed additives market.
Halal-Certified Phytogenics Gaining Traction Among Value-Added Exporters
Export-oriented poultry processors targeting Southeast Asia and North Africa insist on halal-certified inputs throughout the value chain. Essential-oil-based phytogenics derived from oregano, thyme, and garlic meet both halal and antibiotic-free positioning needs, supporting gut health through natural antimicrobial pathways. Certification audits add up to 12 weeks to commercial launch timelines, but the price premiums in destination markets justify the effort. Documented traceability therefore, becomes a decisive purchase criterion, enabling certified suppliers to grow volume and margin inside the Middle East feed additives market.
Restraints Impact Analysis*
| Restraint | (~) % Impact on CAGR Forecast | Geographic Relevance | Impact Timeline |
|---|---|---|---|
| Volatile soybean and corn cost-insurance-freight prices inflate feed costs | -0.4% | Regional, acute in Iran, Iraq, Yemen | Short term (≤ 2 years) |
| Fragmented distributor networks and smallholder late-payment cycles | -0.3% | Iran, Iraq, Yemen, Oman | Medium term (2-4 years) |
| Geopolitical shipping risks via the Bab-el-Mandeb and Strait of Hormuz | -0.3% | Regional, especially Saudi Arabia and United Arab Emirates | Short term (≤ 2 years) |
| Limited accredited laboratories for mycotoxin and residue testing slows approvals | -0.2% | Iran, Iraq, Yemen, Jordan, Lebanon | Long term (≥ 4 years) |
| Source: Mordor Intelligence | |||
Volatile Soybean and Corn Cost-Insurance-Freight Prices Inflate Feed Costs
Feed raw materials make up more than 90% of poultry feed production expenses, with soybean meal and corn dominating the bill. Red Sea shipping diversions in 2025 caused freight quotes to swing by double-digit percentages even as global spot prices eased, undercutting predictable margin planning[2]Source: The Pakistan Credit Rating Agency, “Poultry Feed,” pacra.com. Iranian mills, grappling with a significant drop in domestic maize harvests, paid premiums to secure cargoes, limiting cash for additives. Such volatility discourages long-term additive contracts because ration formulas must flex with commodity price movement. Until logistics stabilize, additive suppliers will face erratic call-off schedules in the Middle East feed additives market.
Limited Accredited Laboratories for Mycotoxin and Residue Testing Slows Approvals
Regulators in Iran, Iraq, and smaller Middle Eastern markets require accredited local labs to clear new additive formulations, yet capacity constraints can delay test results for up to 12 weeks. Importers often ship samples to Europe or Asia-Pacific for high-performance liquid chromatography and mass spectrometry analysis, which inflates costs. The delay stalls the launch of innovative binders, probiotics, and enzymes designed to mitigate rising mycotoxin loads in imported grain cargos. Without domestic analytical investment, approval queues will continue to restrain the uptake of novel products in the Middle East feed additives market.
*Our forecasts treat driver/restraint impacts as directional, not additive. The impact forecasts reflect baseline growth, mix effects, and variable interactions.
Segment Analysis
By Additive: Dominance of Amino Acids, Rapid Upside for Antioxidants
Amino acids captured 20.6% of the Middle East feed additives market in 2025, a position secured by methionine and lysine, as regional corn and soybean meal diets lack these essential nutrients. Precision supplementation can improve broiler feed conversion by up to 5%, translating directly into cost savings per kilogram of live weight. The Middle East feed additives market for amino acids is anticipated to grow as poultry production increases and formulation standards become stricter. Meanwhile, antioxidants are forecast to grow at the fastest 3.6% CAGR from 2026-2031, driven by hotter storage environments and elevated mycotoxin risk, which accelerate lipid oxidation in stored feed.
Formulators favor ethoxyquin, butylated hydroxytoluene, and natural tocopherols, yet adoption is increasingly mixed with botanical extracts to satisfy consumer expectations for natural labels. Enzymes remain an integral segment because phytases liberate non-phytate phosphorus and carbohydrases improve energy availability from high-fiber local feed grains. Vitamins, minerals, binders, pigments, acidifiers, probiotics, and yeast derivatives round out the portfolio, with each addressing species-specific gaps that vary by geography. Collectively, these categories preserve feed integrity under desert storage conditions and sustain the competitive breadth of the Middle East feed additives market.


By Animal: Poultry Leads, Aquaculture Climbs
Poultry absorbed a 55.7% share of the Middle East feed additives market in 2025 and is forecast to grow at the fastest-growing CAGR of 3.4% from 2026 to 2031 as large integrators add controlled-environment broiler houses and longer-cycle commercial layer barns. High-density amino acid and enzyme inclusion remains critical to hitting target weights within 35–42 days while maintaining low feed conversion ratios. Layer systems stretch production to 72 weeks, requiring sustained vitamin, mineral, and pigment support to protect shell strength and yolk color that resonate with Gulf consumers. Consequently, the Middle East feed additives market share tied to poultry will remain dominant through the forecast horizon.
Aquaculture is the smallest but is expanding in percentage terms, as Saudi Arabia and the United Arab Emirates scale up mariculture projects for shrimp and seabream. Marine species demand specialized pigment, omega-3, and marine-sourced amino acid blends, elevating dollar-per-ton additive spending even at lower tonnage. Swine remains negligible for cultural reasons, while camel and horse niches command premium specialty formulations that add diversity to the Middle East feed additives market.
Geography Analysis
Saudi Arabia leads the Middle East feed additives market with a 39.0% share in 2025, driven by its 2030 livestock development goals, integrated broiler production, and initiatives to expand halal-certified exports. The commissioning of new high-capacity mills and interest in green-hydrogen-based methionine present growth opportunities, despite uncertainties regarding commercial viability. Restrictions on antibiotic growth promoters are accelerating the adoption of organic acids, probiotics, and phytogenics, thereby increasing value density in feed. Alignment with Gulf Cooperation Council standards facilitates cross-border trade, reinforcing Saudi Arabia's pivotal role in the Middle East feed additives market.
Iran is anticipated to witness the fastest growth rate of 2.9% during 2026-2031, driven by domestic grain shortages and currency depreciation, which are tightening feed supply. Commercial mills are prioritizing nutrient extraction from raw materials, leading to increased adoption of enzymes and protected amino acids. While currency fluctuations pose challenges for additive imports, government support for local research and probiotic manufacturing is fostering innovation. However, the absence of accredited laboratories delays approvals for new formulations, limiting short-term market growth.
The remaining Middle Eastern countries, including the United Arab Emirates, Kuwait, Bahrain, Qatar, Oman, Iraq, Yemen, Jordan, and Lebanon, exhibit varied growth patterns influenced by factors such as political stability, capital availability, and protein consumption trends. The United Arab Emirates continues to attract foreign investment, focusing on reducing lead times and enhancing localized support. Oman and Bahrain are emphasizing aquaculture, creating opportunities for marine additives, while Iraq and Yemen face challenges such as fragmented supply chains and credit risks. Collectively, these markets contribute to diversification and incremental growth within the broader Middle East feed additives market.
Competitive Landscape
The Middle East feed additives market is projected to remain fragmented with low concentration in 2025. Key players such as DSM-Firmenich AG, Archer-Daniels-Midland Company, Cargill, Incorporated, Alltech, Inc., and Bluestar Adisseo Company maintain their market presence through established distributor networks and extensive technical teams. DSM-Firmenich AG's sale of its Animal Nutrition and Health unit to CVC Capital Partners for EUR 2.2 billion (USD 2.3 billion) in 2026 enabled the company to allocate resources to human nutrition priorities, while providing the new owner with an opportunity to expand in emerging markets[3]Source: DSM-Firmenich Press Release, “CVC Capital Partners to Acquire Animal Nutrition and Health,” dsm-firmenich.com. Multinationals are increasingly investing in local premix plants, such as DSM-Firmench AG’s 10,000 metric ton Egyptian facility, commissioned in 2024, to cut freight time and customize blends for desert climates. These moves reinforce brand presence and service responsiveness in the Middle East feed additives market.
Regional blenders specializing in halal-certified phytogenics exploit gaps left by global players whose centralized supply chains struggle with late-payment cycles. Their agile models offer shorter payment terms, smaller batch sizes, and formulations tuned to Gulf water salinity and cereal variability. Mycotoxin binders and heat-stress mitigation premixes are particularly ripe for innovation because climate and logistics elevate oxidative and fungal challenges. Competitive intensity therefore, hinges on the ability to localize production and validate efficacy through field trials rather than on brand equity alone.
Technological advancements are emerging in three key areas, with bio-based amino acid synthesis utilizing green hydrogen electrolysis, microbial fermentation platforms for producing novel probiotics, and precision nutrition software that integrates sensor data with additive dosing. Major integrators are already employing near-infrared instruments for ingredient screening and automated micro-dosing to reduce formulation variability. Smallholder mills lag due to capital constraints and fragmented distribution, but government innovation grants in Saudi Arabia and the United Arab Emirates could accelerate adoption. Overall, supplier success in the Middle East feed additives market will reflect agility, certified traceability, and on-site technical support more than global scale.
Middle East Feed Additives Industry Leaders
Cargill, Incorporated.
Archer-Daniels-Midland Company
DSM-Firmench AG
Bluestar Adisseo Company
Alltech, Inc.
- *Disclaimer: Major Players sorted in no particular order

Recent Industry Developments
- February 2025: Novonesis acquired DSM-Firmench AG’s share in Feed Enzyme Alliance for EUR 1.5 billion (USD 1.6 billion), consolidating global enzyme capacity and strengthening Middle East distribution.
- January 2025: Turkey-Iran Agricultural Cooperation Meeting outlined joint feed-industry ventures that expedite technology transfer and specialty additive adoption.
- November 2024: Phibro Animal Health completed its acquisition of Zoetis’ medicated feed additive business, expanding its portfolio of gut health and coccidiosis solutions. This move strengthens Phibro’s presence in the Middle East, supporting regional demand for advanced livestock nutrition and antibiotic alternatives.
- September 2024: DSM-Firmench AG established a premix and feed additives manufacturing facility in Egypt to serve the Middle East and African markets. The plant provides regional access to animal nutrition products, including vitamins, enzymes, and specialty additives.


Middle East Feed Additives Market Report Scope
Feed additives are substances, either nutritive or non-nutritive, added in small quantities to animal diets to improve feed quality, enhance animal performance, promote health, or mitigate environmental impact. While they do not replace core nutrition, they optimize digestion, immunity, and growth efficiency in livestock and aquaculture. The Middle East Feed Additives Market is Segmented by Additive (Acidifiers, Amino Acids, Antibiotics, Antioxidants, Binders, Enzymes, Flavors and Sweeteners, Minerals, Mycotoxin Detoxifiers, and More), by Animal (Aquaculture, Poultry, Ruminants, Swine, and Other Animals), and by Geography (Iran, Saudi Arabia, and Rest of Middle East). The Market Forecasts are Provided in Terms of Value (USD) and Volume (Metric Tons).
| Acidifiers | Fumaric Acid |
| Lactic Acid | |
| Propionic Acid | |
| Other Acidifiers | |
| Amino Acids | Lysine |
| Methionine | |
| Threonine | |
| Tryptophan | |
| Other Amino Acids | |
| Antibiotics | Bacitracin |
| Penicillins | |
| Tetracyclines | |
| Tylosin | |
| Other Antibiotics | |
| Antioxidants | Butylated Hydroxyanisole |
| Butylated Hydroxytoluene | |
| Citric Acid | |
| Ethoxyquin | |
| Propyl Gallate | |
| Tocopherols | |
| Other Antioxidants | |
| Binders | Natural Binders |
| Synthetic Binders | |
| Enzymes | Carbohydrases |
| Phytases | |
| Other Enzymes | |
| Flavors and Sweeteners | Flavors |
| Sweeteners | |
| Minerals | Macrominerals |
| Microminerals | |
| Mycotoxin Detoxifiers | Binders |
| Biotransformers | |
| Phytogenics | Essential Oil |
| Herbs and Spices | |
| Other Phytogenics | |
| Pigments | Carotenoids |
| Curcumin and Spirulina | |
| Prebiotics | Fructo Oligosaccharides |
| Galacto Oligosaccharides | |
| Inulin | |
| Lactulose | |
| Mannan Oligosaccharides | |
| Xylo Oligosaccharides | |
| Other Prebiotics | |
| Probiotics | Bifidobacteria |
| Enterococcus | |
| Lactobacilli | |
| Pediococcus | |
| Streptococcus | |
| Other Probiotics | |
| Vitamins | Vitamin A |
| Vitamin B | |
| Vitamin C | |
| Vitamin E | |
| Other Vitamins | |
| Yeast | Live Yeast |
| Selenium Yeast | |
| Spent Yeast | |
| Torula Dried Yeast | |
| Whey Yeast | |
| Yeast Derivatives |
| Aquaculture | Fish |
| Shrimp | |
| Other Aquaculture Species | |
| Poultry | Broiler |
| Layer | |
| Other Poultry Birds | |
| Ruminants | Beef Cattle |
| Dairy Cattle | |
| Other Ruminants | |
| Swine | |
| Other Animals |
| Iran |
| Saudi Arabia |
| Rest of Middle East |
| By Additive | Acidifiers | Fumaric Acid |
| Lactic Acid | ||
| Propionic Acid | ||
| Other Acidifiers | ||
| Amino Acids | Lysine | |
| Methionine | ||
| Threonine | ||
| Tryptophan | ||
| Other Amino Acids | ||
| Antibiotics | Bacitracin | |
| Penicillins | ||
| Tetracyclines | ||
| Tylosin | ||
| Other Antibiotics | ||
| Antioxidants | Butylated Hydroxyanisole | |
| Butylated Hydroxytoluene | ||
| Citric Acid | ||
| Ethoxyquin | ||
| Propyl Gallate | ||
| Tocopherols | ||
| Other Antioxidants | ||
| Binders | Natural Binders | |
| Synthetic Binders | ||
| Enzymes | Carbohydrases | |
| Phytases | ||
| Other Enzymes | ||
| Flavors and Sweeteners | Flavors | |
| Sweeteners | ||
| Minerals | Macrominerals | |
| Microminerals | ||
| Mycotoxin Detoxifiers | Binders | |
| Biotransformers | ||
| Phytogenics | Essential Oil | |
| Herbs and Spices | ||
| Other Phytogenics | ||
| Pigments | Carotenoids | |
| Curcumin and Spirulina | ||
| Prebiotics | Fructo Oligosaccharides | |
| Galacto Oligosaccharides | ||
| Inulin | ||
| Lactulose | ||
| Mannan Oligosaccharides | ||
| Xylo Oligosaccharides | ||
| Other Prebiotics | ||
| Probiotics | Bifidobacteria | |
| Enterococcus | ||
| Lactobacilli | ||
| Pediococcus | ||
| Streptococcus | ||
| Other Probiotics | ||
| Vitamins | Vitamin A | |
| Vitamin B | ||
| Vitamin C | ||
| Vitamin E | ||
| Other Vitamins | ||
| Yeast | Live Yeast | |
| Selenium Yeast | ||
| Spent Yeast | ||
| Torula Dried Yeast | ||
| Whey Yeast | ||
| Yeast Derivatives | ||
| By Animal | Aquaculture | Fish |
| Shrimp | ||
| Other Aquaculture Species | ||
| Poultry | Broiler | |
| Layer | ||
| Other Poultry Birds | ||
| Ruminants | Beef Cattle | |
| Dairy Cattle | ||
| Other Ruminants | ||
| Swine | ||
| Other Animals | ||
| By Geography | Iran | |
| Saudi Arabia | ||
| Rest of Middle East | ||


Market Definition
- FUNCTIONS - For the study, feed additives are considered to be commercially manufactured products that are used to enhance characteristics such as weight gain, feed conversion ratio, and feed intake when fed in appropriate proportions.
- RESELLERS - Companies engaged in reselling feed additives without value addition have been excluded from the market scope, to avoid double counting.
- END CONSUMERS - Compound feed manufacturers are considered to be end-consumers in the market studied. The scope excludes farmers buying feed additives to be used directly as supplements or premixes.
- INTERNAL COMPANY CONSUMPTION - Companies engaged in the production of compound feed as well as the manufacturing of feed additives are part of the study. However, while estimating the market sizes, the internal consumption of feed additives by such companies has been excluded.
| Keyword | Definition |
|---|---|
| Feed additives | Feed additives are products used in animal nutrition for purposes of improving the quality of feed and the quality of food from animal origin, or to improve the animals’ performance and health. |
| Probiotics | Probiotics are microorganisms introduced into the body for their beneficial qualities. (It maintains or restores beneficial bacteria to the gut). |
| Antibiotics | Antibiotic is a drug that is specifically used to inhibit the growth of bacteria. |
| Prebiotics | A non-digestible food ingredient that promotes the growth of beneficial microorganisms in the intestines. |
| Antioxidants | Antioxidants are compounds that inhibit oxidation, a chemical reaction that produces free radicals. |
| Phytogenics | Phytogenics are a group of natural and non-antibiotic growth promoters derived from herbs, spices, essential oils, and oleoresins. |
| Vitamins | Vitamins are organic compounds, which are required for normal growth and maintenance of the body. |
| Metabolism | A chemical process that occurs within a living organism in order to maintain life. |
| Amino acids | Amino acids are the building blocks of proteins and play an important role in metabolic pathways. |
| Enzymes | Enzyme is a substance that acts as a catalyst to bring about a specific biochemical reaction. |
| Anti-microbial resistance | The ability of a microorganism to resist the effects of an antimicrobial agent. |
| Anti-microbial | Destroying or inhibiting the growth of microorganisms. |
| Osmotic balance | It is a process of maintaining salt and water balance across membranes within the body's fluids. |
| Bacteriocin | Bacteriocins are the toxins produced by bacteria to inhibit the growth of similar or closely related bacterial strains. |
| Biohydrogenation | It is a process that occurs in the rumen of an animal in which bacteria convert unsaturated fatty acids (USFA) to saturated fatty acids (SFA). |
| Oxidative rancidity | It is a reaction of fatty acids with oxygen, which generally causes unpleasant odors in animals. To prevent these, antioxidants were added. |
| Mycotoxicosis | Any condition or disease caused by fungal toxins, mainly due to contamination of animal feed with mycotoxins. |
| Mycotoxins | Mycotoxins are toxin compounds that are naturally produced by certain types of molds (fungi). |
| Feed Probiotics | Microbial feed supplements positively affect gastrointestinal microbial balance. |
| Probiotic yeast | Feed yeast (single-cell fungi) and other fungi used as probiotics. |
| Feed enzymes | They are used to supplement digestive enzymes in an animal’s stomach to break down food. Enzymes also ensure that meat and egg production is improved. |
| Mycotoxin detoxifiers | They are used to prevent fungal growth and to stop any harmful mold from being absorbed in the gut and blood. |
| Feed antibiotics | They are used both for the prevention and treatment of diseases but also for rapid growth and development. |
| Feed antioxidants | They are used to protect the deterioration of other feed nutrients in the feed such as fats, vitamins, pigments, and flavoring agents, thus providing nutrient security to the animals. |
| Feed phytogenics | Phytogenics are natural substances, added to livestock feed to promote growth, aid in digestion, and act as anti-microbial agents. |
| Feed vitamins | They are used to maintain the normal physiological function and normal growth and development of animals. |
| Feed flavors and sweetners | These flavors and sweeteners help to mask tastes and odors during changes in additives or medications and make them ideal for animal diets undergoing transition. |
| Feed acidifiers | Animal feed acidifiers are organic acids incorporated into the feed for nutritional or preservative purposes. Acidifiers enhance congestion and microbiological balance in the alimentary and digestive tracts of livestock. |
| Feed minerals | Feed minerals play an important role in the regular dietary requirements of animal feed. |
| Feed binders | Feed binders are the binding agents used in the manufacture of safe animal feed products. It enhances the taste of food and prolongs the storage period of the feed. |
| Key Terms | Abbreviation |
| LSDV | Lumpy Skin Disease Virus |
| ASF | African Swine Fever |
| GPA | Growth Promoter Antibiotics |
| NSP | Non-Starch Polysaccharides |
| PUFA | Polyunsaturated Fatty Acid |
| Afs | Aflatoxins |
| AGP | Antibiotic Growth Promoters |
| FAO | The Food And Agriculture Organization of the United Nations |
| USDA | The United States Department of Agriculture |


Research Methodology
Mordor Intelligence follows a four-step methodology in all our reports.
- Step-1: IDENTIFY KEY VARIABLES: In order to build a robust forecasting methodology, the variables and factors identified in Step-1 are tested against available historical market numbers. Through an iterative process, the variables required for market forecast are set and the model is built on the basis of these variables.
- Step-2: Build a Market Model: Market-size estimations for the forecast years are in nominal terms. Inflation is not a part of the pricing, and the average selling price (ASP) is kept constant throughout the forecast period.
- Step-3: Validate and Finalize: In this important step, all market numbers, variables and analyst calls are validated through an extensive network of primary research experts from the market studied. The respondents are selected across levels and functions to generate a holistic picture of the market studied.
- Step-4: Research Outputs: Syndicated Reports, Custom Consulting Assignments, Databases & Subscription Platforms


