
Market Overview
| Study Period | 2021 - 2031 |
|---|---|
| Forecast Data Period | 2026 - 2031 |
| Historical Data Period | 2021 - 2024 |
| Market Size (2026) | USD 9.60 Billion |
| Market Size (2031) | USD 13.40 Billion |
| Growth Rate (2026 - 2031) | 6.90 % |
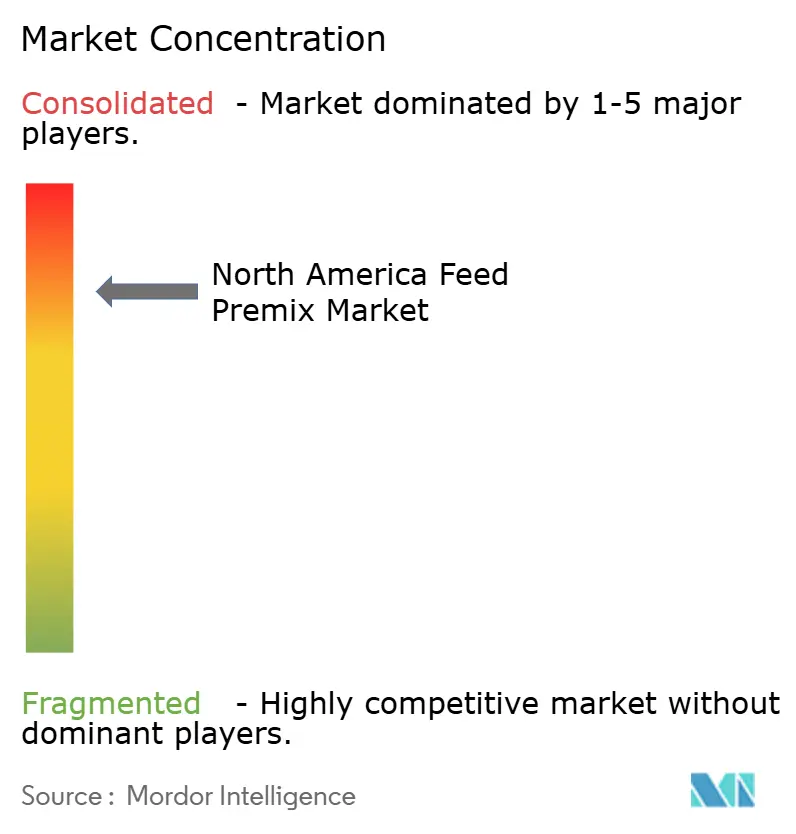
| Market Concentration | Medium |
Major Players *Disclaimer: Major Players sorted in no particular order Image © Mordor Intelligence. Reuse requires attribution under CC BY 4.0. | |
North America Feed Premix Market Analysis by Mordor Intelligence
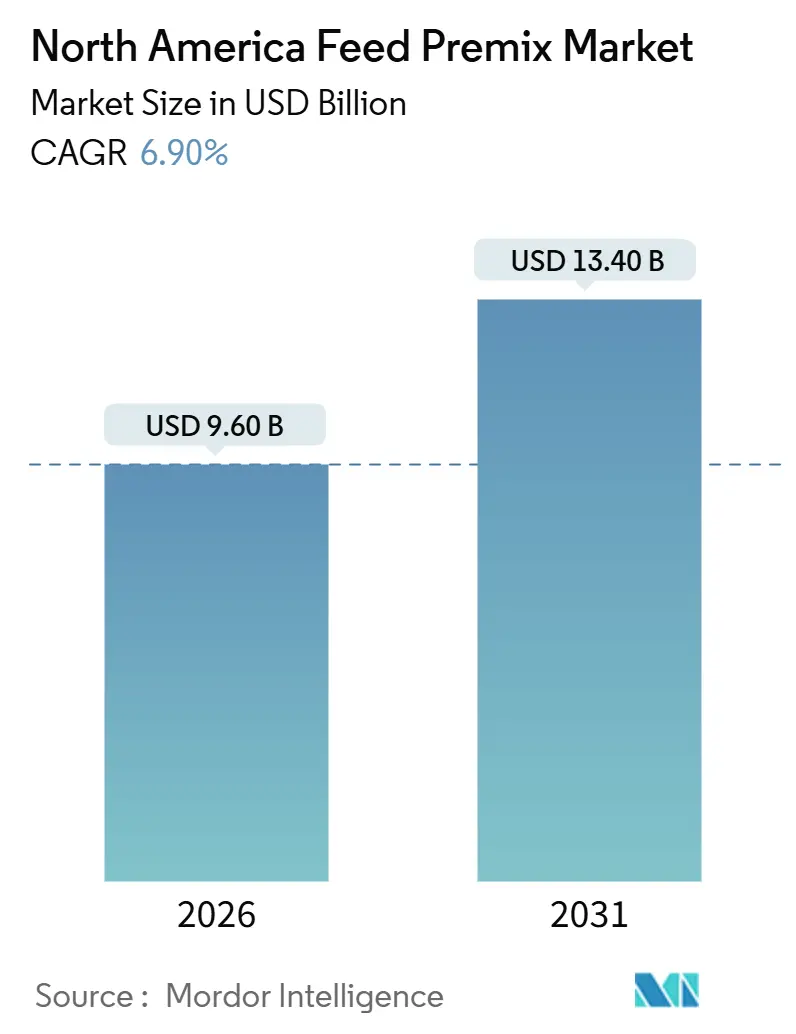
The North America Feed Premix Market size is estimated at USD 9.60 billion in 2026, and is anticipated to reach USD 13.40 billion by 2031, at a CAGR of 6.90% during the forecast period (2026-2031). The upward trajectory is anchored in precision nutrition, regulatory pressure to lower antibiotic use, and cost advantages from precision-fermentation vitamins. Suppliers are deepening relationships with large integrators that now favor just-in-time bulk deliveries, which cuts working capital and supports higher inclusion rates of value-added micro-ingredients. Shelf-stable micro-encapsulated liquids are opening up design flexibility for choline chloride and water-soluble vitamins, while upgrades in traceability, such as near-infrared spectroscopy, lower mycotoxin risk, and strengthen customer trust. Margin resilience hinges on internal vitamin synthesis, especially during raw-material price spikes, such as the 2025 surge in vitamin E, which resulted in a 320-basis-point decline in the gross margins of unhedged blenders. Pet nutrition premix lines, with gross margins of nearly 30%, widen the addressable opportunity as premium pet food sales rose 7.2% in 2025.
Key Report Takeaways
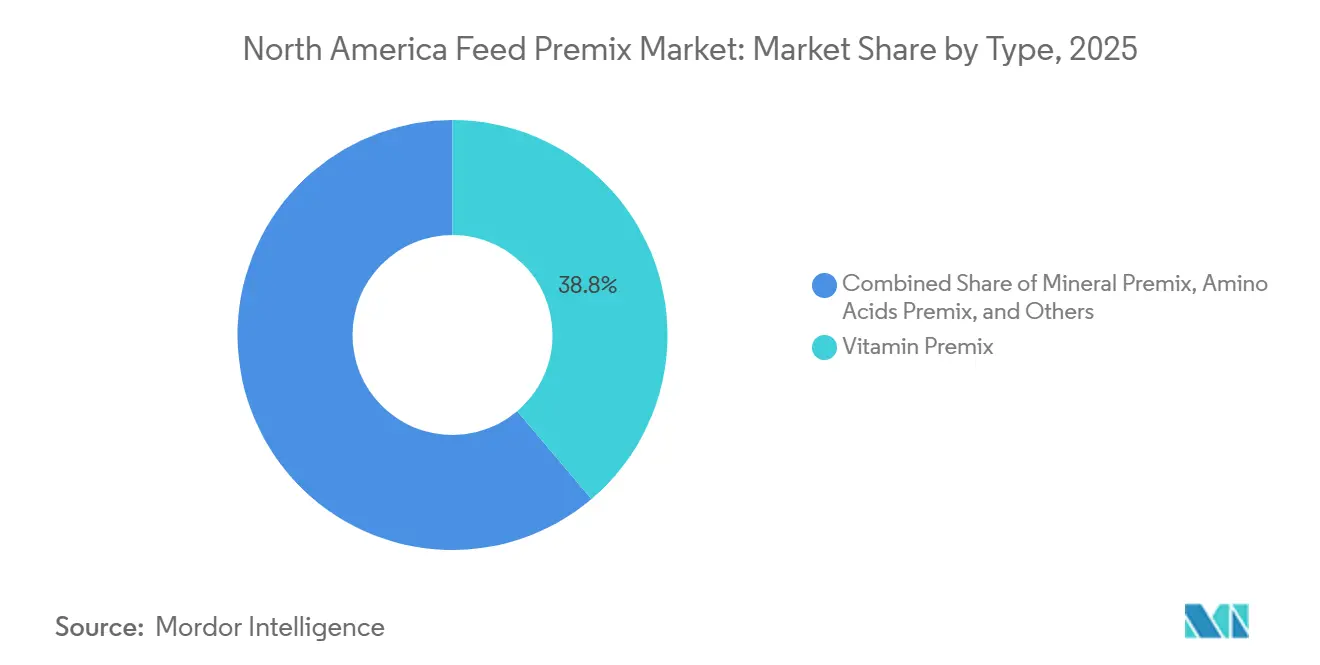
- By type, vitamin premix led with 38.8% revenue share in 2025, while nucleotide premix is projected to advance at a 12.8% CAGR through 2031.
- By form, dry premix accounted for 81.8% of the North America feed premix market in 2025, whereas liquid premix is set to record the highest 9.3% CAGR through 2031.
- By livestock, poultry operations commanded a 47.4% share of the North America feed premix market size in 2025, and aquaculture is projected to expand at an 11.0% CAGR through 2031.
- By geography, the United States held a 78.7% share in 2025. However, Mexico is poised for an 8.8% CAGR, the fastest among national markets during 2026-2031.
Note: Market size and forecast figures in this report are generated using Mordor Intelligence’s proprietary estimation framework, updated with the latest available data and insights as of January 2026.
North America Feed Premix Market Trends and Insights
Drivers Impact Analysis*
| Driver | (~) % Impact on CAGR Forecast | Geographic Relevance | Impact Timeline |
|---|---|---|---|
| Rising Demand for Compound Feed in the United States | +1.2% | United States, Canada | Medium term (2-4 years) |
| Growth in Commercial Poultry Production Capacity | +1.1% | United States, Mexico, Canada | Short term (≤ 2 years) |
| Livestock Producers’ Shift Toward Micro-Nutrient Dense Rations | +0.9% | North America-wide, strongest in U.S. Midwest and Mexico Bajío | Medium term (2-4 years) |
| Expansion of Specialty Premix Lines Tailored for Pet Nutrition | +0.8% | United States, Canada | Long term (≥ 4 years) |
| Carbon-Footprint Labeling Incentives on Feed Additives | +0.6% | United States, Canada | Long term (≥ 4 years) |
| Precision-Fermentation–Based Vitamin Cost Declines | +0.7% | North America-wide, production hubs in U.S. Illinois and North Carolina | Medium term (2-4 years) |
| Source: Mordor Intelligence | |||
Rising Demand for Compound Feed in the United States
Compound feed output reached 283 million metric tons in 2025, up 2.8% year-on-year. Each metric ton contains 5 to 15 kilograms of vitamin-mineral blends, so volume growth directly lifts premix uptake. Tyson Foods consolidated feed production into higher-capacity mills that accept 20 metric tons of bulk premix loads, cutting integrator working capital by roughly 13%[1]Source: Tyson Foods, “Springdale Feed Mill Expansion,” TysonFoods.com. Dairy herds in Wisconsin and California now incorporate chelated trace minerals into total-mixed rations to reduce lameness and improve conception, thereby increasing the use of trace-mineral premixes. Larger batch sizes enable just-in-time blending, reducing in-store inventory for mills and suppliers alike. As a result, the North America feed premix market experiences a durable pull-through, even when feed conversion efficiency improves.
Growth in Commercial Poultry Production Capacity
The poultry sector in the region added 47 million square feet of housing in 2024, marking a significant annual increase from 2023. In 2024, 9.33 billion broilers were produced, up 1% from 2023[2]Source: United States Department of Agriculture, “Poultry Production and Value 2024 Summary,” USDA.gov. Cargill Incorporated plans to establish a vitamin-blending site adjacent to a Georgia broiler complex, aiming to reduce logistics costs by 22%. Canada's poultry market operates under supply management quotas. However, producers in British Columbia and Ontario are investing in higher-density barns to enhance feed conversion ratios. This development has indirectly increased premix intensity per kilogram of live weight. Feed-conversion efficiency in the sector is projected to improve from 1.82 in 2020 to 1.68 in 2025, resulting in a 7.6% reduction in feed required per bird to reach market weight. Simultaneously, the premix inclusion rate per metric ton has increased from 0.48% to 0.53%, driven by genetic advancements that promote faster growth and require higher levels of bioavailable micro-nutrients.
Shift Toward Micro-Nutrient Dense Rations
Nutritionists replace crude protein with synthetic amino acids to lower nitrogen emissions while preserving growth rates. Zinpro’s 2025 data show that chelated zinc, copper, and manganese accounted for 34% of mineral premix revenue, rewarding suppliers of bioavailable minerals. Organic and antibiotic-free barns pay price premiums for selenium yeast and natural vitamin E, a margin tailwind for specialty blenders. Together, these formulation shifts broaden the functional scope of premix and insulate demand from simple volume metrics.
Expansion of Specialty Premix Lines for Pet Nutrition
Pet-food manufacturers are increasingly demanding premix formulations that align with human supplement trends, including omega-3 fatty acids, glucosamine, probiotics, and botanicals such as turmeric extract. According to the American Pet Products Association's 2025 survey, 42% of dog owners and 31% of cat owners purchased premium or super-premium brands containing functional ingredients, compared to 36% and 25%, respectively, in 2023. This shift in consumer preference is prompting pet-food formulators to request custom premix blends. The pet nutrition market is less price-sensitive than the livestock feed market, allowing premix suppliers to achieve gross margins of 28% to 35%, significantly higher than the 12% to 18% margins for poultry and swine blends. Smaller formulators, such as Bio-Agri Mix, are entering this market by offering co-packing services for boutique pet-food brands that lack in-house blending capabilities. This approach reduces the minimum order quantity from 10 metric tons to 500 kilograms, facilitating faster time-to-market for new product launches.
Restraints Impact Analysis*
| Restraint | (~) % Impact on CAGR Forecast | Geographic Relevance | Impact Timeline |
|---|---|---|---|
| Volatility in Vitamin A and E Raw-Material Prices | -0.8% | North America-wide, acute for smaller blenders | Short term (≤ 2 years) |
| Stringent United States FDA Premix Registration Processes | -0.6% | United States, limited impact in Canada and Mexico | Medium term (2-4 years) |
| Mycotoxin Contamination Risk in Premix Supply Chain | -0.5% | Corn Belt states, Mexico Sinaloa | Short term (≤ 2 years) |
| Competition from Single-Step Specialty Feed Additives | -0.4% | North America-wide, strongest in poultry and swine | Long term (≥ 4 years) |
| Source: Mordor Intelligence | |||
Volatility in Vitamin A and E Raw-Material Prices
Vitamin A palmitate and vitamin E acetate are synthesized using petrochemical intermediates, such as linalool and trimethylhydroquinone, which exhibit high price elasticity. In April 2024, BASF's shutdown at its citral plant in Ludwigshafen, Germany, led to an increase in the spot price of vitamin E acetate. Smaller formulators, particularly those without long-term supply contracts or hedging mechanisms, are particularly vulnerable. The concentration of vitamin production among three key suppliers, such as BASF, DSM-Firmenich, and Zhejiang Medicine, further limits buyers' negotiating power. In response, livestock producers are reformulating feed rations to lower vitamin inclusion rates. A 2025 field trial by the University of Georgia demonstrated that broilers fed 8,800 international units of vitamin A per kilogram of feed achieved the same weight gain and feed conversion efficiency as those receiving 11,000 international units, the previous industry standard. This finding suggests that historical inclusion rates included a 20% to 25% safety margin. As a result, this recalibration is estimated to reduce premix demand annually.
Stringent U.S. FDA Premix Registration Processes
The United States Food and Drug Administration's (FDA) Center for Veterinary Medicine revised its premix registration guidance in 2024, requiring stability studies under accelerated conditions (40°C, 75% relative humidity for 6 months) for formulations containing hygroscopic ingredients such as choline chloride or ferrous sulfate. Compliance costs average USD 85,000 per stock-keeping unit, while the extended review timeline has increased from 5 to 7 months before 2024 to 9 to 11 months, which delays market entry for new blends. These regulatory changes disproportionately impact mid-tier formulators that lack the financial resources to maintain extensive portfolios of pre-approved formulations. In 2024, the FDA issued three warning letters to premix manufacturers whose facilities tested positive for monensin residues in non-target species blends. Such violations can lead to product recalls and temporary facility closures.
*Our forecasts treat driver/restraint impacts as directional, not additive. The impact forecasts reflect baseline growth, mix effects, and variable interactions.
Segment Analysis
By Type: Vitamin Premix Anchors Revenue While Nucleotide Gains Momentum
The vitamin premix retained a 38.8% share of 2025 revenue, underscoring its role in meeting NRC requirements for poultry, swine, and dairy. The North America feed premix market size for vitamin-rich blends is projected to expand at a moderate rate through 2031, as precision dosing reduces wastage. Chelated mineral offerings capture substitution gains, with organic trace minerals accounting for a good amount of mineral sales by 2025. Amino-acid premix posts a significant CAGR, driven by low-protein diets that ameliorate nitrogen run-off and comply with state nutrient rules.
Nucleotide premix is racing ahead at a 12.8% CAGR, fueled by salmon and shrimp farms that seek immune support after Health Canada restricted medically important antimicrobials. Elevated inclusion levels, now 1.4 kilograms per metric ton in British Columbia salmon feed, offset volume constraints in mature vitamin segments. Fiber premix and other specialty blends grow below the market pace but still benefit from functional claims like eggshell strength improvements documented by Kemin’s turmeric-curcumin trials[3]Source: Kemin Industries, “Turmeric-Curcumin Premix Trial,” Kemin.com .



By Form: Dry Remains Dominant as Liquids Accelerate
Dry formulations accounted for an 81.8% share in 2025, due to ease of storage and a 98.7% coefficient of variation in Cargill’s Provimi line. The North America feed premix market share held by dry forms will erode modestly as liquids log a 9.3% CAGR through 2031. Micro-encapsulated choline chloride, which remains stable for 18 months, enables liquids to penetrate high-throughput mills. In-line injection increases hourly capacity to more than 40 metric tons.
Capital outlay of roughly USD 250,000 for tanks and pumps restrains smaller mills. However, at volumes above 150,000 metric tons per year, liquids deliver lower total costs by reducing dust, ingredient segregation, and batch preparation labor. Moreover, in the United States and Mexico, liquid ingredients (e.g., liquid methionine) are used in a large share of feed production due to their handling and dosing advantages, which save costs.
By Livestock: Poultry Leads, Aquaculture Surges
Poultry accounted for 47.4% of premix sales in 2025, underpinned by 9.3 billion United States broilers. Although feed-conversion ratios improved to 1.68, integrators lifted premix inclusion to 0.53% of feed as genetic potential climbed. Dairy and beef premix remains indispensable, chelated trace minerals reduced lameness by 9.3% in University of Wisconsin trials, prompting higher spend per cow.
Aquaculture represents the fastest gain, advancing at 11.0% CAGR as salmon and shrimp operators adopt nucleotide and omega-3 blends. British Columbia farms witness a decrease in antimicrobial use after Health Canada’s directive. Swine diets that deploy crystalline lysine and methionine sustain amino-acid premix demand, while pet-food manufacturers move upscale with glucosamine and probiotic inclusions that carry 28%–35% gross margins.

Geography Analysis
The United States contributed 78.7% of regional revenue in 2025, reflecting the presence of 6,200 feed mills and the largest poultry and dairy base in the North America region. Precision nutrition enables producers to reduce overall inclusion while favoring higher-value chelated minerals. Consequently, revenue growth is still projected to post a significant CAGR through 2031. FDA registration hurdles add cost and slow product refresh cycles, a drag that entrenches established suppliers.
In Canada and across the Rest of North America, the demand for high-quality meat, milk, and eggs is increasing, driven by population growth and evolving dietary preferences. This trend requires efficient, high-yield livestock production, thereby boosting the demand for high-quality, nutrient-rich feed, including premixes.
Mexico is the growth frontrunner at an 8.8% CAGR. Jalisco and Sonora welcomed eight greenfield poultry complexes, each requiring 12 to 18 metric tons of premix every month. Looser registration rules let formulators launch new variants within five months. Mycotoxin risk persists, as 6.2% of Sinaloa corn samples exceeded fumonisin limits in 2024, prompting integrators to shift toward grain produced in the United States, which in turn increases feed costs.
Regulatory Landscape
In the United States, premix and micro-ingredient suppliers operate under FDA Center for Veterinary Medicine oversight, with pre-market review pathways for animal food additives and facility-level compliance requirements under FSMA Preventive Controls for Animal Food (21 CFR Part 507), including CGMPs, hazard analysis, and risk-based preventive controls. The FDA also uses the Animal Food Ingredient Consultation (AFIC) process as an interim route to identify safety concerns for new ingredients, which can affect how quickly novel micro-ingredients move into commercial premix programs.
In Canada, the Feeds Regulations, 2024 (SOR/2024-132) modernized the framework for livestock feeds with staged compliance that concluded on December 17, 2025, introducing requirements such as licensing, preventive control plans, traceability, and packaging standards. In 2026, cross-border policy alignment signals also emerged, including USDA APHIS communication to CFIA in March 2026 indicating no scientific concerns with Canada aligning aspects of its Enhanced Feed Ban approach with the U.S. list for materials prohibited in non-ruminant feed. For premix supply chains serving both countries, this can shift ingredient movement and the compliance documentation required to support it.
Value Chain Analysis
The value chain starts with upstream synthesis and sourcing of vitamins, amino acids, minerals, and specialty bioactives, then moves into premix formulation (including stabilization, micro-dosing, and encapsulation), quality assurance (contaminant and stability testing), and delivery to feed mills and integrators for inclusion into compound feed. A key structural feature is import dependence for critical inputs, and industry assessments highlighting high reliance on China for vitamins and amino acids elevate exposure to logistics disruptions and price spikes such as the vitamin E volatility observed in the region during 2025.
Midstream value capture concentrates among large blenders and integrated suppliers that can secure long-term contracts, run just-in-time bulk deliveries, and invest in instrumentation such as near-infrared spectroscopy to manage mycotoxin and specification risk. Downstream, purchasing power sits with large poultry, swine, and dairy integrators and with premium pet-food manufacturers that request custom functional blends. The channel mix increasingly favors suppliers that can provide traceability and stability data packages for regulated ingredients, alongside flexible pack sizes via co-packing for smaller customers.
Competitive Landscape
The top five suppliers include Cargill Incorporated, DSM-Firmenich, ADM, Purina Animal Nutrition LLC (a subsidiary of Land O'Lakes Inc.), and BASF SE. Cargill Incorporated holds a major stake through 23 regional blending plants, leveraging internal amino acid and vitamin production to achieve a cost advantage. DSM-Firmenich’s precision-fermentation facility in South Dakota cut riboflavin cash cost by 19%, enabling fixed-price contracts that smaller blenders cannot match. Archer Daniels Midland leverages its corn wet-milling network to source choline chloride feedstocks at transfer prices below market, thereby supporting a share.
Margins differ sharply by channel. Pet-nutrition premix posts gross margins of 28%–35% yet commands only 8% of the value, presenting a white space for incumbents and agile newcomers. Methane-reducing blends that incorporate 3-nitrooxypropanol can unlock USD 18–27 per cow via carbon credits in California, giving early adopters a pricing advantage.
Technology adoption serves as a moat. Companies that deploy near-infrared spectroscopy and blockchain traceability win market share among integrators wary of mycotoxins. Co-packing models spearheaded by Bio-Agri Mix and NEOTERRA target boutique pet-food brands with 500-kilogram minimum runs, eroding scale advantages in certain niches while cementing long-term service contracts.
North America Feed Premix Industry Leaders
Cargill, Incorporated
BASF SE
Purina Animal Nutrition LLC (Land O' Lakes Inc.)
DSM-Firmenich AG
Archer Daniels Midland Company
- *Disclaimer: Major Players sorted in no particular order

Market Opportunities and Future Outlook
Regulatory and operational shifts are creating room for suppliers that can package compliance, traceability, and faster innovation into their premix offers. In the United States, the combination of FDA pre-market pathways for new ingredients, including the AFIC process, and facility-level FSMA preventive controls places a premium on suppliers that can provide stability studies, contamination controls, and documented quality systems, particularly for hygroscopic and residue-sensitive formulations. In Canada, the Feeds Regulations, 2024 ended staged implementation on December 17, 2025, increasing demand for licensing-ready processes, preventive control plans, and traceability tooling across the premix supply base.
Technology-led opportunities are becoming more concrete as automation and real-time nutrient monitoring move toward commercial deployment. North Carolina State University launched a March 2026 project integrating AI and advanced optical sensing for real-time feed mill nutrient monitoring, supporting service models around precision micro-dosing, formulation control, and verification, where premix suppliers already differentiate using NIR and stronger traceability. On the product side, the FDA completion of its multi-year review for DSM-Firmenichs methane-reducing ingredient Bovaer (3-NOP) for lactating dairy cattle, commercialized in the United States in 2024 via Elanco, supports higher-value functional inclusion in dairy premix programs and aligns with carbon-credit driven supplementation initiatives in markets such as California.
Recent Industry Developments
- January 2026: Land OLakes Inc. announced a capital investment to expand high-value dairy protein production at its Tulare, California, facility. The project reinforces investment around dairy nutrition value chains in the western United States, supporting adjacent demand for differentiated premix programs used in high-output dairy systems.
- October 2025: BASF SE launched Lutavit A/D3 1000/200 NXT, a next-generation vitamin formulation for animal nutrition. The launch strengthens product differentiation in vitamin premixes and supports reformulation activity among blenders navigating vitamin price volatility and tighter stability requirements.
- September 2024: Cargill Incorporated completed the acquisition of two U.S. feed mills from Compana Pet Brands in Denver, Colorado, and Kansas City, Kansas. The added milling footprint expands Cargill's production and distribution capacity, tightening integration between premix supply, feed manufacturing, and customer servicing across key livestock and pet nutrition corridors.


Research Methodology Framework and Report Scope
Market Definition and Coverage
For this methodology, the North America feed premix market is defined as the value of premix blends used to fortify animal feed with micro ingredients, which are sold in dry or liquid form across the regional feed supply chain.
Scope exclusions: This sizing excludes on-farm mixing of raw micro ingredients that is not sold as a premix product and also excludes complete feed and feed concentrates sold as finished feed.
Segmentation Overview
- By Type
- Vitamin Premix
- Mineral Premix
- Amino Acid Premix
- Nucleotide Premix
- Fiber Premix
- Others
- By Form
- Dry
- Liquid
- By Livestock
- Ruminants
- Poultry
- Swine
- Aquaculture
- Pet Animals
- Others
- By Country
- United States
- Canada
- Mexico
- Rest of North America
Data Sources, Market Sizing, and Validation
Desk Research
Desk work starts with building a clean picture of animal numbers, feed manufacturing, and trade, because these set the demand pool that premixes finally attach to. We mainly rely on public sources such as USDA (including NASS and ERS), Statistics Canada, the USITC DataWeb for trade flows, FAOSTAT for cross-checks on livestock and production series, and guidance from groups such as the American Feed Industry Association.
Once the demand picture is stable, we use company filings, investor presentations, product catalogs, and reputable press coverage to understand premix mix rates, product positioning, and price movement. Where needed, a paid subscription for company financials and a shipment-level trade database are used to confirm directionality for imports, exports, and larger supplier activity, and then those signals are compared back to the public series. The desk research sources named above are illustrative only, and other public references were also used for data collection, validation, and clarification.
Primary Interviews and Surveys
Primary work is used to pressure test mix-rate assumptions and pricing, since premix inclusion depends on livestock type, local feed practices, and regulatory acceptance. We spoke with feed mill stakeholders, premix blenders, ingredient distributors, and nutrition specialists across the United States, Canada, and Mexico, so desk assumptions could be adjusted to what is actually being purchased and used. When gaps showed up, we revisited a small set of questions with different roles so the final inputs were consistent across the value chain.
Distribution of primary research fieldwork respondents
| Company type | Respondent position |
|---|---|
| Top tier: 29% | CXOs: 19% |
| Mid tier: 52% | Functional/Unit leaders: 32% |
| Smaller Players: 19% | Managers: 49% |
Market-Sizing & Forecasting
The sizing model is built using both top-down and bottom-up logic, so the total stays tied to real feed demand while still being checked against supplier activity. The top-down build reconstructs premix demand from livestock production and feed output indicators, and then applies practical premix penetration and inclusion rates by major species and form, followed by an average price build that reflects typical formulation intensity.
To keep the math grounded, inputs are anchored on a short list of market fingerprints such as broiler and layer placements, swine and cattle inventories, commercial feed production volumes, premix inclusion rates by species, and observed price movement for key micro ingredients that influence premix pricing. Those drivers are then forecast using scenario analysis, where baseline growth is adjusted based on expected animal protein demand, feed cost cycles, and regulatory or labeling shifts that influence what can be formulated. After the top-down total is formed, we corroborate it with selective bottom-up approximations, such as sampling supplier revenue exposure to premixes and using ASP x volume checks for a few common premix types. Any gaps are handled by scaling to the confirmed demand pool rather than forcing a full supplier roll up.
Data Validation & Update Cycle
Validation is done in layers so individual assumptions do not quietly push the final number. We compare outputs against independent signals like livestock growth, feed production direction, and trade movement for relevant inputs, and then investigate variances that look out of pattern for a given country or species.
Before sign-off, the model and the written logic are reviewed in more than one analyst pass, and we re-contact sources when a key variable shifts or when an assumption is challenged by a new public data release. Reports are refreshed annually, with interim updates when material events occur, and a final pre-delivery check is completed so clients receive the latest updated view.
Mordor Intelligence's North America Feed Premix Market Market Estimate Compared With Other Published Estimates
Published numbers for North America feed premix are often not aligned because the scope of what counts as a premix, the year of sizing, and the way prices are built can vary across publishers. Differences also come from whether estimates follow a feed-demand build or lean more on broad additive spending totals.
The biggest gap drivers in this market are usually whether complete feed and concentrates are mixed into the premix definition, how vitamins and trace minerals are priced over the year (spot versus annual average), and whether livestock volume indicators are actually used to set the demand pool. In our approach, the 2026 value stays closer to feed output and species usage rates and excludes finished feed products that can inflate totals, a scope choice applied by Mordor Intelligence.
Benchmark comparison
| Source | Market Size | Gaps in Research Methodology |
|---|---|---|
| Mordor Intelligence | USD 9.60 B (2026) | |
| Regional Consultancy A | USD 31.20 B (2025) | Appears to use a wider spend bucket that can blend premixes with broader feed additive and finished feed value, and the pricing step is not clearly tied back to livestock and feed output indicators. |
| Industry Publisher B | USD 2.56 B (2024) | Likely reflects a narrower definition, such as only selected premix categories or a limited channel view, and the base year and coverage periods differ from the 2026 sizing used here. |
The spread in the table can be explained mainly by scope boundaries and how the demand pool is constructed before pricing is applied. When premixes are kept distinct from complete feed, and when livestock and feed production metrics are used as the anchor checks, the estimate becomes easier to replicate and also simpler to update each year.


Key Questions Answered in the Report
What is the current value of the North America feed premix market?
The market is valued at USD 9.6 billion in 2026 and is projected to reach USD 13.4 billion by 2031.
Which livestock segment is growing fastest in premix consumption?
Aquaculture is expanding at an 11.0% CAGR, outpacing all other livestock categories.
How dominant are dry premixes compared with liquid forms?
Dry products held 81.8% share in 2025, though liquid formats are growing faster at a 9.3% CAGR.
Why are nucleotide premixes gaining traction?
Salmon and shrimp farms adopt them to strengthen immunity and comply with antimicrobial restrictions, pushing the segment toward a 12.8% CAGR.
What is driving premix demand in Mexico?
Greenfield poultry complexes in Jalisco and Sonora and faster regulatory approvals stimulate an 8.8% CAGR in Mexican sales.
How are vitamin price swings managed by suppliers?
Leading companies integrate upstream vitamin synthesis and secure long-term contracts to buffer against raw-material volatility.
Page last updated on:


 Your data is secure and never sold or shared.


