Market Overview
| Study Period | 2018 - 2031 |
|---|---|
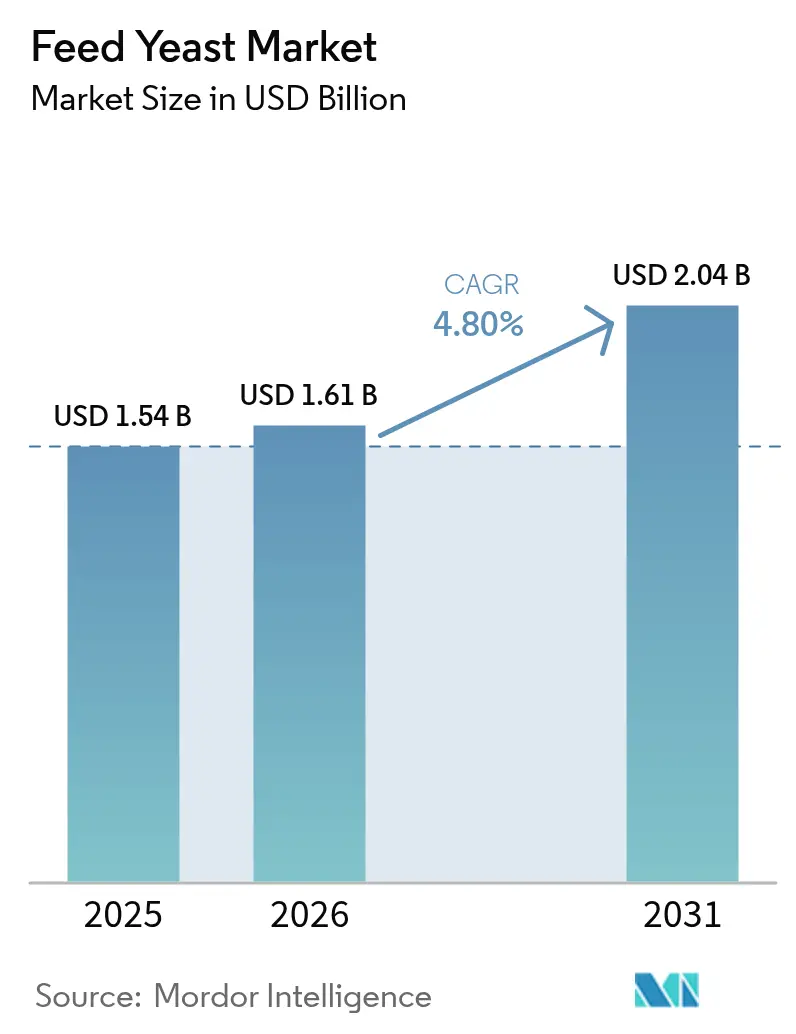
| Market Size (2026) | USD 1.61 Billion |
| Market Size (2031) | USD 2.04 Billion |
| Growth Rate (2026 - 2031) | 4.80% CAGR |
| Fastest Growing Market | Asia Pacific |
| Largest Market | Asia Pacific |
| Market Concentration | Medium |
Major Players *Disclaimer: Major Players sorted in no particular order Image © Mordor Intelligence. Reuse requires attribution under CC BY 4.0. | |
Feed Yeast Market Analysis by Mordor Intelligence
The feed yeast market size was valued at USD 1.54 billion in 2025 and estimated to grow from USD 1.61 billion in 2026 to reach USD 2.04 billion by 2031, at a CAGR of 4.80% during the forecast period (2026-2031). Momentum stems from the global phase-out of antibiotic growth promoters, the push for sustainable livestock systems, and rapid protein demand growth in Asia-Pacific. Regulatory convergence toward antibiotic-free labels, expanding carbon-credit frameworks that monetize methane reduction, and advances in co-located CO₂ fermentation jointly reinforce demand. Competitive differentiation now revolves around strain specificity, heat-stable processing, and circular-economy sourcing agreements that convert industrial emissions or dairy by-products into fermentable substrates. The growth dynamics are further amplified by carbon credit mechanisms that reward methane-reducing yeast applications, creating additional revenue streams for livestock producers implementing sustainable feeding practices.
Key Report Takeaways
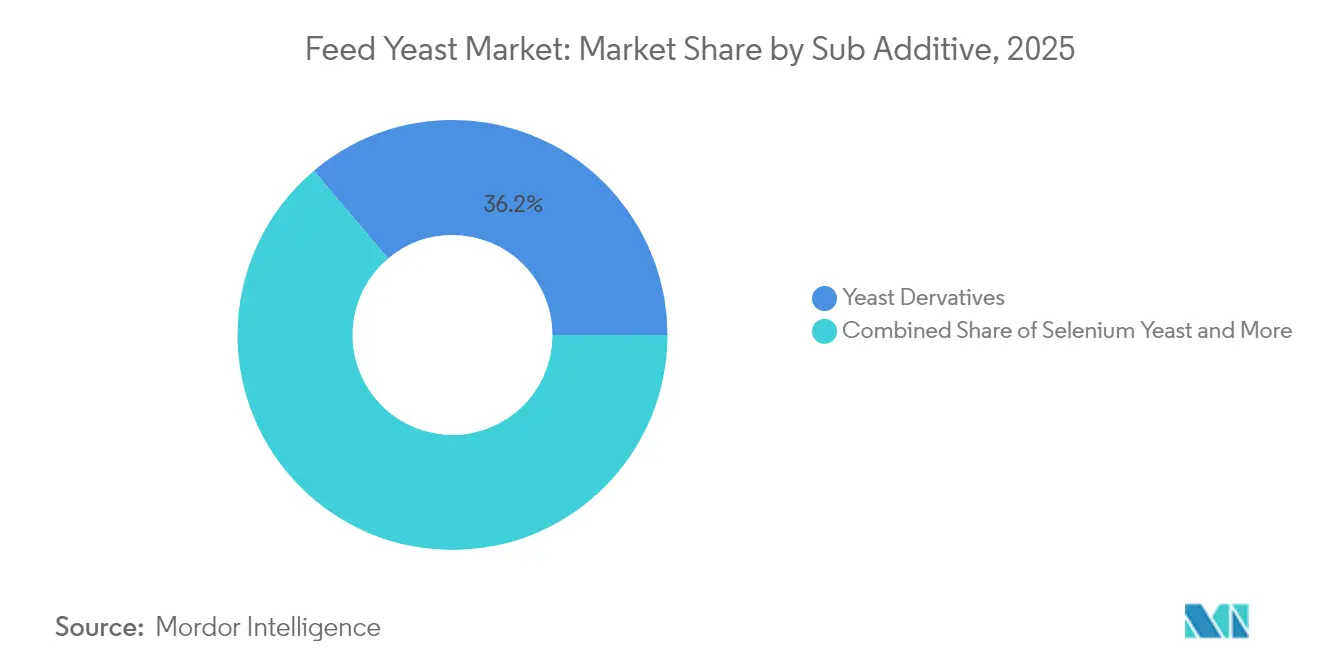
- Yeast derivatives captured 36.15% of feed yeast market share in 2025 while whey yeast is projected to expand at a 5.15% CAGR through 2031.
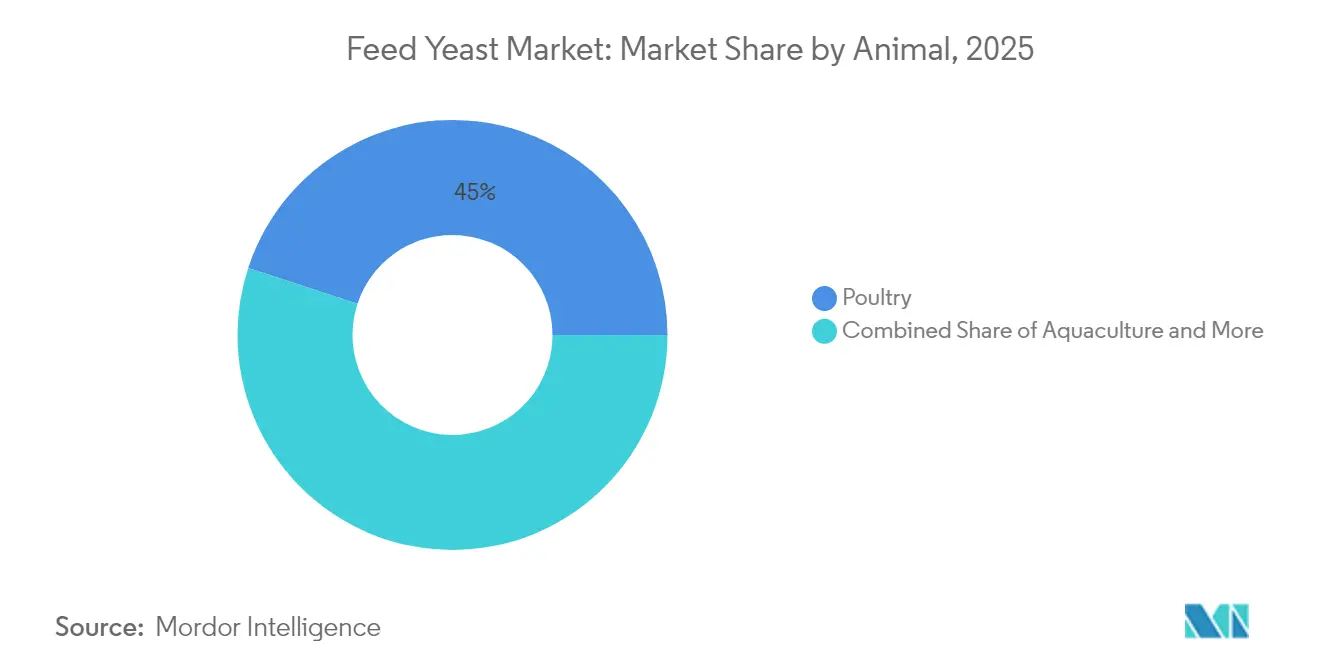
- Poultry led with 44.95% revenue share of the feed yeast market size in 2025, and advancing at a 5.04% CAGR through 2031.
- Asia-Pacific accounted for 33.10% of feed yeast market size in 2025, and forecast to post the fastest regional CAGR at 3.75% to 2031.
Note: Market size and forecast figures in this report are generated using Mordor Intelligence’s proprietary estimation framework, updated with the latest available data and insights as of 2026.
Global Feed Yeast Market Trends and Insights
Drivers Impact Analysis*
| Driver | (~) % Impact on CAGR Forecast | Geographic Relevance | Impact Timeline |
|---|---|---|---|
| Ban on antibiotic growth promoters increases probiotic-yeast demand | +1.2% | Global, with early adoption in Europe and accelerating in Asia-Pacific | Medium term (2-4 years) |
| Rising meat and aquaculture consumption in Asia-Pacific | +0.9% | Asia-Pacific core, spill-over to Middle East and Africa | Long term (≥ 4 years) |
| Immunomodulatory benefits of yeast beta-glucans | +0.7% | Global, with premium markets in North America and Europe leading | Medium term (2-4 years) |
| Carbon-credit schemes reward methane-reducing yeasts | +0.5% | Europe and North America, expanding to Australia and New Zealand | Long term (≥ 4 years) |
| Co-located fermentation using captured-CO₂ lowers yeast cost | +0.4% | Industrial regions with high CO₂ emissions, primarily China and India | Medium term (2-4 years) |
| Organic-selenium approvals boost selenium-yeast uptake | +0.3% | Europe and North America, with pending approvals in Asia-Pacific | Short term (≤ 2 years) |
| Source: Mordor Intelligence | |||
Ban on Antibiotic Growth Promoters Increases Probiotic-Yeast Demand
India's comprehensive ban on antibiotic growth promoters in livestock feed, implemented in January 2024, has catalyzed a fundamental shift toward yeast-based alternatives across the country's USD 8.2 billion animal feed industry[1]Source: National Centre for Disease Control, “Guidelines on Antimicrobial Resistance,” ncdc.mohfw.gov.in. The transition is particularly pronounced in poultry operations, where live yeast products demonstrate comparable performance to traditional antibiotics while enhancing gut health through competitive exclusion mechanisms. European feed manufacturers report 15-20% increases in yeast additive adoption rates following the implementation of stricter antibiotic guidelines, with similar patterns emerging in markets where regulatory frameworks are tightening.
Rising Meat and Aquaculture Consumption in Asia-Pacific
Vietnam's shrimp industry demonstrates this trend, with major producers reporting 25-30% improvements in survival rates when incorporating selenium yeast and beta-glucan products into feeding protocols. The Philippines' poultry sector expansion, driven by urbanization and rising incomes, has created additional demand for cost-effective yeast solutions that improve feed conversion ratios while meeting export market requirements for antibiotic-free production. Thailand's integrated livestock operations are pioneering precision nutrition approaches that optimize yeast supplementation based on animal age, environmental conditions, and production targets, establishing best practices that are being replicated across neighboring markets.
Immunomodulatory Benefits of Yeast Beta-Glucans
The mechanism operates through pattern recognition receptors that trigger innate immune responses, providing protection against bacterial and viral pathogens without the regulatory concerns associated with antibiotic alternatives. European aquaculture operations report significant reductions in mortality rates when incorporating beta-glucan-rich yeast products, with Norwegian salmon farms documenting 15% improvements in survival rates during challenging environmental conditions. The technology's application extends to ruminant nutrition, where beta-glucans support rumen health and optimize microbial populations, leading to improved feed efficiency and reduced methane emissions that align with sustainability objectives.
Carbon-Credit Schemes Reward Methane-Reducing Yeasts
Carbon credit mechanisms are creating new revenue streams for livestock producers implementing methane-reducing yeast technologies, with verified emission reductions trading at USD 15-25 per metric ton of CO₂ equivalent in established markets. The European Union's Emissions Trading System now recognizes livestock methane reduction projects, enabling dairy and beef operations to monetize environmental improvements achieved through specialized yeast supplementation[2]Source: European Commission, “EU Emissions Trading System,” ec.europa.eu. Australian livestock producers are participating in pilot programs that combine yeast supplementation with carbon credit generation, establishing precedents for broader adoption across similar agricultural systems.
Restraints Impact Analysis*
| Restraint | (~) % Impact on CAGR Forecast | Geographic Relevance | Impact Timeline |
|---|---|---|---|
| Molasses and other substrates price volatility | -0.8% | Global, with acute impact in sugar-producing regions | Short term (≤ 2 years) |
| Heat-pelleting destroys yeast viability | -0.6% | Global, affecting all pelleted feed markets | Medium term (2-4 years) |
| Emerging post-biotic bacterial alternatives | -0.4% | North America and Europe leading, expanding globally | Long term (≥ 4 years) |
| Patent concentration limits strain access | -0.3% | Global, with particular impact on emerging market producers | Medium term (2-4 years) |
| Source: Mordor Intelligence | |||
Molasses and Other Substrates Price Volatility
Substrate cost volatility represents a persistent challenge for feed yeast manufacturers, with molasses prices experiencing 35-40% fluctuations during 2024 due to drought conditions in major sugar-producing regions including Brazil and Thailand. The interconnection between sugar markets and yeast production creates exposure to agricultural commodity cycles, weather patterns, and biofuel demand that can rapidly erode profit margins for producers unable to implement effective hedging strategies. Corn steep liquor and wheat-based substrates offer diversification opportunities, but switching costs and regulatory approvals for feed-grade products create barriers to rapid substrate substitution during price spikes.
Heat-Pelleting Destroys Yeast Viability
Thermal processing requirements for pelleted animal feeds pose fundamental challenges for live yeast product viability, with temperatures exceeding 80°C during pelleting processes causing significant cell death that reduces product efficacy. Research indicates that conventional pelleting reduces viable yeast cell counts by 60-80%, necessitating higher inclusion rates or specialized protection technologies that increase overall product costs. The challenge is particularly acute in aquaculture feeds, where high-temperature extrusion processes are standard, creating market opportunities for heat-stable yeast derivatives while constraining live yeast applications.
*Our forecasts treat driver/restraint impacts as directional, not additive. The impact forecasts reflect baseline growth, mix effects, and variable interactions.
Segment Analysis
By Sub Additive: Derivatives Lead While Whey Yeast Accelerates
Yeast derivatives secured 36.15% of the feed yeast market share in 2025, thanks to core attributes that survive pelleting temperatures beyond 85 °C and deliver concentrated beta-glucans and mannan-oligosaccharides. The segment’s scale efficiencies and broad regulatory acceptance stabilize pricing and underpin its leadership within the feed yeast market. Whey yeast is projected to grow at 5.15% CAGR to 2031 as dairy processors monetize lactose streams once considered waste, lowering raw-material costs and appealing to sustainability-minded buyers.
Live yeast retains a loyal customer base in ruminant diets where viable cell activity elevates fiber digestion and supports rumen microbiota. Selenium yeast commands premium pricing in markets that recognize its superior bioavailability, buoyed by European Food Safety Authority (EFSA) approvals that streamline label claims. Spent and torula yeasts round out cost-sensitive formulations, particularly in regions where brewery or wood-processing by-products are readily available. Overall, specialized strain development and microencapsulation innovations continue to diversify the feed yeast market while defending derivative leadership positions.


By Animal: Poultry Dominance Reflects Industry Dynamics
Poultry led with 44.95% revenue share of the feed yeast market size in 2025, and advancing at a 5.04% CAGR through 2031, underpinned by broiler and layer operations that value quick gut-health returns and measurable feed-conversion savings. Yeast derivatives integrate smoothly into crumbled and pelleted starter rations, generating 8-12% efficiency gains and enhancing carcass quality benchmarks that drive processor margins.
Aquaculture trails among the largest channels, propelled by Asia-Pacific’s intensive fish and shrimp sectors. Beta-glucan and selenium-fortified yeasts help producers avoid antibiotic residues, enabling broader export eligibility. Ruminants adopt live yeast for rumen optimization and methane reduction, aligning with dairies’ carbon-credit objectives. Swine inclusion remains steady but faces substitution pressure from post-biotics in nursery diets, though yeast’s early-life immune support retains a foothold.
Geography Analysis
Asia-Pacific accounted for 33.10% of the feed yeast market size in 2025, and is forecast to post the fastest regional CAGR at 3.75% to 2031, powered by China’s aquaculture leadership and India’s antibiotic-free feed mandate. Provincial subsidies for sustainable feed ingredients and carbon-credit pilots fuel yeast uptake across poultry and carp systems. Vietnam’s shrimp complexes and Thailand’s integrator model present replicable best practices across ASEAN, sustaining a 3.75% regional CAGR to 2031.
North America leverages sophisticated ration-formulation software and established carbon markets to optimize yeast inclusion in dairy, feedlot, and growing aquaculture operations. U.S. salmon-recirculating farms and Canada’s prairie dairies rely on precision-nutrition modules that specify strain, inclusion rate, and heat-stability metrics, driving consistent reorder patterns. Mexico’s poultry complexes source cost-effective spent yeasts from domestic breweries to meet rising urban protein demand, anchoring steady volume growth.
Europe’s stringent regulatory environment and consumer sustainability expectations drive premium adoption. German dairies employ methane-reducing yeasts alongside energy-efficiency audits to generate European Union Emissions Trading System (EU ETS) credits, while French poultry processors certify antibiotic-free status using derivative yeast blends. Eastern-bloc markets embrace cost-sensitive torula and spent yeasts, increasing intra-regional trade flows. Collectively, Europe sustains technology-driven share in the global feed yeast market and pioneers traceability and eco-labeling standards.


Competitive Landscape
The feed yeast market is moderately concentrated. Alltech, DSM-Firmenich AG, and Cargill headline suppliers with vertically integrated capacity, robust strain libraries, and multi-continent distribution. Each commits double-digit R&D budgets to heat-stable formulations and methane-targeted strains.
Mid-tier innovators such as Lallemand and Angel Yeast exploit regional manufacturing proximity to customize offerings for tropical climates and CO₂-adjacent fermenters. Strategic expansion includes acquisition and plant upgrades that capture CO₂ fermentation. Cargill’s whey-yeast line evidences the pivot toward circular-economy substrates in Southeast Asia, leveraging dairy partnerships to secure lactose streams and speed local delivery.
Patent filings increasingly focus on microencapsulation and thermotolerant genetics, with more than 80 new global applications recorded since 2024[3]Source: United States Patent and Trademark Office, “Yeast Strain Patents Database,” uspto.gov. This IP arms race both protects incumbent margins and heightens entry barriers for newcomers. Nevertheless, regional players able to combine site-specific strains with cost-effective feedstock and compliance agility can still carve defensible niches.
Feed Yeast Industry Leaders
Archer Daniel Midland Co.
Cargill Inc.
Lallemand Inc.
Phibro Animal Health Corporation
DSM-Firmenich AG
- *Disclaimer: Major Players sorted in no particular order


Recent Industry Developments
- July 2025: Alltech announced a fermentation-capacity expansion in Kentucky, integrating CO₂ capture technology.
- June 2025: Cargill released a whey-based yeast line targeting Asian aquaculture operations in Thailand and Vietnam.
- June 2024: Evonik Industries secured EFSA approval for its proprietary selenium yeast for poultry and swine.


Global Feed Yeast Market Report Scope
Live Yeast, Selenium Yeast, Spent Yeast, Torula Dried Yeast, Whey Yeast, Yeast Derivatives are covered as segments by Sub Additive. Aquaculture, Poultry, Ruminants, Swine are covered as segments by Animal. Africa, Asia-Pacific, Europe, Middle East, North America, South America are covered as segments by Region.Sub Additive
| Live Yeast |
| Selenium Yeast |
| Spent Yeast |
| Torula Dried Yeast |
| Whey Yeast |
| Yeast Derivatives |
Animal
| Aquaculture | Fish |
| Shrimp | |
| Other Aquaculture Species | |
| Poultry | Broiler |
| Layer | |
| Other Poultry Birds | |
| Ruminants | Beef Cattle |
| Dairy Cattle | |
| Other Ruminants | |
| Swine | |
| Other Animals |
Region
| North America | United States |
| Canada | |
| Mexico | |
| Rest of North America | |
| South America | Brazil |
| Argentina | |
| Chile | |
| Rest of South America | |
| Europe | Germany |
| France | |
| Italy | |
| Netherlands | |
| Russia | |
| Spain | |
| Turkey | |
| United Kingdom | |
| Rest of Europe | |
| Asia-Pacific | China |
| India | |
| Japan | |
| Indonesia | |
| South Korea | |
| Thailand | |
| Vietnam | |
| Australia | |
| Philippines | |
| Rest of Asia-Pacific | |
| Middle East | Iran |
| Saudi Arabia | |
| Rest of Middle East | |
| Africa | Egypt |
| Kenya | |
| South Africa | |
| Rest of Africa |
| Sub Additive | Live Yeast | |
| Selenium Yeast | ||
| Spent Yeast | ||
| Torula Dried Yeast | ||
| Whey Yeast | ||
| Yeast Derivatives | ||
| Animal | Aquaculture | Fish |
| Shrimp | ||
| Other Aquaculture Species | ||
| Poultry | Broiler | |
| Layer | ||
| Other Poultry Birds | ||
| Ruminants | Beef Cattle | |
| Dairy Cattle | ||
| Other Ruminants | ||
| Swine | ||
| Other Animals | ||
| Region | North America | United States |
| Canada | ||
| Mexico | ||
| Rest of North America | ||
| South America | Brazil | |
| Argentina | ||
| Chile | ||
| Rest of South America | ||
| Europe | Germany | |
| France | ||
| Italy | ||
| Netherlands | ||
| Russia | ||
| Spain | ||
| Turkey | ||
| United Kingdom | ||
| Rest of Europe | ||
| Asia-Pacific | China | |
| India | ||
| Japan | ||
| Indonesia | ||
| South Korea | ||
| Thailand | ||
| Vietnam | ||
| Australia | ||
| Philippines | ||
| Rest of Asia-Pacific | ||
| Middle East | Iran | |
| Saudi Arabia | ||
| Rest of Middle East | ||
| Africa | Egypt | |
| Kenya | ||
| South Africa | ||
| Rest of Africa | ||


Market Definition
- FUNCTIONS - For the study, feed additives are considered to be commercially manufactured products that are used to enhance characteristics such as weight gain, feed conversion ratio, and feed intake when fed in appropriate proportions.
- RESELLERS - Companies engaged in reselling feed additives without value addition have been excluded from the market scope, to avoid double counting.
- END CONSUMERS - Compound feed manufacturers are considered to be end-consumers in the market studied. The scope excludes farmers buying feed additives to be used directly as supplements or premixes.
- INTERNAL COMPANY CONSUMPTION - Companies engaged in the production of compound feed as well as the manufacturing of feed additives are part of the study. However, while estimating the market sizes, the internal consumption of feed additives by such companies has been excluded.
| Keyword | Definition |
|---|---|
| Feed additives | Feed additives are products used in animal nutrition for purposes of improving the quality of feed and the quality of food from animal origin, or to improve the animals’ performance and health. |
| Probiotics | Probiotics are microorganisms introduced into the body for their beneficial qualities. (It maintains or restores beneficial bacteria to the gut). |
| Antibiotics | Antibiotic is a drug that is specifically used to inhibit the growth of bacteria. |
| Prebiotics | A non-digestible food ingredient that promotes the growth of beneficial microorganisms in the intestines. |
| Antioxidants | Antioxidants are compounds that inhibit oxidation, a chemical reaction that produces free radicals. |
| Phytogenics | Phytogenics are a group of natural and non-antibiotic growth promoters derived from herbs, spices, essential oils, and oleoresins. |
| Vitamins | Vitamins are organic compounds, which are required for normal growth and maintenance of the body. |
| Metabolism | A chemical process that occurs within a living organism in order to maintain life. |
| Amino acids | Amino acids are the building blocks of proteins and play an important role in metabolic pathways. |
| Enzymes | Enzyme is a substance that acts as a catalyst to bring about a specific biochemical reaction. |
| Anti-microbial resistance | The ability of a microorganism to resist the effects of an antimicrobial agent. |
| Anti-microbial | Destroying or inhibiting the growth of microorganisms. |
| Osmotic balance | It is a process of maintaining salt and water balance across membranes within the body's fluids. |
| Bacteriocin | Bacteriocins are the toxins produced by bacteria to inhibit the growth of similar or closely related bacterial strains. |
| Biohydrogenation | It is a process that occurs in the rumen of an animal in which bacteria convert unsaturated fatty acids (USFA) to saturated fatty acids (SFA). |
| Oxidative rancidity | It is a reaction of fatty acids with oxygen, which generally causes unpleasant odors in animals. To prevent these, antioxidants were added. |
| Mycotoxicosis | Any condition or disease caused by fungal toxins, mainly due to contamination of animal feed with mycotoxins. |
| Mycotoxins | Mycotoxins are toxin compounds that are naturally produced by certain types of molds (fungi). |
| Feed Probiotics | Microbial feed supplements positively affect gastrointestinal microbial balance. |
| Probiotic yeast | Feed yeast (single-cell fungi) and other fungi used as probiotics. |
| Feed enzymes | They are used to supplement digestive enzymes in an animal’s stomach to break down food. Enzymes also ensure that meat and egg production is improved. |
| Mycotoxin detoxifiers | They are used to prevent fungal growth and to stop any harmful mold from being absorbed in the gut and blood. |
| Feed antibiotics | They are used both for the prevention and treatment of diseases but also for rapid growth and development. |
| Feed antioxidants | They are used to protect the deterioration of other feed nutrients in the feed such as fats, vitamins, pigments, and flavoring agents, thus providing nutrient security to the animals. |
| Feed phytogenics | Phytogenics are natural substances, added to livestock feed to promote growth, aid in digestion, and act as anti-microbial agents. |
| Feed vitamins | They are used to maintain the normal physiological function and normal growth and development of animals. |
| Feed flavors and sweetners | These flavors and sweeteners help to mask tastes and odors during changes in additives or medications and make them ideal for animal diets undergoing transition. |
| Feed acidifiers | Animal feed acidifiers are organic acids incorporated into the feed for nutritional or preservative purposes. Acidifiers enhance congestion and microbiological balance in the alimentary and digestive tracts of livestock. |
| Feed minerals | Feed minerals play an important role in the regular dietary requirements of animal feed. |
| Feed binders | Feed binders are the binding agents used in the manufacture of safe animal feed products. It enhances the taste of food and prolongs the storage period of the feed. |
| Key Terms | Abbreviation |
| LSDV | Lumpy Skin Disease Virus |
| ASF | African Swine Fever |
| GPA | Growth Promoter Antibiotics |
| NSP | Non-Starch Polysaccharides |
| PUFA | Polyunsaturated Fatty Acid |
| Afs | Aflatoxins |
| AGP | Antibiotic Growth Promoters |
| FAO | The Food And Agriculture Organization of the United Nations |
| USDA | The United States Department of Agriculture |


Research Methodology
Mordor Intelligence follows a four-step methodology in all our reports.
- Step-1: IDENTIFY KEY VARIABLES: In order to build a robust forecasting methodology, the variables and factors identified in Step-1 are tested against available historical market numbers. Through an iterative process, the variables required for market forecast are set and the model is built on the basis of these variables.
- Step-2: Build a Market Model: Market-size estimations for the forecast years are in nominal terms. Inflation is not a part of the pricing, and the average selling price (ASP) is kept constant throughout the forecast period.
- Step-3: Validate and Finalize: In this important step, all market numbers, variables and analyst calls are validated through an extensive network of primary research experts from the market studied. The respondents are selected across levels and functions to generate a holistic picture of the market studied.
- Step-4: Research Outputs: Syndicated Reports, Custom Consulting Assignments, Databases & Subscription Platforms


