
U.S. Child Care Market Size and Share
Market Overview
| Study Period | 2020 - 2031 |
|---|---|
| Forecast Data Period | 2026 - 2031 |
| Base Year Market Size (2025) | USD 69.07 Billion |
| Market Size (2026) | USD 82.38 Billion |
| Market Size (2031) | USD 110.34 Billion |
| Growth Rate (2026 - 2031) | 6.02 % |
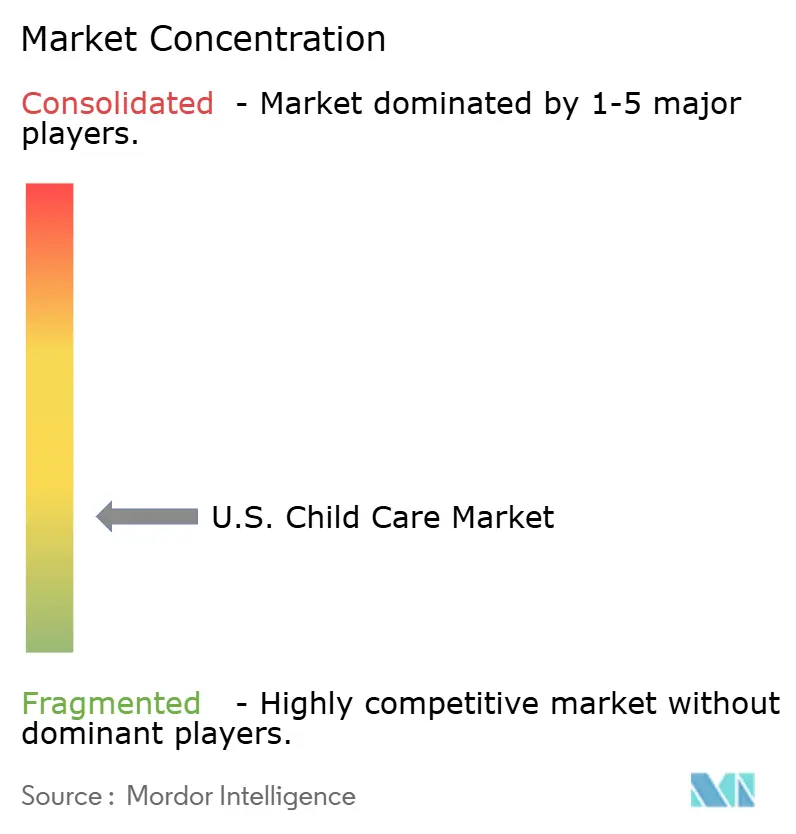
| Market Concentration | Low |
Major Players *Disclaimer: Major Players sorted in no particular order Image © Mordor Intelligence. Reuse requires attribution under CC BY 4.0. | |
U.S. Child Care Market Analysis by Mordor Intelligence
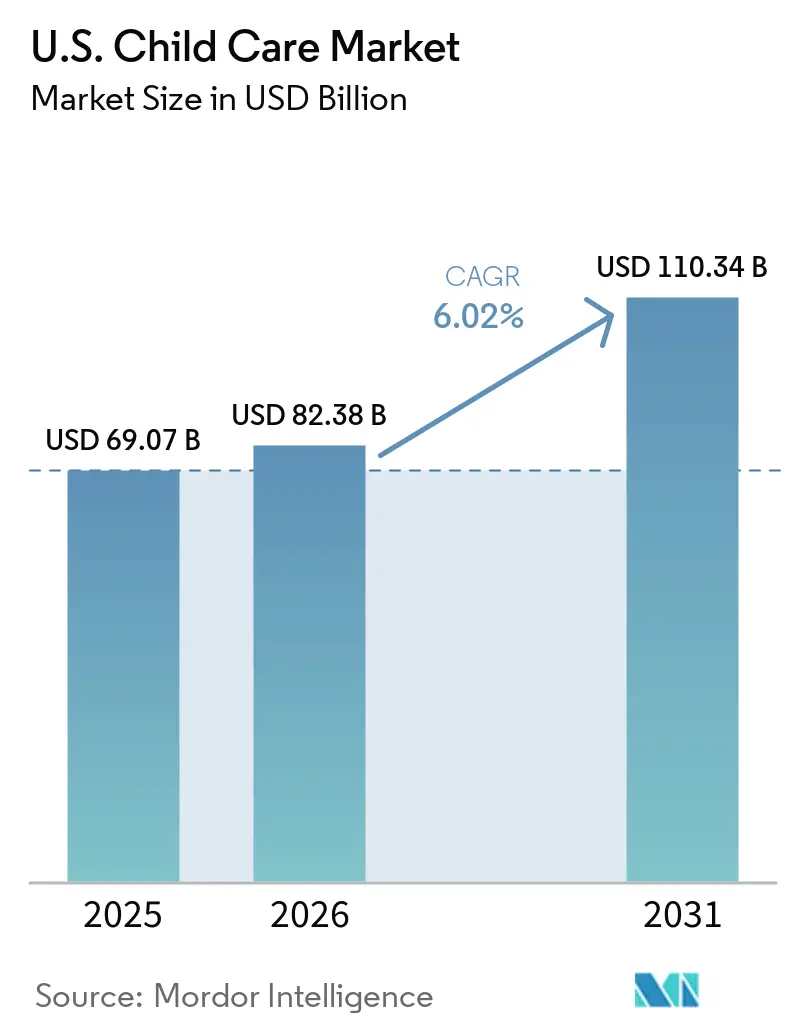
The U.S. Child Care Market size is expected to increase from USD 69.07 billion in 2025 to USD 82.38 billion in 2026 and reach USD 110.34 billion by 2031, growing at a CAGR of 6.02% over 2026-2031.
In 2024, dual-employed households in the United States spent an average of USD 12,760 on child care, accounting for 5.4% of household income. Policy support is becoming crucial, with the expanded IRC 45F employer-provided child care credit set to increase the maximum annual benefit to USD 500,000 for large employers and USD 600,000 for small businesses starting January 1, 2026.
Public funding is driving demand, with the American Relief Act of 2025 adding USD 250 million in CCDF discretionary funds, raising total federal CCDF allocations for GY2025 to USD 12.55 billion. Despite these measures, the United States child care market remains fragmented, as KinderCare and four other major providers collectively account for only 6% of licensed center capacity. Labor costs, consuming 70% to 80% of operating budgets, and profit margins below 1% limit operators' ability to expand supply.
Key Report Takeaways
- By care setting, center-based care held 65.34% revenue share in 2025, while home-based care is projected to expand at 6.55% CAGR through 2031.
- By age group, preschoolers accounted for 38.55% of revenue in 2025, while infants recorded the highest projected CAGR at 7.95% through 2031.
- By program format, full-day full-year care commanded 58.88% of revenue in 2025, while part-day and preschool programs are projected to grow at 7.86% CAGR through 2031.
- By ownership and funding model, nonprofit providers held 45.59% of revenue in 2025, while public and school-linked providers are projected to advance at 7.67% CAGR through 2031.
Note: Market size and forecast figures in this report are generated using Mordor Intelligence’s proprietary estimation framework, updated with the latest available data and insights as of January 2026.
U.S. Child Care Market Trends and Insights
Drivers Impact Analysis*
| DRIVER | (~) % IMPACT ON CAGR FORECAST | GEOGRAPHIC RELEVANCE | IMPACT TIMELINE |
|---|---|---|---|
| Rising maternal labor-force and dual-income dependency | +1.9% | National, strongest in major Northeast and Pacific Coast metro areas | Medium term (2-4 years) |
| Public subsidy expansion and mixed-delivery support | +1.6% | National, strongest in states with advanced CCDF implementation such as California, Texas, New York, and Illinois | Short term (≤ 2 years) |
| Employer-sponsored child care and backup-care adoption | +1.3% | National, concentrated in finance, healthcare, and technology hubs | Medium term (2-4 years) |
| Manufacturing and healthcare campus child care build-out | +0.9% | Southeast and Midwest industrial corridors, including semiconductor clusters | Long term (≥ 4 years) |
| Rebound of family child care for nontraditional-hour demand | +0.8% | Rural and exurban areas, especially where shift work is common | Short term (≤ 2 years) |
| Source: Mordor Intelligence | |||
Rising Maternal Labor-Force And Dual-Income Dependency
In 2025, 65% of mothers with children under age 3 participated in the labor force, maintaining strong demand for the United States child care market. Dual-employed households, 2.8 times more likely to pay for child care than single-earner households, spent an average of USD 12,760 on child care in 2024. A USD 100 quarterly increase in per-child costs reduced maternal labor-force participation by 1.1 percentage points, emphasizing the market's influence on employment decisions.[1] Providers are incentivized to collaborate with subsidy programs and employers to reduce families' financial burden.
Employer-Sponsored Child Care And Backup-Care Adoption
The expanded IRC 45F credit, effective January 2026, is driving employer-sponsored child care from a perk to a strategic financial decision. In 2025, 67% of employers prioritized family-care benefits, and 82.03% of large organizations adopted backup care.[2] Bright Horizons reported 38% of 2025 enrollment from 14 new Fortune 500 contracts, while KinderCare's employer-sponsored tuition programs contributed USD 535 million, nearly 20% of 2024 revenue. Larger operators benefit from managing national contracts and backup-care networks, unlike smaller providers.
Public Subsidy Expansion And Mixed-Delivery Support
The 2024 CCDF Final Rule capped family co-payments at 7% of income, mandated enrollment-based payments, and introduced grants for underserved areas. Before implementation, 80% of providers supported enrollment-based payments, and 73% favored prospective payments, addressing payment stability concerns. Federal CCDF allocations reached USD 12.55 billion in 2025, with an additional USD 250 million from the American Relief Act, enhancing supply and access.[3] School districts, municipalities, and nonprofits are well-positioned to leverage these changes for local capacity building.
Manufacturing And Healthcare Campus Child Care Build-Out
Onsite child care is becoming a key workforce strategy in industrial zones across the United States. Toyota Motor North America launched four centers in North Carolina, Mississippi, Alabama, and West Virginia, with a combined capacity exceeding 1,000 children and plans for NAEYC accreditation. These centers address challenges like shift schedules and long commutes, ensuring steady enrollment patterns. This model also supports supply growth in areas lacking licensed infant and toddler care and is relevant in healthcare hubs with similar workforce demands.
Restraints Impact Analysis*
| RESTRAINT | (~) % IMPACT ON CAGR FORECAST | GEOGRAPHIC RELEVANCE | IMPACT TIMELINE |
|---|---|---|---|
| Teacher shortages and wage compression | -0.9% | National, most severe in rural areas and states without compensation support | Long term (≥ 4 years) |
| Parent affordability gap and subsidy cliffs | -0.8% | National, especially acute in coastal high-cost metros and rural low-income areas | Medium term (2-4 years) |
| Occupancy, insurance, and compliance cost inflation | -0.7% | National, strongest in urban commercial real estate markets | Medium term (2-4 years) |
| CCDF payment-rule rollback volatility | -0.5% | National, with higher exposure in subsidy-dependent states using waiver extensions | Short term (≤ 2 years) |
| Source: Mordor Intelligence | |||
Teacher Shortages And Wage Compression
Teacher availability remains the primary challenge in the United States child care market. In 2024, early childhood educators earned a median wage of USD 16.01 per hour, USD 8.59 less than comparable professions. They were 7.7 times more likely to live in poverty than K-12 teachers, leading to retention issues. Annual turnover rates ranged from 15% to 46%, with each turnover costing programs nearly USD 7,000. Labor costs, accounting for 70% to 80% of operating budgets, and profit margins below 1% make wage increases difficult, perpetuating staffing shortages despite parental demand.
Parent Affordability Gap And Subsidy Cliffs
High costs hinder participation in the United States child care market, even for families needing care to stay employed. In 2024, 23.9% of households with children under 13 paid an average of USD 10,520 annually, representing 5.6% of household income. For households below the federal poverty level, child care consumed 13.3% of income, far exceeding the 7% affordability benchmark. Work losses averaged 65.8 days per household, rising to 114.6 days for poverty-level families. In Massachusetts, center-based care costs increased 14% to 26% from 2022 to 2024, driven by higher staff compensation and facility costs, making subsidy design critical for converting demand into enrollment.
*Our forecasts treat driver/restraint impacts as directional, not additive. The impact forecasts reflect baseline growth, mix effects, and variable interactions.
Segment Analysis
By Care Setting: Center-Based Scale Leads While Home-Based Care Meets Flexible-Hour Need
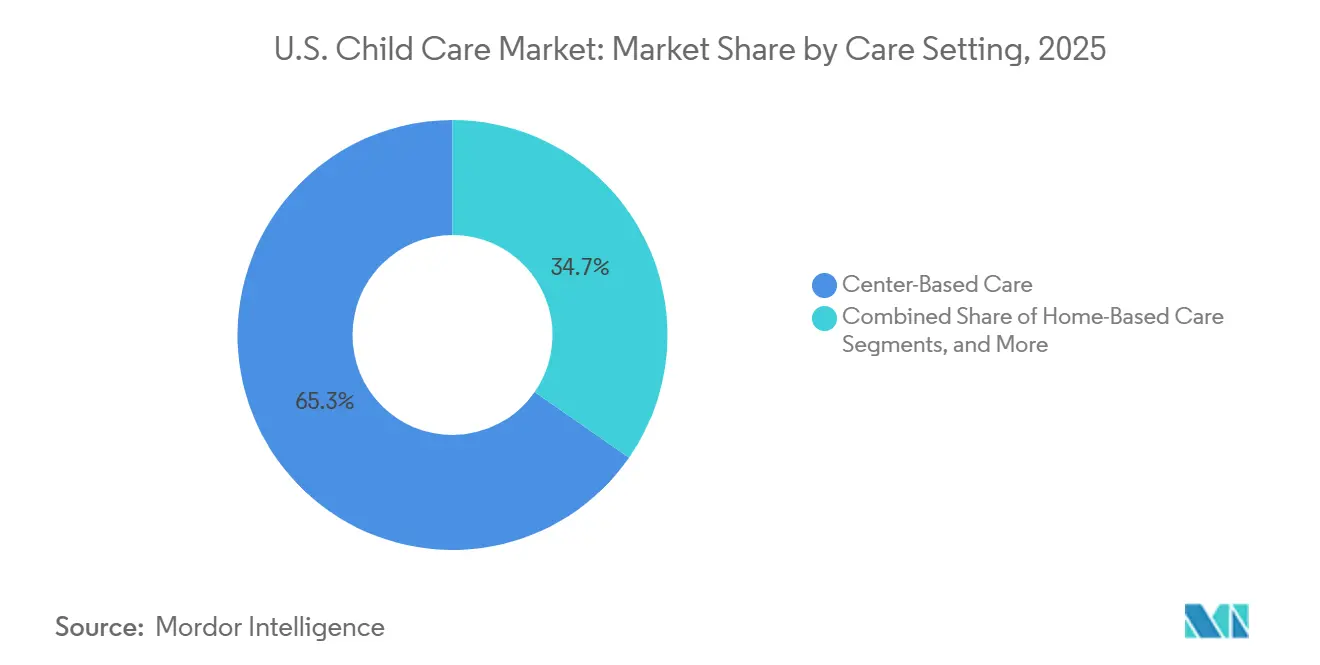
In 2025, Center-Based Care accounted for 65.34% of the United States child care market share, maintaining its position as the leading revenue-generating care setting. This reflects parental preference for licensed, curriculum-based environments, particularly in urban and suburban areas. Licensed child care centers increased by 1.3% from 2022 to 2023 across 41 states, with larger facilities expanding capacity by 18% between 2005 and 2017, influencing current supply dynamics.
Home-Based Care is the fastest-growing segment of the United States child care market, with a projected 6.55% CAGR through 2031. Its growth addresses scheduling gaps, as 40% of children in care require coverage outside standard hours, including early mornings, evenings, and weekends.

By Age Group: Infant Capacity Shortage Keeps the Highest-Pressure Growth Pool in Focus
Infants are the fastest-growing age group in the United States child care market, with a projected 7.95% CAGR from 2026 to 2031. A significant supply gap persists, with three infants for every licensed care slot in 80% of counties across 19 states and the District of Columbia. Licensed infant slots in Cook County dropped 8% since 2019, and quality centers in metro areas report waitlists of 12 to 18 months.
Preschoolers accounted for 38.55% of revenue in 2025, making them the largest revenue-generating age group in the United States child care market. This is driven by school-readiness demand and state-funded pre-K programs. However, public pre-K expansion shifts 4-year-olds from family child care homes, impacting revenue mixes for operators managing higher-cost infant and toddler care.
By Program Format: Full-Day Programs Hold the Base While Wraparound Models Gain Pace
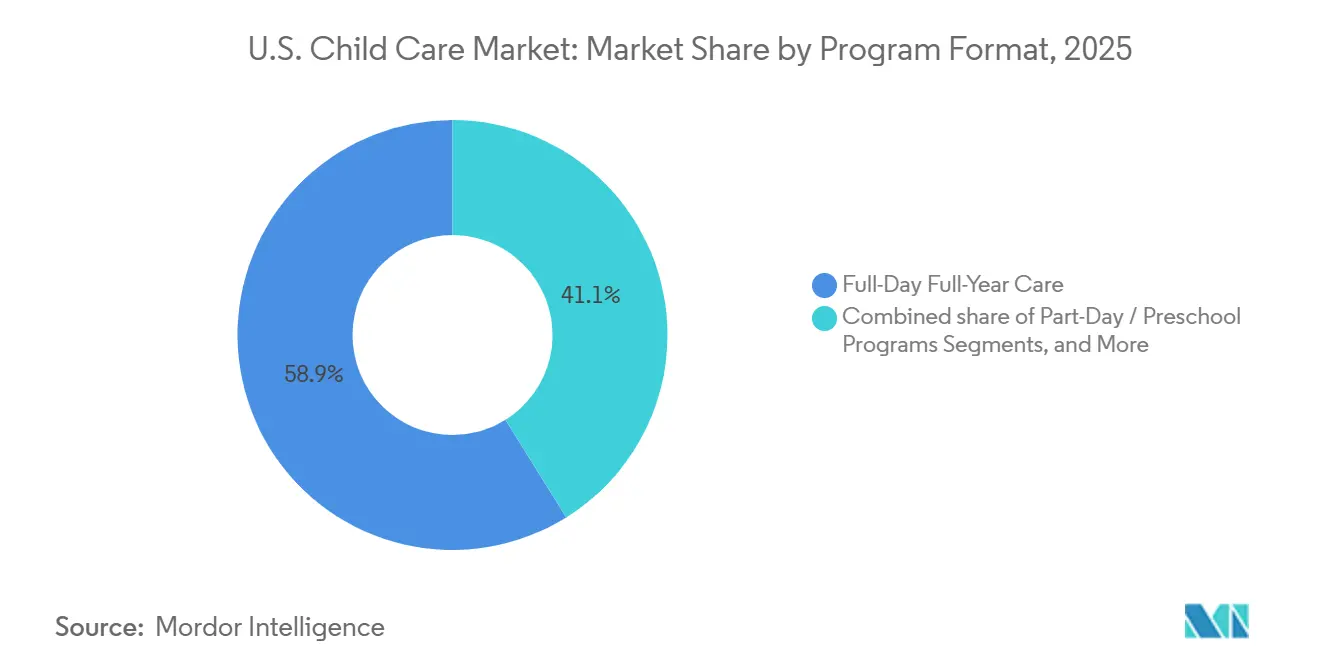
In 2025, Full-Day Full-Year Care captured 58.88% of the United States child care market, aligning with the schedules of dual-income and single-parent households. This format provides providers with a stable revenue base. KinderCare’s fiscal 2025 revenue rose 2.6% to USD 2.73 billion, supported by a 2% tuition increase in this format.
Part-Day and Preschool Programs are projected to grow at a 7.86% CAGR from 2026 to 2031, driven by wraparound models combining public pre-K or school-day programs with private care. Johnston Community School District initiated a 3-year wraparound plan starting in the 2026-2027 school year, integrating licensed day care centers with district busing and onsite care.
By Ownership and Funding Model: Nonprofits Lead Current Revenue While School-Linked Models Expand Faster
Nonprofit Providers accounted for 45.59% of the United States child care market in 2025, supported by subsidy programs, philanthropic funding, and tax-exempt structures. Nonprofits play a key role in mixed-delivery models with local governments and school systems, maintaining a strong position in a fragmented market.
Public and School-Linked Providers are projected to grow at a 7.67% CAGR through 2031, making them the fastest-growing ownership category. Travis County allocated USD 10.5 million to establish child care programs at nine Austin-area elementary schools. In Washington State, Boys and Girls Clubs of Bellevue secured a contract to provide before- and after-school care across all Bellevue School District elementary schools starting in fall 2026.
Geography Analysis
New York remains a key public-funding anchor in the United States child care market, with a GY2025 CCDF allocation of USD 638.4 million, the third-largest nationwide. In the Northeast, Massachusetts saw center-based care costs rise 14% to 26% between 2022 and 2024, alongside a 7% to 9% increase in staff compensation and a 28% to 29% jump in facility costs. These rising expenses highlight the growing relevance of subsidy support and employer-linked benefits in dense metro areas, where tuition alone cannot offset inflation. The region also benefits from strong institutional demand for structured care, supported by school-linked and nonprofit models working with public funding streams.
The Southern United States has become a major zone for funding and expansion in the child care market. Texas leads with a GY2025 CCDF allocation of USD 1.30 billion, followed by Florida at USD 721.9 million, enabling both states to enhance access and provider participation. School-linked capacity is expanding, with Travis County investing USD 10.5 million to establish child care at nine Austin-area elementary schools. Manufacturing corridors in the South and Midwest are also seeing employer-backed supply, as Toyota plans to open four onsite centers across North Carolina, Mississippi, Alabama, and West Virginia, with a combined capacity exceeding 1,000 children by 2027. These projects address gaps in local supply near employment hubs.
Competitive Landscape
The United States child care market remains highly fragmented, with KinderCare and four other leading providers accounting for only 6% of total licensed center capacity. The remaining capacity is distributed among independent centers, regional chains, nonprofits, and family child care homes, limiting top-tier concentration. KinderCare, the largest private operator by center footprint, reported fiscal 2025 revenue of USD 2.73 billion across 1,589 early childhood education centers and 1,043 before-and-after-school sites.
A key strategic shift in the United States child care market is the focus on employer-sponsored care. Bright Horizons reported that corporate sites contributed 38% of 2025 enrollment through 14 new Fortune 500 contracts, showcasing the scalability of employer partnerships. KinderCare also reported USD 535 million in 2024 revenue from employer-sponsored tuition benefit programs, nearly 20% of its total revenue, with this segment growing faster than its community-center business. The expanded 45F credit is expected to further strengthen this channel from 2026 onward.
Another strategy involves standardizing operating systems and curriculum tools across multi-site portfolios. Endeavor Schools implemented Teaching Strategies GOLD, the Creative Curriculum, and the Quorum professional development platform across over 100 campuses, ensuring consistent program delivery. Similarly, KinderCare is leveraging its proprietary OneCMS center management platform, parent portal, and mobile app to enhance operational efficiency.
U.S. Child Care Industry Leaders
-
Learning Care Group
-
Bright Horizons Family Solutions
-
Primrose Schools Franchising Company
-
Kiddie Academy Domestic Franchising LLC
-
Children’s Lighthouse
- *Disclaimer: Major Players sorted in no particular order
Recent Industry Developments
- March 2026: Boys and Girls Clubs of Bellevue secured a contract to serve as the exclusive before- and after-school provider for all Bellevue School District elementary schools starting fall 2026.
- January 2026: The IRC 45F employer-provided child care credit was expanded, increasing the maximum annual credit for large businesses to USD 500,000 and raising the credit rate to 40%, while small businesses could claim up to USD 600,000 at a 50% rate. The DCAP pre-tax contribution limit also rose to USD 7,500 per household.
- September 2025: GY2025 CCDF federal funding allocations were finalized at USD 12.55 billion, with Texas and California receiving the largest shares of USD 1.30 billion and USD 1.09 billion, respectively.
- August 2025: Travis County approved a USD 10.5 million investment to establish child care programs at nine elementary schools in partnership with Austin ISD.
U.S. Child Care Market Report Scope
As per the scope of the report, child care market is the commercial and institutional sector providing supervision, early childhood education, and developmental care for infants and children. Driven by dual-income households and urbanization, it encompasses formal daycares, in-home care, and preschools, serving as an essential support system for working parents.
The U.S. Child Care Market is segmented by care setting, age group, program format, and ownership and funding model. By care setting, the market includes center-based care, home-based care, and relative care. By age group, the market is segmented into infants, toddlers, preschoolers, and school-age children. By program format, the market is categorized into full-day full-year care, part-day/preschool programs, before-school care, after-school care, and others. By ownership and funding model, the market is segmented into for-profit private providers, nonprofit providers, and public and school-linked providers. The report offers the market sizes and forecasts in terms of value (USD) for the above segments.
| Center-Based Care |
| Home-Based Care |
| Relative Care |
| Infants |
| Toddlers |
| Preschoolers |
| School-Age Children |
| Full-Day Full-Year Care |
| Part-Day / Preschool Programs |
| Before-School Care |
| After-School Care |
| Others |
| For-Profit Private Providers |
| Nonprofit Providers |
| Public and School-Linked Providers |
| By Care Setting | Center-Based Care |
| Home-Based Care | |
| Relative Care | |
| By Age Group | Infants |
| Toddlers | |
| Preschoolers | |
| School-Age Children | |
| By Program Format | Full-Day Full-Year Care |
| Part-Day / Preschool Programs | |
| Before-School Care | |
| After-School Care | |
| Others | |
| By Ownership and Funding Model | For-Profit Private Providers |
| Nonprofit Providers | |
| Public and School-Linked Providers |
Key Questions Answered in the Report
How large is the U.S. child care market in 2026 and where is it expected to reach by 2031?
The U.S. child care market size stands at USD 82.38 billion in 2026 and is forecast to reach USD 110.34 billion by 2031, growing at a CAGR of 6.02%.
Which care setting leads revenue in the United States?
Center-Based Care led with 65.34% of 2025 revenue, supported by parent preference for licensed and curriculum-structured environments.
Which age group is growing the fastest in child care services?
Infants are the fastest-growing age group, with a projected 7.95% CAGR through 2031, mainly because licensed infant capacity remains tight in many areas.
Why is employer-sponsored child care gaining momentum in 2026?
The expanded IRC 45F credit raised the maximum annual benefit to USD 500,000 for large employers and up to USD 600,000 for small businesses, making employer-backed care more financially attractive.
What is the biggest operating challenge for providers?
Teacher shortages remain the main constraint, since early childhood educators earned a median USD 16.01 per hour and labor already accounts for 70% to 80% of typical operating budgets.
Is the U.S. child care market consolidated or fragmented?
It is highly fragmented, as the top 5 providers account for only 6% of licensed center capacity, leaving most supply with independent, regional, nonprofit, and home-based operators.