Child Care Market Size and Share
Market Overview
| Study Period | 2020 - 2031 |
|---|---|
| Market Size (2026) | USD 274.71 Billion |
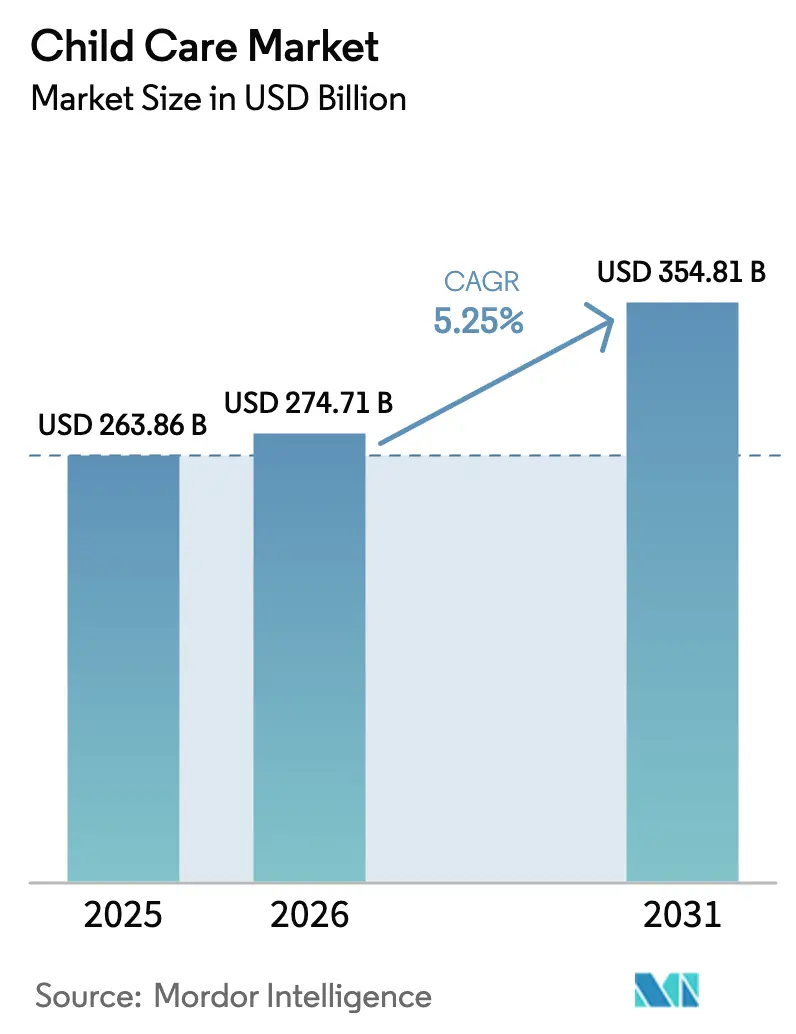
| Market Size (2031) | USD 354.81 Billion |
| Growth Rate (2026 - 2031) | 5.25% CAGR |
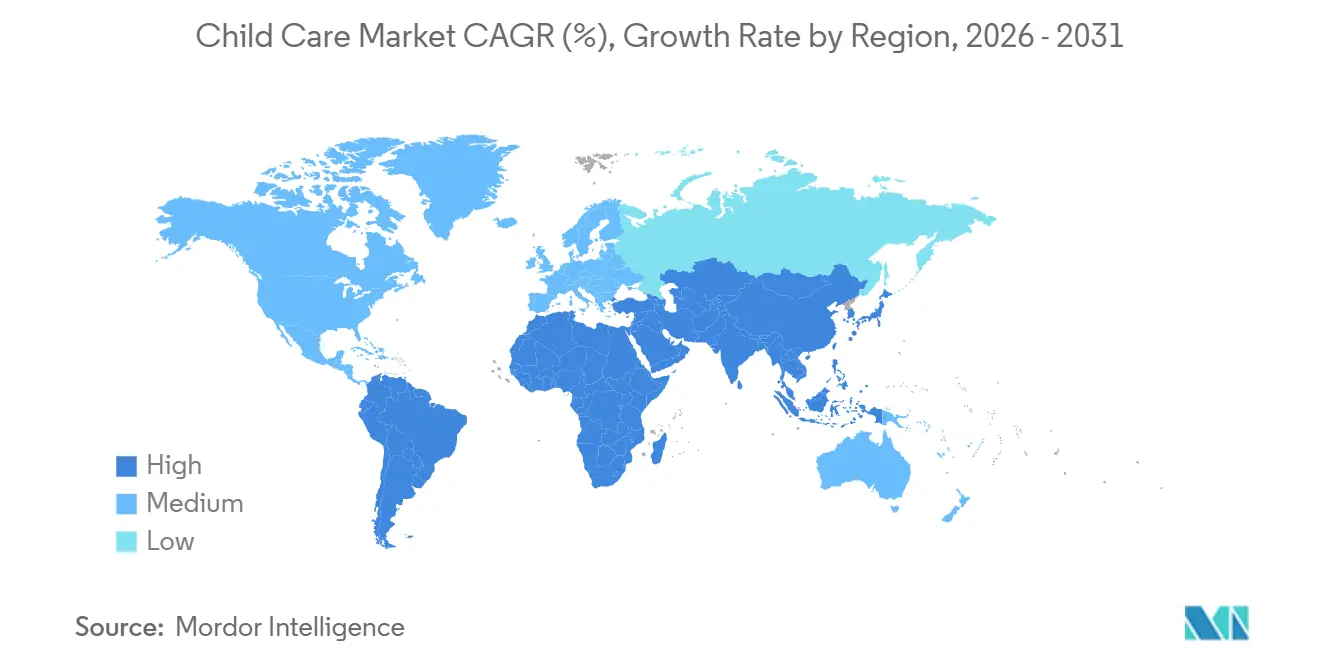
| Fastest Growing Market | Asia-Pacific |
| Largest Market | North America |
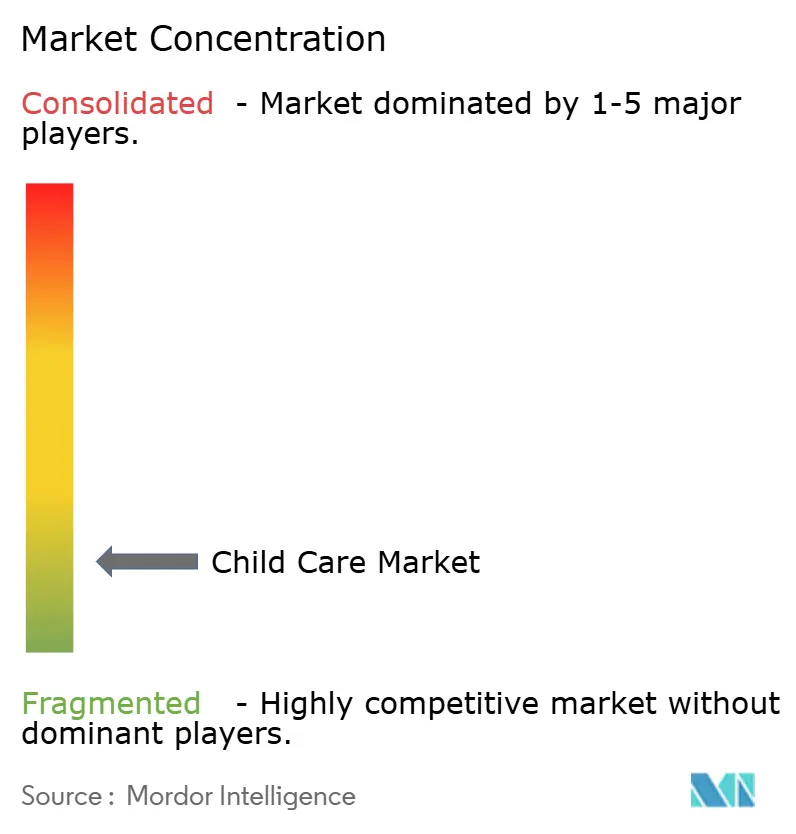
| Market Concentration | Low |
Major Players *Disclaimer: Major Players sorted in no particular order Image © Mordor Intelligence. Reuse requires attribution under CC BY 4.0. | |
Child Care Market Analysis by Mordor Intelligence
The Child Care Market size is projected to expand from USD 263.86 billion in 2025 and USD 274.71 billion in 2026 to USD 354.81 billion by 2031, registering a CAGR of 5.25% between 2026 to 2031.
Mothers’ rising labor-force participation, corporate demand for on-site solutions, and digital enrollment platforms are widening access faster than wage growth alone. Formal center operators are standardizing safety tech and curriculum IP to defend pricing power, while governments in Canada, Australia, and parts of Europe lift subsidies that cap out-of-pocket fees below 10% of median household income.[1]Employment and Social Development Canada, “Progress on Canada-Wide Early Learning,” Government of Canada, canada.ca In parallel, employer-backed contracts insulate operators from vacancy risk, pushing unit-level margins three to five percentage points above independents. AI-enabled safety analytics, adaptive learning engines, and mobile wait-list apps are reshaping parent expectations around transparency and response time. Still, educator shortages and new ventilation codes curb capacity growth in high-cost metros.
Key Report Takeaways
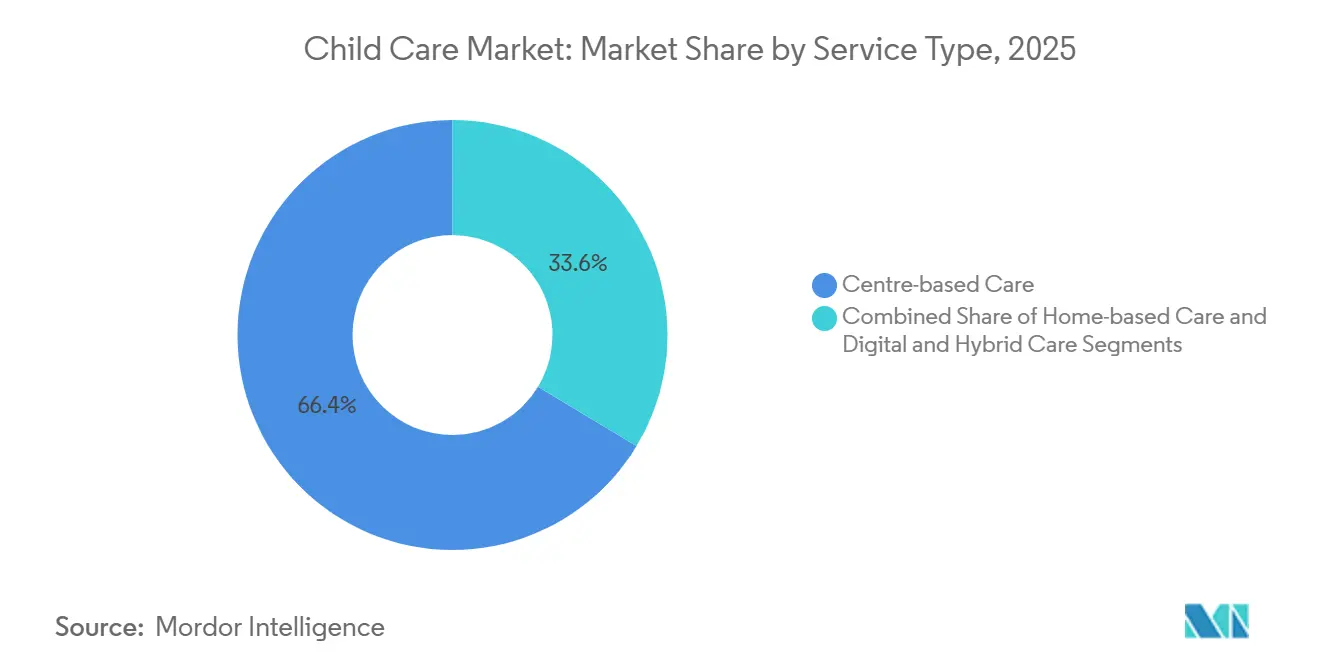
- By service type, center-based care commanded 66.36% of the child care market share in 2025, while digital and hybrid formats are projected to record the fastest 8.14% CAGR through 2031.
- By age group, preschoolers aged 3–5 years accounted for 52.67% of enrollment in 2025, whereas infant care for children under 12 months is set to expand at a 9.46% CAGR between 2026 and 2031.
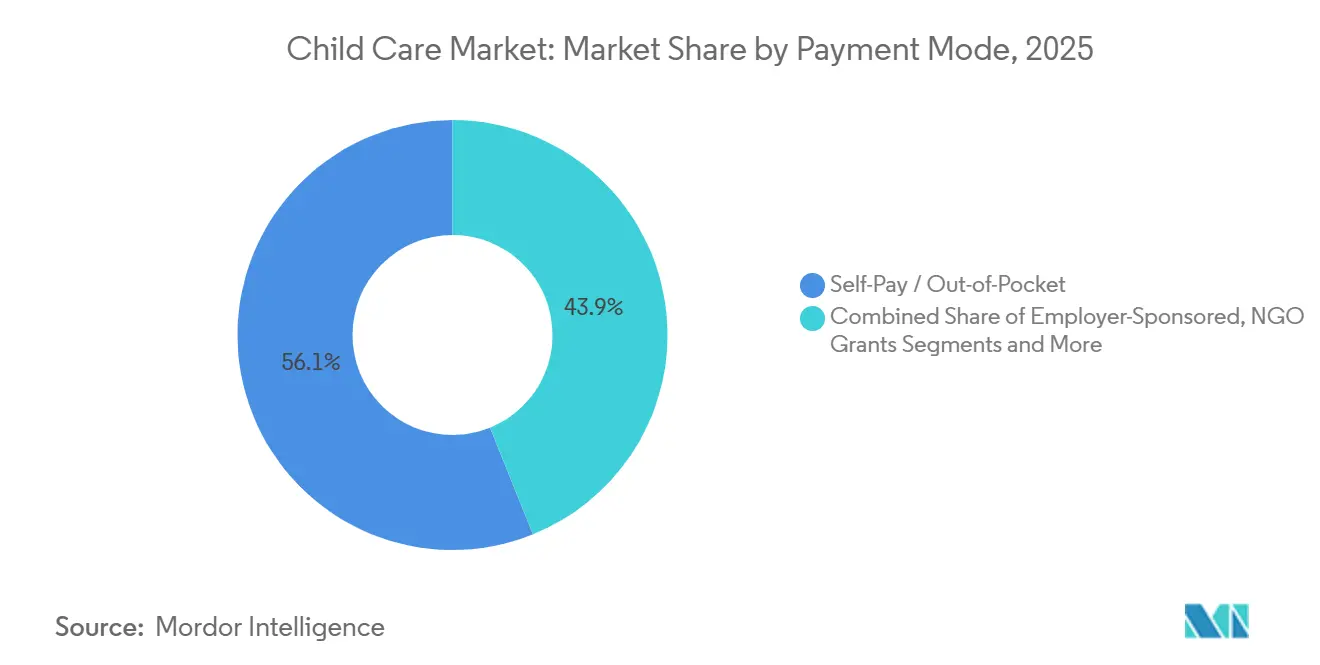
- By payment mode, self-pay generated 56.11% of global revenue in 2025, yet government subsidies and vouchers are advancing at an 8.12% CAGR to 2031.
- By provider ownership, for-profit operators captured 54.73% of 2025 revenue, but not-for-profit providers are poised for a stronger 7.24% CAGR through 2031.
- By geography, North America delivered 42.62% of global value in 2025, while Asia-Pacific is on track for the swiftest 7.82% CAGR through 2031.
Note: Market size and forecast figures in this report are generated using Mordor Intelligence’s proprietary estimation framework, updated with the latest available data and insights as of 2026.
Global Child Care Market Trends and Insights
Drivers Impact Analysis*
| Driver | (~) % Impact on CAGR Forecast | Geographic Relevance | Impact Timeline |
|---|---|---|---|
| Rising Dual-Income Households | 1.2% | Global, with highest intensity in North America, Europe, and urban Asia-Pacific | Medium term (2-4 years) |
| Government Affordability Programs & Subsidies | 1.5% | North America (Canada, select U.S. states), Europe (UK, Germany, France), Australia | Short term (≤ 2 years) |
| Corporate Demand for Employer-Sponsored Care | 0.8% | North America, Europe, GCC (employer-driven economies) | Medium term (2-4 years) |
| Digital Platform Expansion & Enrollment Automation | 0.6% | Global, with early adoption in North America, Europe, urban Asia-Pacific | Long term (≥ 4 years) |
| AI-Enabled Adaptive Learning & Safety Analytics | 0.4% | North America, Europe, Australia, Japan, South Korea | Long term (≥ 4 years) |
| Urban Micro-Centre Formats in Retail Real-Estate Voids | 0.5% | North America, Europe, Asia-Pacific urban cores | Medium term (2-4 years) |
| Source: Mordor Intelligence | |||
Rising Dual-Income Households
Female labor-force participation in the United States climbed to 57.4% in 2025, and dual-earner families now account for 63% of households with children under six years. Canada’s CAD 10-per-day policy produced a 22% jump in applications, while Australia’s 90% subsidy ceiling added 15% more users. These shifts compress informal-care windows and lengthen wait lists in metro regions.
Government Affordability Programs & Subsidies
The U.S. dependent-care tax credit rose to USD 4,000 per child in 2025. The UK injected GBP 1.5 billion to extend thirty free hours weekly to infants. Germany eliminated municipal fees for low-income families, and Japan raised subsidy ceilings for part-time workers, each move tilting revenue mixes toward public reimbursement.[2] Internal Revenue Service, “Dependent Care Credit Increase for 2025,” IRS, irs.gov
Corporate Demand for Employer-Sponsored Care
Bright Horizons disclosed that employer sites covered 38% of 2025 enrollment, buoyed by fourteen new Fortune 500 contracts. KinderCare’s B2B division advanced 19% year-over-year, while Saudi Arabia’s Vision 2030 rule compels employers to create on-site seats, widening the corporate channel’s global relevance.[3] Bright Horizons Investor Relations, “2025 Annual Report,” Bright Horizons, brighthorizons.com
Digital Platform Expansion & Enrollment Automation
Platforms such as Wonderschool, Kinside, and KindiCare reduce application friction, cut processing time from forty-five to eight minutes, and generate demand-trend data for network planning. China’s approval of eighteen virtual preschool platforms brought 1.2 million rural children online by late 2025.
Restraints Impact Analysis*
| Restraint | (~) % Impact on CAGR Forecast | Geographic Relevance | Impact Timeline |
|---|---|---|---|
| Chronic Early-Childhood Educator Shortages | -0.9% | Global, with acute pressure in North America, Europe, Australia | Short term (≤ 2 years) |
| Rising Operating & Real-Estate Costs Outpacing Fees | -0.7% | North America, Europe, urban Asia-Pacific | Medium term (2-4 years) |
| Tightening Indoor-Air & Building Codes Post-COVID-19 | -0.4% | North America, Europe, Australia, Japan | Short term (≤ 2 years) |
| Low Penetration of Child-Care Insurance Financing Tools | -0.3% | Global, with lowest penetration in Asia-Pacific, South America, MEA | Long term (≥ 4 years) |
| Source: Mordor Intelligence | |||
Chronic Early-Childhood Educator Shortages
Vacancy rates hit 12% in the U.S. during 2025 and 34% of UK nursery staff exit within two years of qualification. Australia introduced AUD 10,000 retention bonuses, yet supply still trails demand, limiting new-seat growth and raising wage bills.
Rising Operating & Real-Estate Costs Outpacing Fees
Ground-floor retail rents in major U.S. metros escalated 7.2% in 2024. KinderCare’s occupancy ratio rose to 19.7% of revenue, trimming margin by 140 basis points, while UK energy costs soared 34%, forcing reduced hours or closures among 12% of providers .
*Our forecasts treat driver/restraint impacts as directional, not additive. The impact forecasts reflect baseline growth, mix effects, and variable interactions.
Segment Analysis
By Service Type: Center Dominance Meets Digital Disruption
Center-based formats captured 66.36% of the child care market in 2025, propelled by curricula and peer socialization advantages. Digital programs’ 8.14% CAGR reflects platform-enabled rural reach and blended hub-and-spoke models that shrink real-estate intensity. Outside-school-hours care gains from dual-earner schedules, whereas employer sites achieve 85% to 95% utilization, improving child care market size resilience. Home-based offerings serve price-sensitive families but scale poorly under tighter licensing rules. Nanny and au-pair care remains niche, hampered by visa ceilings. Virtual preschool, recognized by China’s 2024 edict, externalizes content delivery and positions tech firms to claim incremental share.


By Age Group: Infant Surge Outpaces Preschool Maturity
Preschoolers accounted for 52.67% of 2025 enrollments due to universal pre-K mandates, yet growth plateaus where public systems mature. Infant care’s 9.46% CAGR ties to abbreviated leave policies and corporate return-to-office mandates, enlarging the child care market size at younger age bands. Lower adult-to-child ratios inflate provider costs but justify 20% to 40% tuition premiums, supporting stable child care market share for full-service operators. Subsidy boosts in Japan and Canada channel funds to infants, while school-age programs compete with sports leagues, constraining after-school penetration.
By Payment Mode: Subsidy Velocity Reshapes Revenue Mix
Self-pay still generated 56.11% of 2025 receipts, yet subsidy programs rise 8.12% each year, diluting tuition reliance. Canada’s CAD 10-per-day model alone added 22% net enrollment. Employer exclusions of USD 10,500 lift corporate-sponsored uptake, insulating margins when public reimbursement trails inflation. Philanthropy underwrites special-needs seats but remains project-funded, limiting scale, whereas PPP concessions blend land grants with private operations to protect the child care market share in underserved geographies.
By Provider Ownership: Not-for-Profit Gains Outpace For-Profit Scale
For-profit chains held 54.73% of 2025 revenue, supported by private-equity capital and data analytics that streamline pricing. Not-for-profits, growing 7.24%, exploit tax-exempt bonds and grants to reinvest in wages and facility upgrades, often capturing price-sensitive households. Government sites set wage floors and quality norms, shaping industry benchmarks. Cooperative models post lower per-child costs through parent labor but remain hyper-local.
Geography Analysis
North America generated 42.62% of global value in 2025. U.S. tuition averages USD 12,000 a year, but educator shortages and stricter HVAC rules limit expansion. Canada’s subsidy sweep deepened the addressable base, though queue times stretch past twelve months in Toronto. Mexico’s formal penetration lags 15%, but metropolitan dual-earner demand draws regional chains.
Asia-Pacific is on a 7.82% CAGR path through 2031. China’s virtual preschool approvals add low-capex seats, while India’s urban nuclear families pay up to INR 15,000 monthly, equal to 20% to 30% of median income. Japan widened subsidy ceilings for part-timers, and Australia lifted its top subsidy to 90%, both moving more parents into regulated networks.
Europe blends near-universal preschool with targeted private niches. The UK’s 30 free weekly hours spiked enrollment but squeezed margins for 12% of operators. Germany’s fee-free push removes price barriers below EUR 60,000 income, while France’s public école maternelle caps the private-sector ceiling at infant and extended-hour services. Southern Europe’s cultural reliance on grandparents slows uptake but urbanization is nudging change.

Competitive Landscape
The market concentration score of 2. Bright Horizons, KinderCare, and Learning Care Group harness curriculum IP and digital enrollment to outperform independents by three to five margin points. Goodstart and YMCA-linked sites lean on blended subsidies and grants, softening fee hikes while retaining staff. Technology differentiators—AI cameras, adaptive curricula—are scaling fastest at capital-rich chains. Employer-site, micro-center, and special-needs niches surface as white-space plays, whereas post-COVID compliance costs pressure undercapitalized independents into consolidation or exit.
Child Care Industry Leaders
Bright Horizons Family Solutions, Inc.
KinderCare Education
Learning Care Group, Inc.
Busy Bees Holdings
G8 Education
- *Disclaimer: Major Players sorted in no particular order

Recent Industry Developments
- February 2026: Midlands Partnership University NHS Trust replaced its BeeU service with a broader CAMHS program to support mental health for children in Shropshire
- January 2026: Kamineni Hospitals opened M’Brace, a mother-and-child unit integrating obstetrics and pediatric services in Hyderabad.
- January 2026: New York state launched a pilot with Dutchess, Monroe, and Broome counties to expand universal child care for under-fives under Governor Hochul’s statewide plan.
- January 2026: Flipkart Foundation partnered with SOS Children’s Villages India to enhance health and personal care programs across four cities .


Global Child Care Market Report Scope
As per the report's scope, child care is the caring and monitoring a child or multiple children whose ages span from two weeks to 18 years. Early childhood or elementary education may be provided as part of child care in sophisticated learning environments. Professional caregivers provide care in either a center-based setting (such as daycare centers, preschools, and schools) or at homes (nannies or family daycare).
The Child Care Market Report is segmented by Service Type, Age Group, Payment Mode, Provider Ownership, and Geography. By Service Type, the market is segmented into Centre-based Care, Home-based Care, and Digital & Hybrid Care. By Age Group, the market is segmented into Infant, Toddler, Preschool, School-Age, and Special Needs. By Payment Mode, the market is segmented into Self-Pay, Government Subsidy, Employer-Sponsored, Philanthropy, and PPP. By Provider Ownership, the market is segmented into For‑profit, Not‑for‑profit, Government, and Cooperative providers. By Geography, the market is segmented into North America, Europe, Asia-Pacific, MEA, and South America. The report also covers the estimated market sizes and trends for 17 countries across significant regions globally. The report offers the value (USD) for all the above segments.
| Centre-based Care | Long Day Care / Nursery Schools |
| Preschool / Pre-Kindergarten | |
| Outside School-Hours Care (Before / After) | |
| Employer On-site / Near-site Centres | |
| Drop-in & Flexible Micro-Centres | |
| Home-based Care | Licensed Family Day Care |
| Unlicensed Family / Informal Care | |
| Nanny / Au Pair In-home Care | |
| In-home Care for Special Needs / Medical | |
| Digital & Hybrid Care | Virtual Early-Learning Programs |
| Marketplace & Booking Platforms | |
| Blended Hub-and-Spoke Models |
| Infant (0-12 mo) |
| Toddler (1-2 yr) |
| Preschool (3-5 yr) |
| School-Age (6-12 yr) |
| Children with Special Needs (0-12 yr) |
| Self-Pay / Out-of-Pocket |
| Government Subsidy / Voucher |
| Employer-Sponsored |
| Philanthropy / NGO Grants |
| Public-Private Partnership (Mixed) |
| For-profit |
| Not-for-profit |
| Government-Operated |
| Cooperative / Parent-Led |
| North America | United States |
| Canada | |
| Mexico | |
| Europe | Germany |
| France | |
| United Kingdom | |
| Italy | |
| Spain | |
| Rest of Europe | |
| Asia-Pacific | China |
| Japan | |
| India | |
| South Korea | |
| Australia | |
| Rest of Asia-Pacific | |
| Middle East & Africa | GCC |
| South Africa | |
| Rest of Middle East & Africa | |
| South America | Brazil |
| Argentina | |
| Rest of South America |
| By Service Type | Centre-based Care | Long Day Care / Nursery Schools |
| Preschool / Pre-Kindergarten | ||
| Outside School-Hours Care (Before / After) | ||
| Employer On-site / Near-site Centres | ||
| Drop-in & Flexible Micro-Centres | ||
| Home-based Care | Licensed Family Day Care | |
| Unlicensed Family / Informal Care | ||
| Nanny / Au Pair In-home Care | ||
| In-home Care for Special Needs / Medical | ||
| Digital & Hybrid Care | Virtual Early-Learning Programs | |
| Marketplace & Booking Platforms | ||
| Blended Hub-and-Spoke Models | ||
| By Age Group | Infant (0-12 mo) | |
| Toddler (1-2 yr) | ||
| Preschool (3-5 yr) | ||
| School-Age (6-12 yr) | ||
| Children with Special Needs (0-12 yr) | ||
| By Payment / Funding Mode | Self-Pay / Out-of-Pocket | |
| Government Subsidy / Voucher | ||
| Employer-Sponsored | ||
| Philanthropy / NGO Grants | ||
| Public-Private Partnership (Mixed) | ||
| By Provider Ownership | For-profit | |
| Not-for-profit | ||
| Government-Operated | ||
| Cooperative / Parent-Led | ||
| By Geography | North America | United States |
| Canada | ||
| Mexico | ||
| Europe | Germany | |
| France | ||
| United Kingdom | ||
| Italy | ||
| Spain | ||
| Rest of Europe | ||
| Asia-Pacific | China | |
| Japan | ||
| India | ||
| South Korea | ||
| Australia | ||
| Rest of Asia-Pacific | ||
| Middle East & Africa | GCC | |
| South Africa | ||
| Rest of Middle East & Africa | ||
| South America | Brazil | |
| Argentina | ||
| Rest of South America | ||


Key Questions Answered in the Report
How fast is global spending on formal care growing?
Between 2026 and 2031, global spending is expected to rise from USD 274.71 billion to USD 354.81 billion at a 5.25% CAGR.
Which service format is gaining share most rapidly?
Digital and hybrid programs are advancing at an 8.14% CAGR, the fastest among all formats thanks to enrollment apps and virtual curricula.
Why is infant care expanding quicker than preschool?
Shorter parental leave windows and return-to-office mandates push parents to secure formal slots for infants, driving a 9.46% CAGR for the 0- to 12-month category.
What role do employer-sponsored centers play in capacity growth?
Employer sites enjoy 85%–95% utilization and shift capital risk to corporations, accelerating seat additions in tight labor markets.
How are educator shortages affecting operations?
A 12% U.S. vacancy rate in 2025 forces wage hikes, limits center openings, and subtracts 0.9 percentage points from forecast CAGR.
Which regions are projected to post the highest growth?
Asia-Pacific leads with a 7.82% CAGR through 2031, fueled by urbanization, rising female workforce participation, and regulatory liberalization.
Page last updated on:


