Day Care Market Size and Share
Market Overview
| Study Period | 2020 - 2031 |
|---|---|
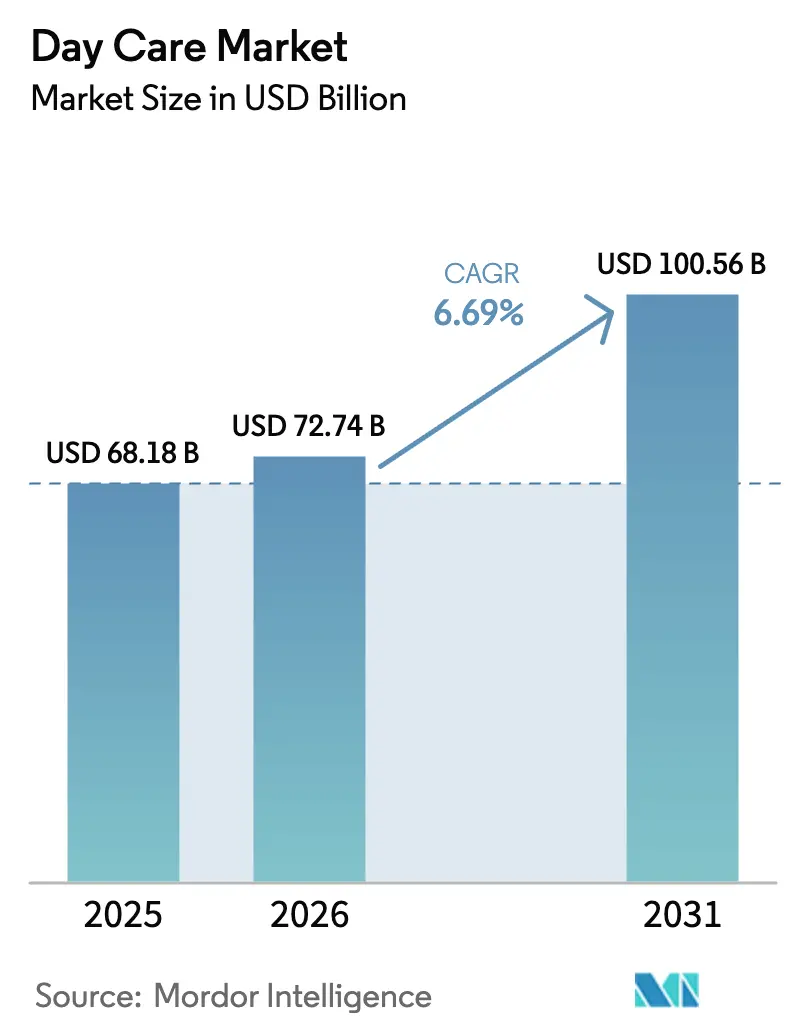
| Market Size (2026) | USD 72.74 Billion |
| Market Size (2031) | USD 100.56 Billion |
| Growth Rate (2026 - 2031) | 6.69% CAGR |
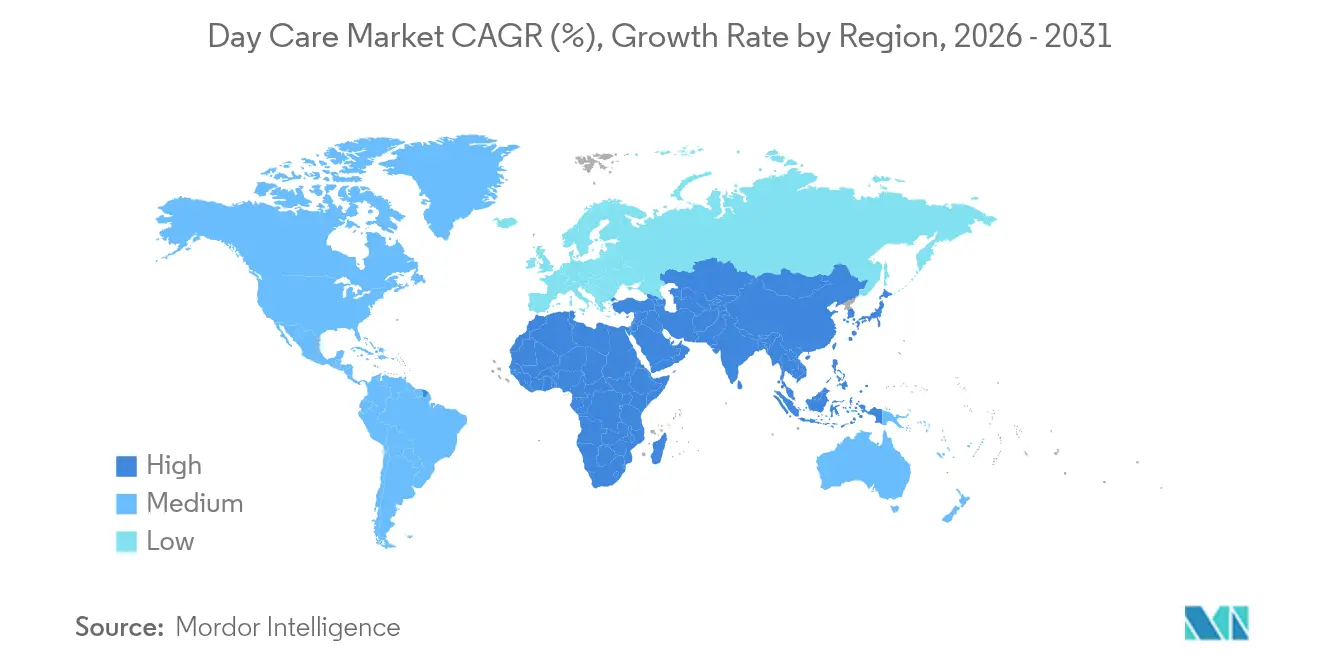
| Fastest Growing Market | Asia Pacific |
| Largest Market | North America |
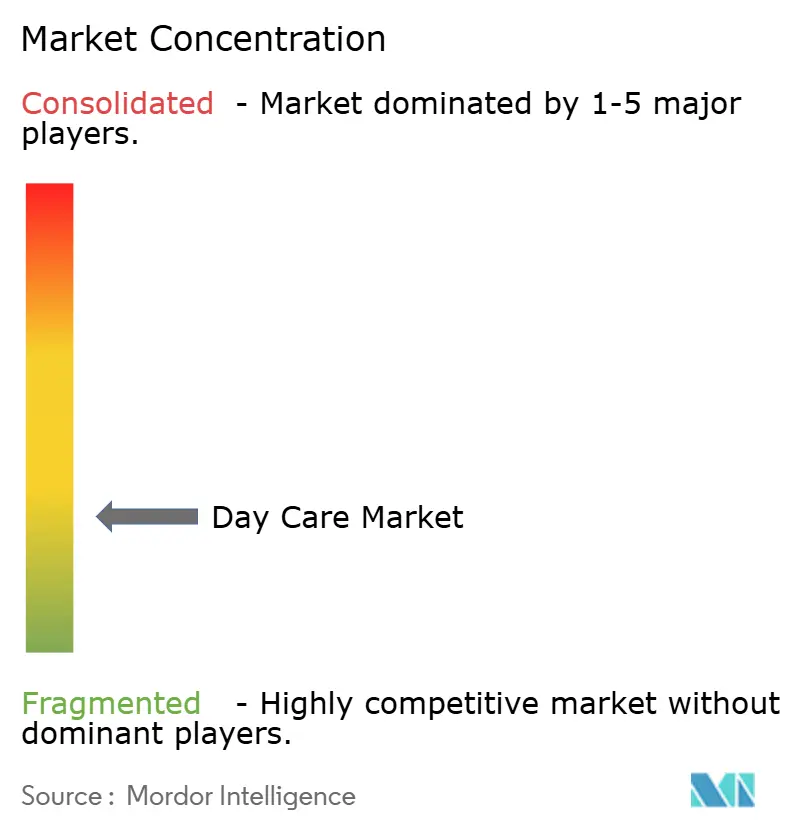
| Market Concentration | Low |
Major Players *Disclaimer: Major Players sorted in no particular order Image © Mordor Intelligence. Reuse requires attribution under CC BY 4.0. | |
Day Care Market Analysis by Mordor Intelligence
The day care market size is expected to grow from USD 68.18 billion in 2025 to USD 72.74 billion in 2026 and is forecast to reach USD 100.56 billion by 2031 at 6.69% CAGR over 2026-2031. This expansion rests on rising dual-income households, growing acceptance of early-years education, and a wave of public subsidies that lower entry barriers for families. Demand is further amplified by corporate employers that now treat childcare benefits as core workforce infrastructure, especially in sectors where remote work is not feasible. Structural shifts are evident in the widening gap between parents who need cost support (46%) and those who receive it (29%). Public policy is stepping in; Australia’s “3-day guarantee” law coming into force in January 2026 ensures every subsidy-eligible family receives 72 hours of funded care every fortnight, embedding predictable demand into the national system.[1]Australian Government, “3-day guarantee – legislation passed,” education.gov.au Asia-Pacific’s demographic transition and women-in-workforce targets add further momentum, giving the region the fastest growth outlook worldwide.
Key Report Takeaways
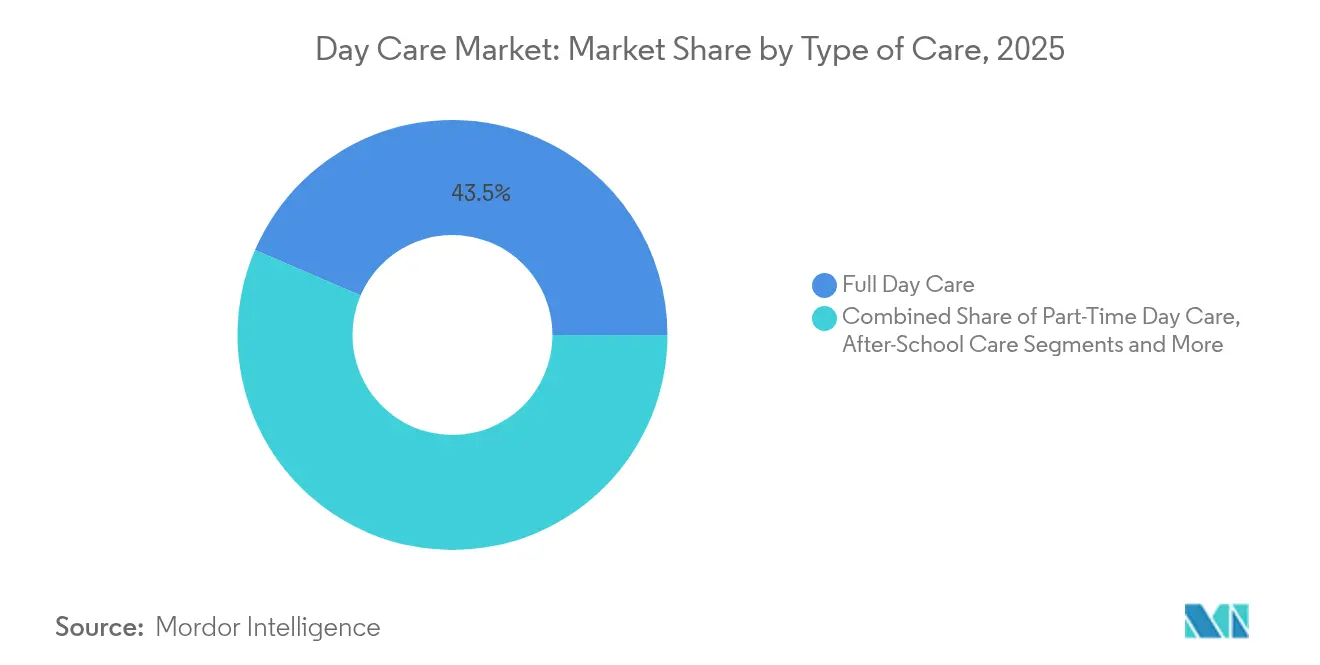
- By type of care, Full Day Care led with 43.54% of the day care market share in 2025, while Emergency/Drop-In Care is projected to grow at an 8.41% CAGR to 2031.
- By location, Center-Based settings accounted for 61.12% of the day care market size in 2025; Workplace/On-Site Corporate facilities hold the highest forecast CAGR at 9.12% through 2031.
- By ownership, private operators captured 68.05% share of the day care market size in 2025, whereas corporate-sponsored models are advancing at 10.42% CAGR between 2026-2031.
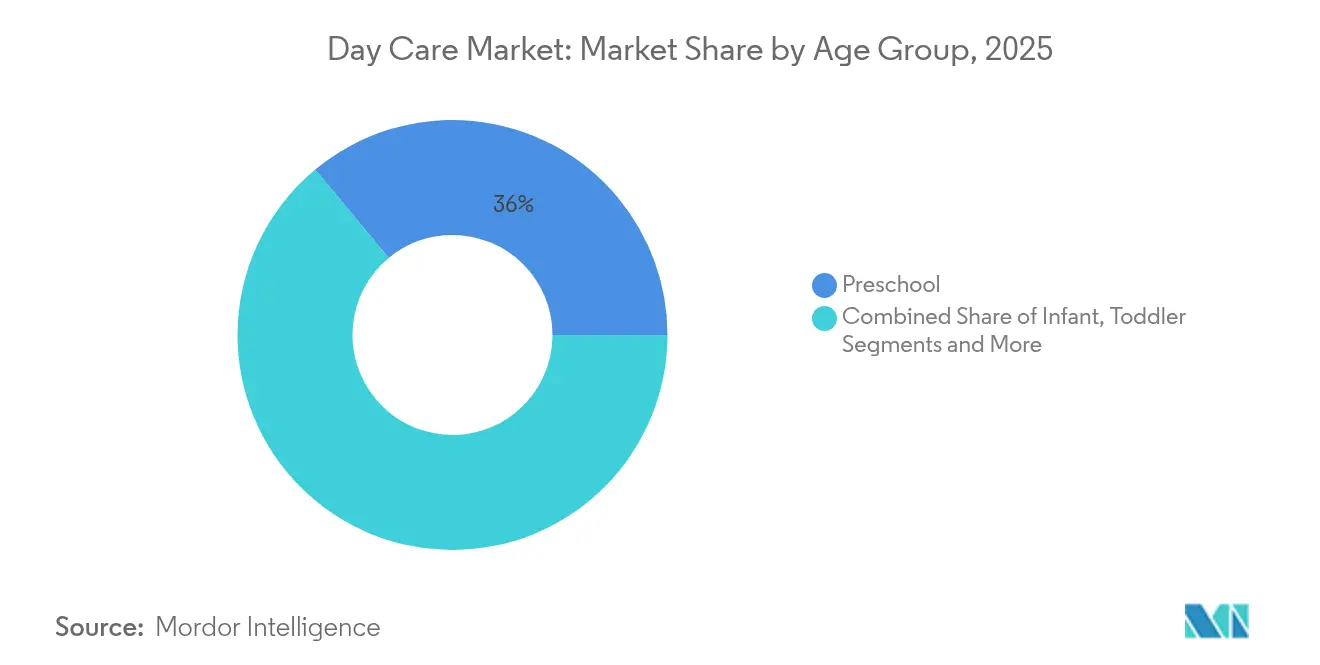
- By age group, Preschool services contributed 36.02% share of the day care market size in 2025; Infant care is expanding the fastest at an 8.63% CAGR.
- By service model, subscription or monthly plans dominated with 51.27% revenue share in 2025; corporate-sponsored solutions register the quickest growth at 8.97% CAGR.
- By geography, North America retained a 35.86% day care market share in 2025 and Asia-Pacific leads growth with an 8.68% CAGR toward 2031.
Note: Market size and forecast figures in this report are generated using Mordor Intelligence’s proprietary estimation framework, updated with the latest available data and insights as of 2026.
Global Day Care Market Trends and Insights
Drivers Impact Analysis*
| Driver | ( ~ ) % Impact on CAGR Forecast | Geographic Relevance | Impact Timeline |
|---|---|---|---|
| Rising number of working parents | +1.8% | Global; strongest in North America & APAC | Medium term (2-4 years) |
| Growing awareness of early childhood education benefits | +1.2% | Global; led by developed markets | Long term (≥ 4 years) |
| Government subsidies & pro-women workforce policies | +1.5% | North America, Europe, Australia | Short term (≤ 2 years) |
| Corporate-sponsored on-site childcare adoption | +0.9% | North America, Europe | Medium term (2-4 years) |
| Digital childcare management & CRM platforms | +0.4% | Global; technology-forward markets | Long term (≥ 4 years) |
| Private-equity led consolidation expanding capacity | +0.7% | North America, Europe | Short term (≤ 2 years) |
| Source: Mordor Intelligence | |||
Rising Number of Working Parents
Maternal labor-force participation is at historic highs across developed economies, yet childcare price tags often equal rent, forcing many mothers to forgo employment. From 2022-2024, more than 1.1 million U.S. parents cited childcare gaps as the reason they could not work, up sharply versus the prior three-year period. Governments see the opportunity costs: Australia, Germany, and the UK estimate that expanded early-years provision could add 720,000 mothers to the workforce. As labor markets tighten, employer and state interventions to plug these gaps become decisive growth catalysts for the day care market.
Growing Awareness of Early Childhood Education Benefits
High-quality early learning delivers lifetime earning and health gains, a message now resonating in policy circles. The MENA region has tasked 22 governments with creating 400,000 care-economy jobs by 2030 after finding that existing services meet only 10% of demand. Australia’s 2024-2034 Early Years Strategy positions early development as economic infrastructure, ensuring sustained public investment.[2]Department of Social Services, Australian Government, “Early Years Strategy,” dss.gov.au These moves de-risk provider expansion, encourage curriculum innovation, and raise quality baselines across the day care market.
Government Subsidies & Pro-Women Workforce Policies
Targeted funding reshapes market economics almost overnight. The U.S. American Relief Act channelled USD 250 million into state childcare systems with spending eligibility through September 2028.[3]U.S. Department of Health and Human Services, “American Relief Act CCDF Discretionary Supplemental Funds,” acf.gov Massachusetts kept centers open after pandemic-era aid expired by committing USD 475 million in state dollars, boosting capacity without tuition hikes. In Europe, similar subsidy boosts tie directly to women-in-workforce KPIs, accelerating enrollment and underpinning the day care market.
Corporate-Sponsored On-Site Childcare Adoption
Employers facing retention pain points have shifted from piloting to mainstreaming onsite centers. Two-thirds of parents say affordable care is their top work hurdle, and firms that solve it see measurable drops in turnover. Pittsburgh International Airport opened a childcare hub in 2023 to stabilise around-the-clock staffing. Such facilities guarantee enrolment volumes for providers, enabling premium pricing and supporting a predictive revenue model unique within the day care market.
Restraints Impact Analysis*
| Restraint | (~) % Impact on CAGR Forecast | Geographic Relevance | Impact Timeline |
|---|---|---|---|
| High cost of day-care services | –1.4% | Global; most acute in developed markets | Medium term (2-4 years) |
| Stringent licensing & regulatory burdens | –0.8% | North America, Europe | Short term (≤ 2 years) |
| Severe staffing shortages & wage pressure | –1.1% | Global; critical in developed markets | Long term (≥ 4 years) |
| Cyber-security & data-privacy risks from software use | –0.3% | Global; technology-forward markets | Long term (≥ 4 years) |
| Source: Mordor Intelligence | |||
High Cost of Day-Care Services
Families in advanced economies routinely face monthly fees between USD 2,000 and USD 3,000, swallowing 27% of household income—well beyond the 7% affordability benchmark. Unsurprisingly, 46% of U.S. parents want help with childcare expenses while only 29% receive it. High prices deter participation, especially among low- and middle-income groups, capping market volume even as underlying need remains strong. Unless subsidies rise or operating costs fall, the day care market will continue to bump up against affordability ceilings.
Stringent Licensing & Regulatory Burdens
Safety codes save lives but can throttle capacity. California’s 2024 fire-code update forced centres serving infants to reduce head-counts or retrofit sprinklers, affecting an estimated 2,250 slots. Idaho went the opposite way, scrapping state-mandated child-to-staff ratios and sparking quality-of-care concerns. Regulatory volatility complicates investment modelling and slows approvals, injecting near-term friction into the day care market.
*Our forecasts treat driver/restraint impacts as directional, not additive. The impact forecasts reflect baseline growth, mix effects, and variable interactions.
Segment Analysis
By Type of Care: Emergency Services Drive Innovation
Emergency/Drop-In Care is forecast to post an 8.41% CAGR through 2031, the quickest among all types, even as Full Day Care retains 43.54% of 2025 revenue. The segment’s flexible attendance model aligns with gig-economy work patterns and shift-based industries. Higher utilisation per square foot allows providers to widen margins and offset intermittent enrolment. Corporate backup-care programmes reinforce demand, with Bright Horizons’ related revenue topping USD 600 million in 2024.
Wider adoption necessitates dynamic staffing tools and real-time scheduling platforms, pushing operators toward sophisticated software ecosystems. As parental workweeks fragment further, the day care market will see Emergency/Drop-In Care continue winning share, especially in urban centres where space constraints reward turnover-optimised formats.


By Location: Workplace Integration Accelerates
Center-Based venues held 61.12% of 2025 revenue, yet Workplace/On-Site Corporate facilities show the highest 9.12% CAGR outlook. These employer-hosted centres guarantee enrolment volumes and lower marketing costs. Airports, hospitals, and logistics hubs lead adoption, recognising childcare as critical to uptime. Parents value proximity, reducing commute friction and bolstering loyalty.
Landlords and developers now bundle childcare into office-lease negotiations, a trend that embeds upside for operators able to partner early. Continued corporate uptake ensures that the day care market’s geographical footprint will increasingly overlap with employment centres rather than residential clusters.
By Ownership Type: Corporate Models Gain Momentum
Private proprietors commanded 68.05% of sector revenue in 2025, reflecting a long history of entrepreneurial ownership. Corporate-sponsored operations, however, are set for a 10.42% CAGR, fuelled by employers underwriting onsite centres. These arrangements de-risk occupancy for providers and align cost coverage with business-unit P&Ls. Franchise concepts also gain ground by blending local capital with brand-level marketing.
The path forward points to hybrid structures where corporations guarantee a base number of seats but excess capacity sells to the public, diversifying revenue. As more firms weigh retention ROI, corporate partnerships will become a defining growth lever for the day care market.
By Age Group: Infant Care Shortage Creates Opportunity
Preschool programmes amassed 36.02% of 2025 sales, but Infant care is projected to rise fastest at an 8.63% CAGR. Regulations demand higher staff-to-child ratios for infants, raising operating expenses and discouraging expansion. California’s fire-code changes illustrate how incremental compliance costs disproportionately hit infant rooms. Yet employers and policymakers view infant slots as pivotal for maternal workforce re-entry.
Providers able to navigate staffing ratios and facility requirements capture premium fee potential. Expect capital to chase high-margin infant rooms even as compliance hurdles persist, reshaping capacity allocation across the day care market.
By Service Model: Corporate Sponsorship Transforms Funding
Subscription plans delivered 51.27% of 2025 receipts, but corporate-sponsored services carry a 8.97% CAGR outlook, mirroring employers’ hunt for retention solutions. Government-subsidised places remain vital for equity goals, especially where public policy targets rural or low-income parents.
Hybrid financial models emerge, pairing direct employer payments with traditional family fees and state vouchers. Diversified income shields providers from single-stream volatility and stabilises cash flow, equipping them to reinvest in quality enhancements across the day care market.
Geography Analysis
North America held 35.86% of global revenue in 2025, underpinned by large multiprovider networks and federal support such as the USD 250 million CCDF supplement available until 2028. Massachusetts secured an extra USD 475 million to avoid a post-pandemic capacity cliff, easing tuition pressure and raising slot availability. Regulatory divergence remains a wildcard—Idaho’s removal of staffing ratios contrasts sharply with the stricter frameworks of coastal states—creating a patchwork operating climate across the day care market.
Asia-Pacific is the growth pacesetter at an 8.68% CAGR to 2031, propelled by demographic urgency and policy commitments. Australia’s “3-day guarantee” is a flagship example, promising families 72 subsidised hours per fortnight from 2026. Japan treats daycare expansion as fertility strategy, slashing waitlists in key prefectures. China and India represent enormous untapped demand pools, while Southeast Asian economies pilot public-private partnerships to scale capacity. Such initiatives position the region as the main volume engine for the day care market.
Europe offers steady growth supported by universal-care traditions, yet staffing gaps persist; two-thirds of EU nations lack adequate personnel. The UK’s plan to add 40,000 educators by September 2025 highlights the urgency. Germany’s enrolment exceeds 90% for pre-schoolers, but demographic decline may trigger rural site closures, rebalancing supply. EU investment funds now tie grants to workforce-training milestones, making human-capital development the core determinant of regional capacity within the day care market.

Competitive Landscape
The day care market displays moderate concentration: the top five operators control roughly one-fifth of total capacity, while thousands of independents serve local catchments. KinderCare’s USD 2.5 billion revenue and 1,500-plus centres underscore scale advantages in curriculum development, technology spend, and employer contracting. Private-equity firms own eight of the eleven largest chains, equal to 12% of the market, accelerating roll-ups and new-builds but drawing scrutiny over higher staff-turnover rates.
Strategic thrusts pivot on (1) geographic expansion into high-growth metros, (2) deepened employer partnerships that guarantee occupancy, and (3) digitisation to boost parent engagement. Bright Horizons invests heavily in CRM and learning-management platforms to differentiate service experience. In white-space categories such as infant care and drop-in services, nimble regional players can still outcompete chains on local reputation and tailored offerings. Rising ESG attention to workforce welfare may soon influence M&A valuations, favouring operators with low turnover and transparent pay matrices.
Day Care Industry Leaders
KinderCare Education
Bright Horizons Family Solutions
Learning Care Group
Busy Bees Childcare
G8 Education Ltd
- *Disclaimer: Major Players sorted in no particular order

Recent Industry Developments
- June 2025: Godrej Consumer Products Indonesia opened IPLAY at Godrej, an onsite centre in Jakarta that supports employee retention through in-house daycare.
- February 2025: Australia passed its 3-day guarantee, granting all subsidy-eligible families 72 hours of funded care per fortnight from January 2026.
- January 2025: The American Relief Act allocated USD 250 million in supplemental CCDF funds available until September 2028, letting states modernise payment systems and trim family co-pays.


Global Day Care Market Report Scope
As per the scope of the report, day care services refer to professional care and supervision provided to children during the day while their parents or guardians are at work or otherwise occupied. These services typically include a range of activities designed to support children's social, emotional, and educational development. Day care centers offer structured environments where children receive meals, engage in play and learning activities, and benefit from age-appropriate care.
The day care market is segmented by type of care, location, type, and geography. By type of care, the market is segmented into full day care, part-time day care, and after-school care. By location, the market is segmented into center based and home based. By type, the market is segmented into public and private. By geography, the market is segmented into North America, Europe, Asia-Pacific, Middle East and Africa, and South America. The report offers the value (USD) for the above segments.
| Full Day Care |
| Part-Time Day Care |
| After-School Care |
| Emergency / Drop-In Care |
| Center-Based |
| Home-Based |
| Workplace / On-Site Corporate |
| Mobile / Pop-Up |
| Public |
| Private |
| Non-Profit / NGO |
| Franchisee |
| Infant (0-1 yr) |
| Toddler (1-3 yr) |
| Preschool (3-5 yr) |
| School-Age (5-12 yr) |
| Subscription / Monthly |
| Hourly / Pay-As-You-Go |
| Government-Subsidized |
| Corporate-Sponsored |
| North America | United States |
| Canada | |
| Mexico | |
| Europe | Germany |
| United Kingdom | |
| France | |
| Italy | |
| Spain | |
| Rest of Europe | |
| Asia-Pacific | China |
| Japan | |
| India | |
| Australia | |
| South Korea | |
| Rest of Asia-Pacific | |
| Middle East and Africa | GCC |
| South Africa | |
| Rest of Middle East and Africa | |
| South America | Brazil |
| Argentina | |
| Rest of South America |
| By Type of Care | Full Day Care | |
| Part-Time Day Care | ||
| After-School Care | ||
| Emergency / Drop-In Care | ||
| By Location | Center-Based | |
| Home-Based | ||
| Workplace / On-Site Corporate | ||
| Mobile / Pop-Up | ||
| By Ownership Type | Public | |
| Private | ||
| Non-Profit / NGO | ||
| Franchisee | ||
| By Age Group | Infant (0-1 yr) | |
| Toddler (1-3 yr) | ||
| Preschool (3-5 yr) | ||
| School-Age (5-12 yr) | ||
| By Service Model | Subscription / Monthly | |
| Hourly / Pay-As-You-Go | ||
| Government-Subsidized | ||
| Corporate-Sponsored | ||
| By Geography | North America | United States |
| Canada | ||
| Mexico | ||
| Europe | Germany | |
| United Kingdom | ||
| France | ||
| Italy | ||
| Spain | ||
| Rest of Europe | ||
| Asia-Pacific | China | |
| Japan | ||
| India | ||
| Australia | ||
| South Korea | ||
| Rest of Asia-Pacific | ||
| Middle East and Africa | GCC | |
| South Africa | ||
| Rest of Middle East and Africa | ||
| South America | Brazil | |
| Argentina | ||
| Rest of South America | ||


Key Questions Answered in the Report
What is the current value of the day care market?
The day care market is worth USD 72.74 billion in 2026 and is projected to reach USD 100.56 billion by 2031 at a 6.69% CAGR.
Which region is growing fastest in the day care market?
Asia-Pacific records the highest forecast CAGR at 8.68% through 2031, driven by demographic pressures and supportive government policies.
Why are corporate-sponsored childcare centres expanding so quickly?
Employers see quantifiable gains in productivity and retention when onsite childcare removes a key barrier to workforce participation, giving the model a 10.42% CAGR.
What segment shows the greatest unmet demand?
Infant care faces the largest supply shortfall; despite regulatory hurdles, it is forecast to grow at an 8.63% CAGR owing to premium pricing and policy focus.
How do high childcare costs affect the market?
Fees consuming up to 27% of household income suppress participation, limiting growth potential until subsidies or alternative funding models ease the affordability burden.
Page last updated on:


