
United States Organic Waste Collection Services Market Size and Share
Market Overview
| Study Period | 2020 - 2031 |
|---|---|
| Forecast Data Period | 2026 - 2031 |
| Base Year Market Size (2025) | USD 2.11 Billion |
| Market Size (2026) | USD 2.21 Billion |
| Market Size (2031) | USD 2.84 Billion |
| Growth Rate (2026 - 2031) | 5.09% CAGR |
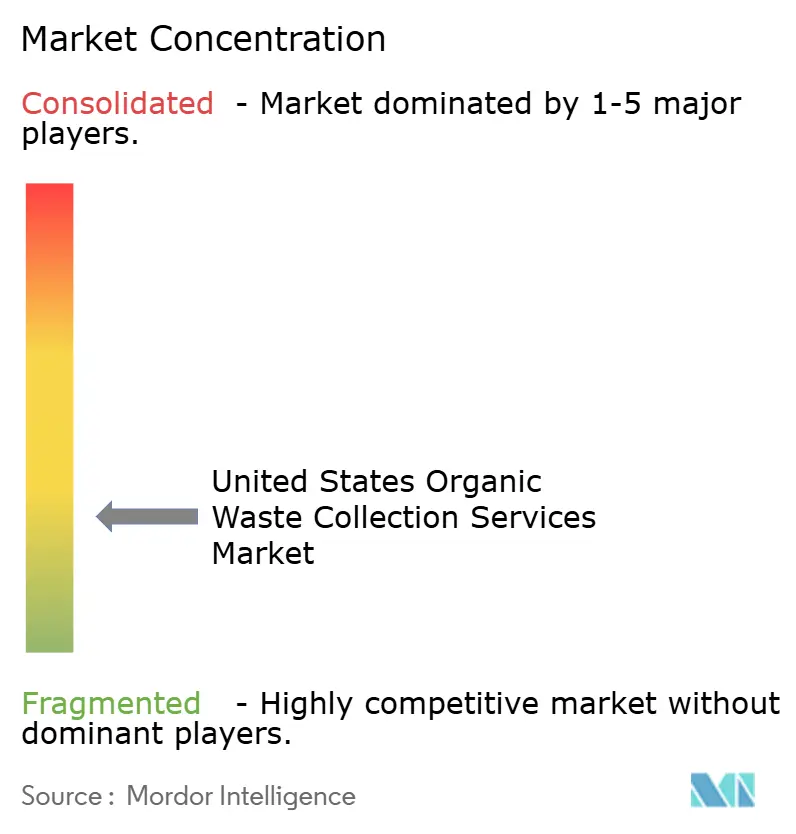
| Market Concentration | Low |
Major Players *Disclaimer: Major Players sorted in no particular order Image © Mordor Intelligence. Reuse requires attribution under CC BY 4.0. | |
United States Organic Waste Collection Services Market Analysis by Mordor Intelligence
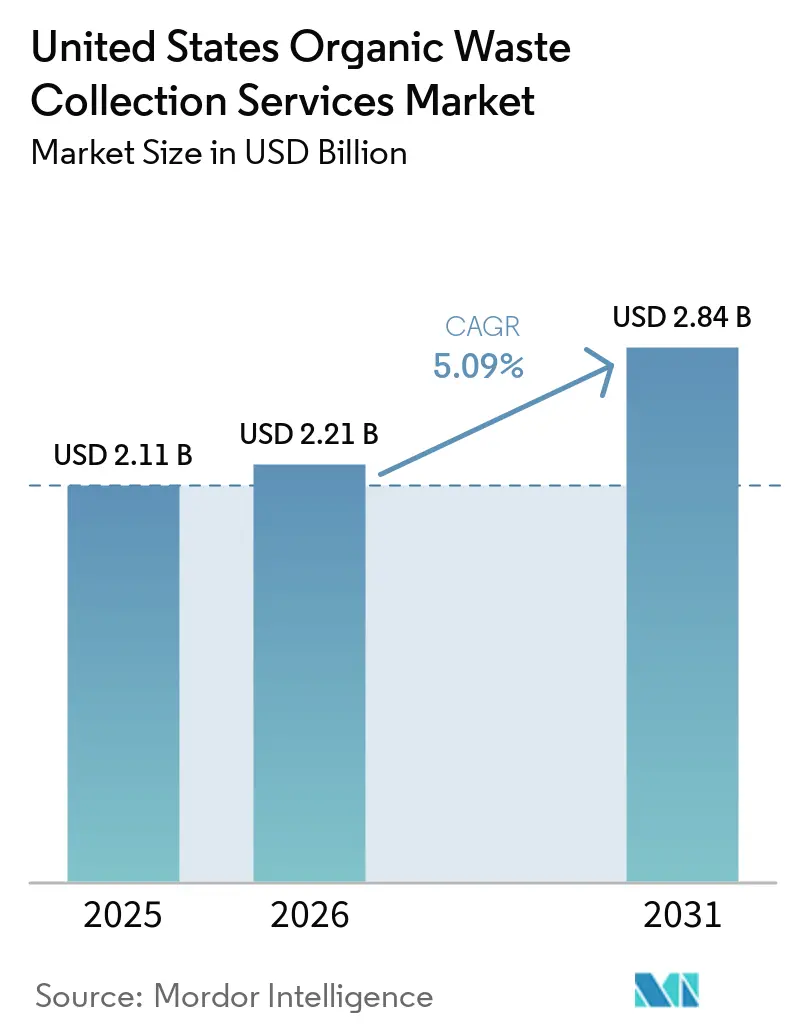
The United States Organic Waste Collection Services Market size is projected to expand from USD 2.11 billion in 2025 and USD 2.21 billion in 2026 to USD 2.84 billion by 2031, registering a CAGR of 5.09% between 2026 to 2031.
In 2026, policy-driven mandates are fueling a consistent demand for organic waste collection services. This surge is bolstered by funding from the United States Environmental Protection Agency and the United States Department of Agriculture, which are easing capital constraints and hastening program implementations in municipalities. At the same time, advancements like route optimization, bin-level tracking, and contamination analytics are enhancing operational efficiency and reducing service costs, thereby elevating service quality for both residential and commercial clients. The market, characterized by its fragmentation and robust local involvement, is witnessing large integrated players not only expanding their organic collection services but also linking them with processing and renewable fuel initiatives. This trend is fostering deeper vertical integration and spurring long-term investments.
Key Report Takeaways
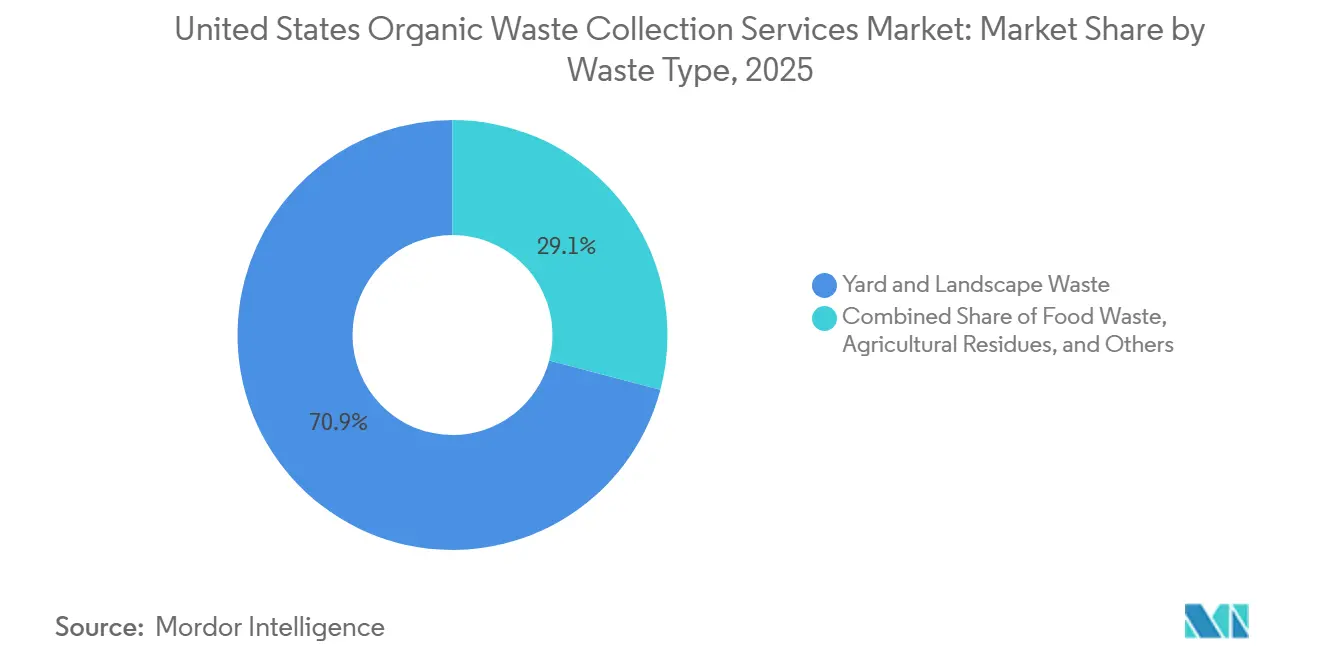
- By waste type, yard & landscape waste led with 70.9% of the United States organic waste collection services market share in 2025. Food waste is projected to grow at a CAGR of 5.9% during 2026–2031.
- By end-user, residential accounted for 58.9% of the United States organic waste collection services market size in 2025. Commercial food service is projected to grow at a 6.2% CAGR through 2026-2031.
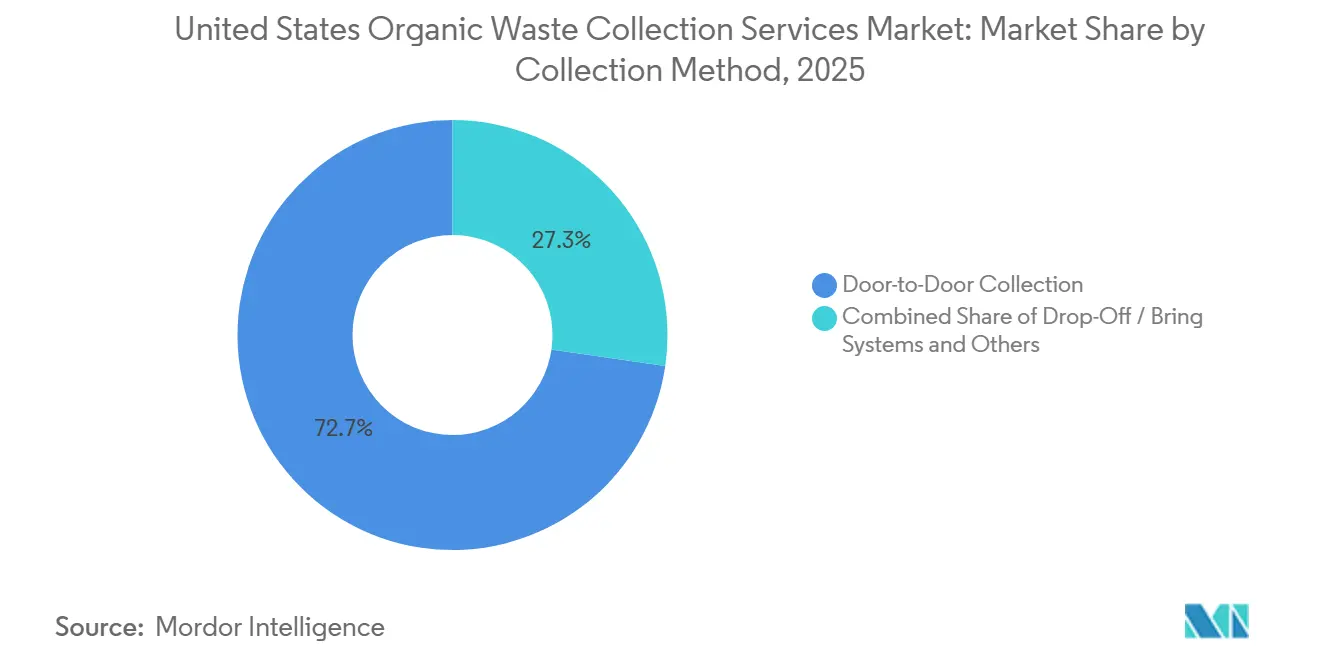
- By collection method, door-to-door collection captured 72.7% of the United States organic waste collection services market share in 2025. Door-to-door collection is also projected to post the highest growth at a 6.8% CAGR through 2026-2031.
- By technology and equipment, fully automated systems accounted for 56.2% of the technology share in 2025. Fully automated systems are projected to advance to a 7.3% CAGR through 2026-2031.
Note: Market size and forecast figures in this report are generated using Mordor Intelligence’s proprietary estimation framework, updated with the latest available data and insights as of January 2026.
United States Organic Waste Collection Services Market Trends and Insights
Drivers Impact Analysis*
| Driver | (~) % Impact on CAGR Forecast | Geographic Relevance | Impact Timeline |
|---|---|---|---|
| Stringent Government Regulations and Mandatory Organic Waste Diversion Laws | +1.9% | National, with early gains in CA, WA, NY, MA, VT | Medium term (2-4 years) |
| Rising Landfill Tipping Fees and Disposal Costs | +1.4% | National, concentrated in Northeast, Pacific regions | Short term (≤ 2 years) |
| Growing Environmental Awareness and Corporate ESG/Sustainability Commitments | +0.9% | National, strongest in large metros and corporate hubs | Medium term (2-4 years) |
| Technological Advancements in Collection Systems, Sorting Automation, and Processing | +0.8% | National, with pilots clustering in CA, NY, TX, IL | Long term (≥ 4 years) |
| Circular Economy Adoption and Waste-to-Wealth Paradigm Shift | +0.6% | National, with cross-regional learning from EU and APAC | Long term (≥ 4 years) |
| Renewable Energy Incentives and Carbon Credit Monetization Opportunities | +0.5% | National, with enhanced uptake in CA under LCFS and RFS states | Medium term (2-4 years) |
| Source: Mordor Intelligence | |||
Stringent Government Regulations and Mandatory Organic Waste Diversion Laws
California's SB 1383 mandated a 75% reduction in organic waste disposal by 2025 versus a 2014 baseline. It required 20% edible food recovery, compelling every jurisdiction to provide organic waste collection services to residents and businesses [1]CalRecycle, “Guidance for Elected Officials on SB 1383,” CalRecycle, calrecycle.ca.gov . Jurisdictions are implementing curbside organics, edible food recovery contracting, and the procurement of recovered organic products to maintain compliance and avoid penalties, thereby creating steady demand for collection and processing capacity across cities and counties. Washington’s HB 2301 phases in organic waste diversion requirements for businesses through 2026 and sets firm timelines for residential curbside organics collection, standard bin colors, and product labeling controls to address contamination risks. Federal agencies are reinforcing this trajectory as the EPA, USDA, and FDA coordinate a national strategy to cut food loss and waste by 50% by 2030, which aligns with multistate action and gives municipalities a clear policy signal for program expansion in 2026. EPA’s SWIFR program guidance and USDA cooperative agreements provide funding to reduce execution risk for new curbside rollouts and upgrades to back-end infrastructure.
Rising Landfill Tipping Fees and Disposal Costs
Tipping fees for municipal solid waste disposal rose 10% nationally in 2024 to USD 62.28 per ton, with the Northeast showing the highest fees and the South Central the lowest, which tightens the economic case for organics diversion across high-cost markets. Waste-to-energy states paid 28% more for landfill disposal than non-WTE states, indicating that constrained disposal capacity alters price signals and accelerates the adoption of alternatives, such as organics collection and processing. As municipalities update contracts, the widening cost gap between traditional disposal and organics programs supports budget-neutral or savings-oriented pitches for new curbside organics service, especially in dense metros with scarce landfill options. International examples reinforce the same thesis as policy and pricing shift behavior when residents face meaningful cost differentials between gray-bin disposal and organics recycling. In 2026, this price environment continues to steer large commercial generators and municipalities toward organics collection contracts that reduce landfill exposure and future liability for disposal escalators.
Growing Environmental Awareness and Corporate ESG/Sustainability Commitments
Dozens of major companies have pledged to halve food loss and waste by 2030 through the 2030 Champions program, which puts sustained pressure on facility-level operations to divert organics and document outcomes through ESG reporting. Large haulers are aligning corporate climate targets with operational investments in organics, RNG facilities, and fleet technology that cut Scope 1 and 2 emissions, which supports long-cycle capital plans tied to organics growth. WM has expanded alternative fuel use and advanced projects that increase RNG supply for collection fleets, which integrate organics recovery with decarbonization pathways in transportation. Universities, hospitals, and corporate campuses are formalizing diversion in procurement and sustainability plans, which elevates demand for reliable collection services with verifiable data from bin-level systems and auditable manifests. In 2026, these commitments shape RFP criteria, vendor selection, and contract renewals, favoring providers capable of controlling contamination, delivering measurable outcomes, and providing transparent reporting across one or more sites.
Technological Advancements in Collection Systems, Sorting Automation, and Processing
Smart bins, RFID tagging, and real-time routing are reshaping route density and service cadence by enabling dynamic pickups based on fill levels and performance analytics. Field deployments using ultrasonic sensors and federated AI have reduced weekly driving distance and citizen complaints while protecting municipal data, which shows how blended sensing and analytics stabilize operations at scale. A 2025 meta-analysis across more than 10,000 deployments measured combined distance cuts of 21.5% and real-world reductions of 12.4%, which connects software investment and emissions outcomes to hard savings in fuel and vehicle wear. Sorting technology is also improving purity for materials adjacent to organics programs, as deep-learning enhancements in optical sorting achieve food-grade plastic recognition at greater than 95% purity, supporting higher-value end markets for compatible streams. Together, these tools underpin the 2026 operations playbook for the United States organic waste collection services market, where automation reduces labor intensity and supports better contamination management in both curbside and commercial settings.
Restraints Impact Analysis*
| Restraint | (~) % Impact on CAGR Forecast | Geographic Relevance | Impact Timeline |
|---|---|---|---|
| Limited Infrastructure Capacity for Organic Waste Processing and Treatment Facilities | -1.7% | National, acute in South, Southwest, Rocky Mountains | Short term (≤ 2 years) |
| High Capital and Operational Costs for Collection and Processing Systems | -1.2% | National, disproportionate burden on rural and low-density areas | Medium term (2-4 years) |
| Low Participation Rates in Residential and Commercial Collection Programs | -0.9% | National, with lower uptake in suburban and exurban markets | Medium term (2-4 years) |
| Insufficient Community Outreach, Education, and Behavior Change Programs | -0.5% | National, with gaps in environmental justice communities | Medium term (2-4 years) |
| Source: Mordor Intelligence | |||
Limited Infrastructure Capacity for Organic Waste Processing and Treatment Facilities
EPA’s national infrastructure assessment identifies a sizable funding requirement to expand composting and anaerobic digestion capacity, with USD 14-16 billion needed by 2030 to reach a projected national recycling rate of 61%. The funding envelope spans facility development, collection system expansion, and education, underscoring that collection growth depends on balanced investments across the chain rather than stand-alone projects. Capacity gaps are most acute in the South, Southwest, and Rocky Mountain regions, which underscores the need for targeted siting and permitting support where feedstock potential is high but facilities are sparse. In 2026, constrained throughput continues to limit new municipal rollouts and private contracts in several states, which slows diversion despite clear policy direction. Addressing this bottleneck requires blending public funding, procurement reforms, and private partnerships that bundle long-term feedstock commitments with data transparency to accelerate financing and delivery[2]U.S. Environmental Protection Agency, “Financial Assessment of U.S. Recycling System Infrastructure,” U.S. Environmental Protection Agency, epa.gov .
High Capital and Operational Costs for Collection and Processing Systems
Project delivery costs remain a headwind as municipalities and haulers transition to automated collection fleets and processing upgrades, which increase capital outlays for vehicles, RFID readers, and digital platforms that integrate route optimization and service analytics. Municipal budget studies in 2024 and 2025 show higher operating costs for transportation and disposal, which have required rate adjustments that can lengthen decision cycles for program expansion. Cities deploying electric refuse trucks detail funding stacks that combine federal incentives and state rebates to offset vehicle costs, yet planning for charging infrastructure and duty cycles still adds complexity to fleet transitions. Processing investments carry parallel burdens as operators add pre-processing, odor control, and advanced treatment for contaminants of concern, which require significant upfront spend and extended permitting timelines. In 2026, these cost realities continue to moderate the pace of scale-up in several communities, even as funding and policy catalysts support a forward build-out of the system.
*Our forecasts treat driver/restraint impacts as directional, not additive. The impact forecasts reflect baseline growth, mix effects, and variable interactions.
Segment Analysis
By Waste Type: Food Waste Leads as Collection Imperatives Converge
Food waste, including pre-consumer and post-consumer streams, is projected to grow the fastest, with a 5.9% CAGR from 2026 to 2031, as compliance deadlines and business thresholds tighten across major states. The United States organic waste collection services market benefits from SB 1383 requirements that make year-round food scrap collection a universal service, which establishes program continuity and a predictable volume base for haulers and processors[3]Washington State Legislature, “Engrossed Second Substitute House Bill 2301,” Washington State Legislature, lawfilesext.leg.wa.gov . Washington’s HB 2301 establishes tiered diversion thresholds for businesses and requires residential curbside organics collection on a set timetable, thereby supporting improvements in route density and equipment utilization over time. Pre-consumer food waste from commercial kitchens, institutional cafeterias, and processors offers higher tonnage density and lower contamination risk, which aligns with specialized service models and predictable pickups for large generators. Partnerships linking collection with anaerobic digestion have expanded as industry groups and operators coordinate feedstock sourcing to enable efficient conversion to biogas and digestate. Yard and landscape waste continued to hold the largest share at 70.9% in 2025, driven by the long-standing maturity of municipal programs. However, incremental growth is limited by demographic shifts and the rise of multi-family housing, where yard generation is lower.
In 2026, residential post-consumer food waste collection gains coverage in major metros through policy mandates and voluntary rollouts, expanding household access and building familiarity with source separation over time. Agricultural Residues remain a smaller share, as many materials are managed on-site or move through specialized brokers into nutrient and energy pathways that are not always visible to municipal systems. Others, including biosolids and industrial organics, grow steadily as compliance frameworks and beneficial use standards drive consistent processing routes that reduce landfill exposure and produce marketable outputs. The United States organic waste collection services market will continue to shift toward higher food waste penetration as education, contamination controls, and equipment upgrades improve performance at scale. Food waste’s contribution to the United States organic waste collection services market size is reinforced by transparent reporting expectations in corporate ESG programs that reward verifiable diversion at the facility level.



By End-User: Commercial Food Service Outpaces Residential in Diversion Intensity
Residential held a 58.9% share in 2025 due to the scale of curbside participation and the broad adoption of bin systems that integrate organics into routine service for single-family and multi-family households. Commercial food service, including restaurants and hospitality, is the fastest-growing end-user, with a 6.2% CAGR through 2031, driven by compliance thresholds and internal sustainability goals that require measurable diversion and contamination controls. SB 1383 assigns edible food recovery duties to large generators and mandates recordkeeping, thereby increasing formal contracting and supporting consistent collection schedules for pre-consumer streams with lower contamination profiles[4]City of Palo Alto, “SB 1383 Requirements,” City of Palo Alto, paloalto.gov . The United States organic waste collection services market benefits as corporate campuses, universities, and hospitals scale programs that integrate back-of-house separation, training, and service-level feedback loops. Industrial generators, particularly food and beverage processors, tend to favor anaerobic digestion pathways that efficiently handle high-strength organics while producing energy and nutrient co-products.
In 2026, the United States organic waste collection services industry is seeing end-users place greater weight on service reliability, data transparency, and contamination mitigation to meet internal targets and external reporting needs. Documentation of diversion and edible food recovery has become a meaningful differentiator in vendor selection, which elevates haulers that can integrate RFID-enabled bin tracking, lift counts, and weight data into customer dashboards. Residential programs continue to mature with education, standardized bin colors, and service reminders that aim to increase participation and reduce contamination over time. Commercial growth remains strongest in dense corridors, where multi-location chains can rationalize service contracts and capture operational savings at scale as landfill fees and surcharges rise. Across end-users, long-term contracting with clear performance metrics and service-level feedback is becoming standard practice in 2026.
By Collection Method: Automation Drives Door-to-Door Efficiency and Gains
Door-to-Door Collection held a 72.7% share in 2025 and is also projected to grow the fastest, at a 6.8% CAGR to 2031, reflecting strong municipal preferences for route continuity and automated lifting to enhance safety and productivity. The United States organic waste collection services market continues to adopt side-loader and automated systems where streets and housing density permit, which supports single-operator routes and consistent capture rates. Electric refuse trucks have demonstrated early viability in city fleets, backed by grants and utility partnerships that help cities manage total cost and charging logistics. In 2026, drop-off and bring systems remain important for rural, campus, and early-stage initiatives, although they typically deliver lower per-capita tonnage capture than curbside systems in mature programs. Other collection methods, including centralized drop-off at transfer stations and community collection points, continue to play a supporting role as education and access points that prime neighborhoods for future curbside adoption.
Semi-automated models offer a practical bridge in narrow streets and legacy neighborhoods that are not well-suited to full automation, which allows municipalities and haulers to phase upgrades along natural fleet replacement cycles. Manual collection persists in select routes and building types where bin geometry or site access limit vehicle compatibility, although workforce and safety concerns drive a steady migration toward automation where feasible. The United States organic waste collection services industry is prioritizing route analytics that optimize miles per lift and lifts per hour while minimizing idle time and non-productive miles. Cities adding electric fleets are expanding institutional learning on route scheduling, battery range, and the benefits of regenerative braking in stop-and-go service, which is informing procurement specifications for future orders. Across collection methods, the focus in 2026 is on combining standardized education, bin color harmonization, and digital engagement to sustain participation gains and improve contamination outcomes.
Geography Analysis
The United States anchors North American organics diversion due to policy alignment, population density, and the scale of public and private operators capable of executing curbside and commercial programs at the city and regional levels. In 2026, California, New York, Texas, Florida, and Washington lead by tonnage due to a blend of mandates and municipal capacity, which anchors steady demand for residential and commercial organics collection. SB 1383 is a primary driver that requires universal organics service and edible food recovery, which cements collection demand and drives procurement of recovered organic products in public purchasing. Los Angeles County’s program builds on these requirements through customer-facing education and enforcement frameworks that ensure generators subscribe to organics service and, when applicable, food recovery.
The United States organic waste collection services market posted historical growth at 4.9% through 2025 and is projected to grow at 5.09% through 2031 as enforcement matures and collection coverage expands in high-priority corridors. Disposal pricing differentials remain a major geographic factor, with the Northeast posting the highest landfill tipping fees in 2024 and the South Central the lowest, which sharpens the financial case for organics collection in high-cost states. In 2026, city agencies are standardizing bin colors and labels to reduce confusion and contamination, which is expected to lift participation and improve stream quality across neighborhoods. The United States organic waste collection services market size remains underpinned by grants and incentives for organics and recycling infrastructure that crowd in private capital for transfer, preprocessing, and digestion projects.
Geographic white space persists in the South, Southwest, and Rocky Mountain regions, where EPA identifies high potential but limited infrastructure, offering near-term opportunities for bundled procurement and public-private partnerships. Cities deploying early electric refuse fleets are building operational knowledge on routing, range, and charging, which informs specifications and contract structures for the next wave of vehicles. Wastewater utilities that integrate co-digestion and RNG pathways increase regional resilience by creating local outlets for food waste slurries and biosolids while contributing to a low-carbon fuel supply. State procurement mandates and recovered product targets further align municipal purchasing with organics processing outputs, which tightens the regional circular economy around compost and renewable fuel products.
Competitive Landscape
The United States organic waste collection services market is fragmented in nature. Competitive intensity is notable in large metros where integrated providers operate end-to-end assets. At the same time, regional and community-scale operators compete on service quality and local relationships in secondary markets. Republic Services processed significant volumes of organics in 2025 and commissioned multiple RNG facilities, which support dual revenue streams from diversion and renewable fuel credits. Waste Connections operated composting centers and continued to invest in RNG facilities, increasing biogas recovery from its baseline and expanding capacity to absorb organic feedstocks as collection volumes grew. Synagro expanded composting throughput and advanced treatment at multiple facilities, which enhances its ability to serve biosolids and food waste customers with consistent product quality. The United States organic waste collection services market continues to reward operators that combine collection efficiency, contamination management, and secure offtake to deliver predictable value across contracts.
Technology is now a core differentiator in route optimization, contamination detection, and customer engagement. Asset-level sensors and AI models underpin dynamic scheduling and contamination alerts that stabilize service and reduce missed pickups for commercial and municipal customers. Route analytics platforms enable serviceability mapping and proximity-based prospecting, boosting route density while lowering per-stop costs, supporting profitable scale in competitive corridors. Cities deploying early electric refuse trucks, supported by grants and utilities, are demonstrating operational feasibility and setting procurement templates that others can adapt in 2026. The United States organic waste collection services market is thus converging on integrated, data-driven models where operations, reporting, and customer experience are tied into a single performance stack.
Regulatory compliance and contamination control are reshaping investment priorities in 2026. Waste Connections and Synagro report investments in treatment solutions that address contaminants of concern and support the continued beneficial use of processed outputs, thereby raising the operational bar for entrants. WM continues to add RNG capacity and modernize facilities under a multi-year program that expands end markets and integrates fleet fueling with organics management. Fuel providers are signing new agreements to support refuse fleets running on RNG, which strengthens the commercial foundation for digestion projects that rely on steady offtake and credit monetization. These strategic moves suggest sustained competition, with scaled providers pairing asset depth with digital capabilities to win long-term contracts in dense corridors.
United States Organic Waste Collection Services Industry Leaders
Waste Management, Inc. (WM)
Republic Services
Waste Connections
Denali
Recology
- *Disclaimer: Major Players sorted in no particular order

Recent Industry Developments
- February 2026: Synagro Technologies and Sedron announced a strategic partnership to supply biosolids from Synagro’s Florida customers to Sedron’s Indiantown Upcycling Facility, which will use the patented Varcor system to convert waste into carbon-negative electricity.
- November 2025: Denali and Green Era partnered to advance community-driven food recycling in Chicago, with Denali serving as Green Era’s primary provider for sourcing packaged, inedible food waste.
- October 2025: Mill Industries and Compost Crew announced a partnership to launch a new food recycling service across Maryland, Northern Virginia, and Washington, D.C., pairing the Mill food recycler with scheduled pickups.


United States Organic Waste Collection Services Market Report Scope
The United States Organic Waste Collection Services Market Report is Segmented by Waste Type (Food Waste, Yard & Landscape Waste, and more), End-User (Residential, Commercial, and more), Collection Method (Door-to-Door Collection, Drop-Off / Bring Systems, and Others), and Technology & Equipment (Manual Collection, Semi-Automated, and more). The Market Forecasts are Provided in Terms of Value (USD) and Volume (Tons).
| Food Waste |
| Yard & Landscape Waste |
| Agricultural Residues |
| Others |
| Residential |
| Commercial Food Service |
| Industrial (Food Processing & Manufacturing) |
| Others (Agri-waste) |
| Door-to-Door Collection |
| Drop-Off / Bring Systems |
| Others |
| Manual Collection Systems |
| Semi-Automated Systems |
| Fully Automated Systems |
| Others |
| By Waste Type | Food Waste |
| Yard & Landscape Waste | |
| Agricultural Residues | |
| Others | |
| By End-User | Residential |
| Commercial Food Service | |
| Industrial (Food Processing & Manufacturing) | |
| Others (Agri-waste) | |
| By Collection Method | Door-to-Door Collection |
| Drop-Off / Bring Systems | |
| Others | |
| By Technology & Equipment | Manual Collection Systems |
| Semi-Automated Systems | |
| Fully Automated Systems | |
| Others |


Key Questions Answered in the Report
What is the projected CAGR for the United States organic waste collection services market from 2026 to 2031?
The United States organic waste collection services market is projected to grow at a 5.09% CAGR from 2026 to 2031.
Which waste type leads and which grows fastest in this market?
Yard and Landscape Waste led with 70.9% share in 2025, while Food Waste is forecast to grow the fastest at a 5.9% CAGR through 2031.
Which end-user segment is expanding the quickest?
Commercial Food Service is the fastest-growing end-user, projected at a 6.2% CAGR through 2031, supported by compliance thresholds and ESG goals.
What collection method dominates the United States organic waste collection services market today?
Door-to-Door Collection dominates with a 72.7% share and is also the fastest-growing method, with a 6.8% CAGR to 2031.
Which technology category holds the largest share?
Fully Automated Systems hold a 56.2% technology share and are projected to grow at a 7.3% CAGR through 2031.
What policies are most influential for growth in 2026?
California’s SB 1383, Washington’s HB 2301, and the federal National Strategy for Reducing Food Loss and Waste anchor growth by mandating service, standardizing containers, and funding infrastructure.
Page last updated on:






