North America Municipal Solid Waste Management Market Size and Share
Market Overview
| Study Period | 2020 - 2031 |
|---|---|
| Forecast Data Period | 2026 - 2031 |
| Historical Data Period | 2020 - 2024 |
| Market Size (2026) | USD 118.81 Billion |
| Market Size (2031) | USD 147.92 Billion |
| Growth Rate (2026 - 2031) | 4.48% CAGR |
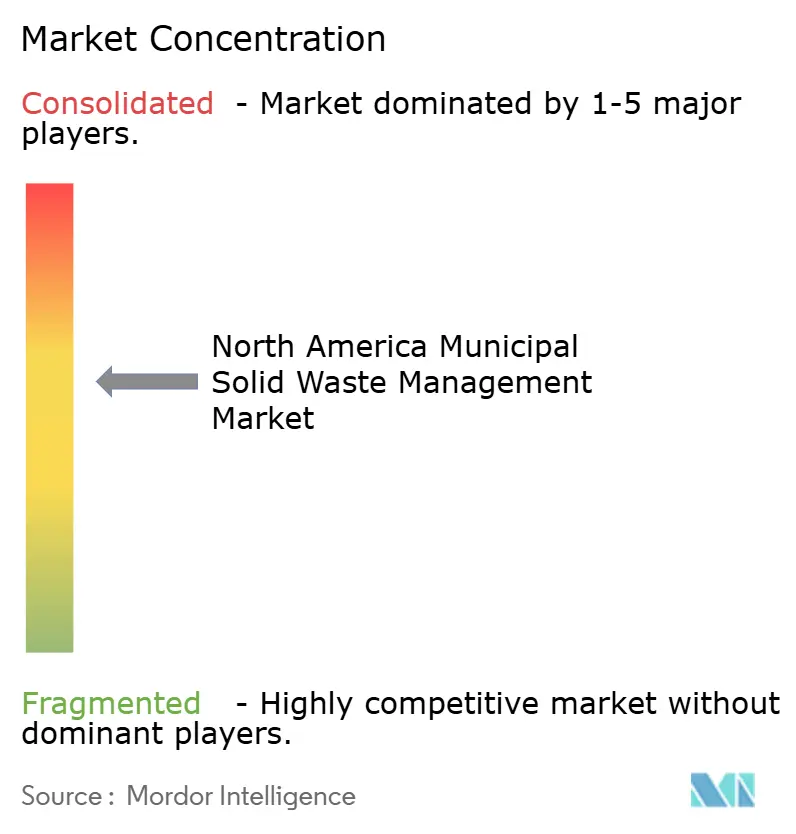
| Market Concentration | Medium |
Major Players *Disclaimer: Major Players sorted in no particular order Image © Mordor Intelligence. Reuse requires attribution under CC BY 4.0. | |

North America Municipal Solid Waste Management Market Analysis by Mordor Intelligence
The North America Municipal Solid Waste Management market size is USD 118.81 billion in 2026 and is projected to reach USD 147.92 billion by 2031, reflecting a 4.48% CAGR. Momentum reflects policy and price signals that favor diversion infrastructure, including state packaging EPR programs, landfill methane controls, and incentives that support Renewable Natural Gas and advanced sorting, which together are changing how value is captured across the waste stream. Rising landfill tipping fees in dense U.S. metros, combined with provincial and federal actions in Canada to curb methane emissions, are pushing capital toward composting, anaerobic digestion, and gas-to-energy systems that monetize compliance through credits and stable processing fees. The Inflation Reduction Act’s production tax credit for landfill gas and related clean fuel provisions, together with state-level rules, are accelerating project pipelines and expanding the role of vertically integrated operators with RNG roadmaps and MRF automation agendas[1]U.S. Environmental Protection Agency, “Basic Information About Landfill Gas,” U.S. Environmental Protection Agency, epa.gov. Competitive dynamics favor scale, with leading companies linking pricing, capital programs, and ESG targets as a way to reduce earnings volatility tied to commodity values while deepening contract resilience.
Key Report Takeaways
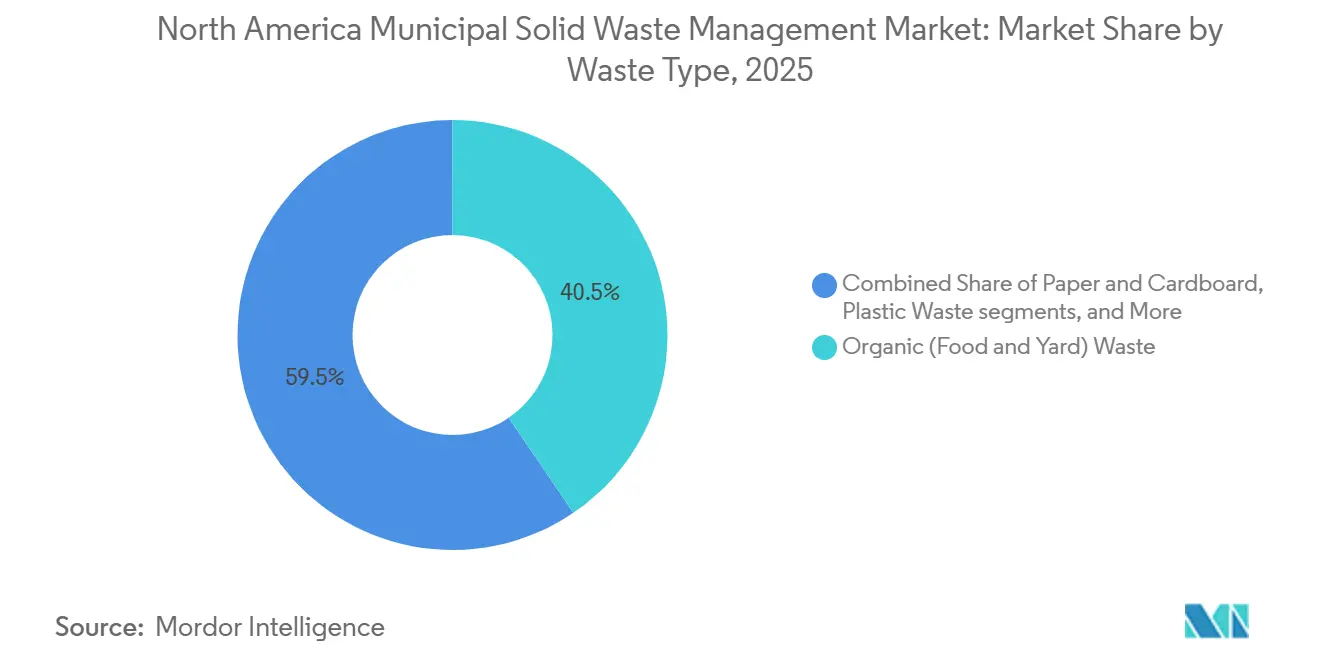
- By waste type, organic waste led with a 40.5% share in 2025, while e-waste is projected to expand at a 6.7% CAGR through 2031.
- By source, residential buildings held a 48.6% share in 2025, and commercial generators are forecast to grow at a 5.8% CAGR through 2031.
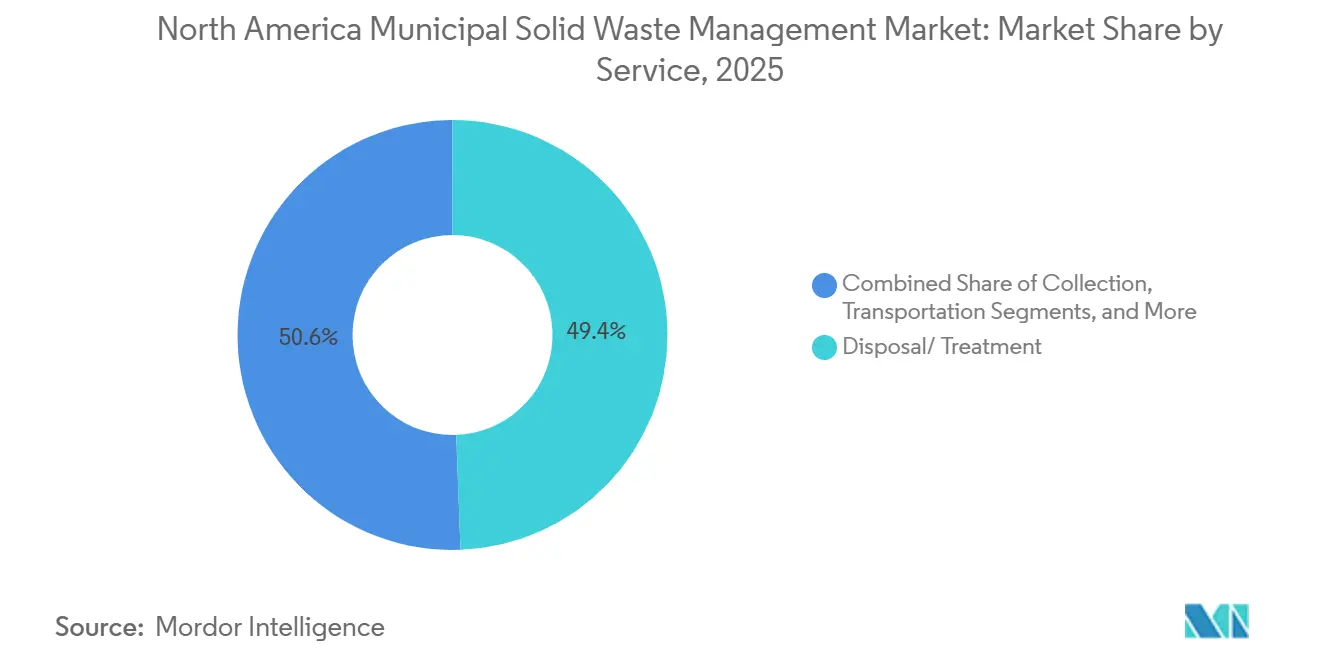
- By service, disposal and treatment accounted for a 49.4% share in 2025, while recycling and material recovery are advancing at an 8.4% CAGR through 2031.
- By geography, the United States held a 75.5% share in 2025, and Mexico is the fastest growing at a 7.7% CAGR through 2031.
Note: Market size and forecast figures in this report are generated using Mordor Intelligence’s proprietary estimation framework, updated with the latest available data and insights as of January 2026.
Worldwide, activity is shaped by contributions from multiple regions, with North america representing one of the more structurally developed among them. The global report on municipal solid waste management market by Mordor Intelligence reflects how these regional layers combine into a single system.
North America Municipal Solid Waste Management Market Trends and Insights
Drivers Impact Analysis*
| Drivers | (~) % Impact on CAGR Forecast | Geographic Relevance | Impact Timeline |
|---|---|---|---|
| Aggressive recycled-content minimums in state packaging laws are taking effect in 2026 | +1.2% | U.S. core (CA, OR, CO, ME), spill-over to Canada | Medium term (2-4 years) |
| Federal Clean Methane standards and IRA tax credits are accelerating landfill-gas-to-RNG projects | +0.9% | U.S. primary, Canada federal methane regulations parallel | Long term (≥ 4 years) |
| Expansion of EPR mandates into electronics and textiles across U.S. states and Canadian provinces | +0.8% | North America-wide, with Canada covering 99.9% of the population | Medium term (2-4 years) |
| Escalating landfill tipping fees, surpassing USD 100 per ton in major metros | +0.7% | Northeast U.S. core, secondary pressure in the Midwest, and the West | Short term (≤ 2 years) |
| RFID-enabled pay-as-you-throw pricing is cutting household waste volumes | +0.5% | U.S. municipal pilots, early adoption in progressive metros | Medium term (2-4 years) |
| Sustainability-linked loans and bonds tying interest rates to diversion performance | +0.4% | North America-wide, concentrated among Fortune 1000 waste haulers | Long term (≥ 4 years) |
| Source: Mordor Intelligence | |||
Aggressive recycled-content minimums in state packaging laws are taking effect in 2026
State-level packaging policies are pushing producers to fund collection and sorting upgrades, while setting recycled-content and recyclability requirements that tighten over time. Producer Responsibility Organizations are providing fee-for-service revenue that is less exposed to commodity swings, which in turn supports MRF modernization and automation across high-volume programs[2]Association of Plastic Recyclers, “EPR for Packaging Laws,” Association of Plastic Recyclers, plasticsrecycling.org. Operators are scaling capital programs to match the compliance timeline, with leading firms disclosing multi-year recycling infrastructure expansions that increase throughput and improve fiber and plastics purity rates. California and other jurisdictions are moving forward with systems that require recyclable or compostable packaging formats, which tighten specifications and reduce contamination at the curb. The cumulative effect is a durable transition from commodity-heavy revenue models to processing fees and contracted services that make cash flows steadier for recycling operators. This structural shift is reinforcing the role of integrated haulers and MRF owners who can deploy capital at scale and navigate diverse state rules across large operating footprints.
Federal Clean Methane standards and IRA tax credits are accelerating landfill-gas-to-RNG projects
Municipal solid waste landfills are among the largest sources of methane, and updated standards are expected to expand gas collection and monitoring requirements, which raises capture rates and improves the economics for gas-to-energy conversions. The Inflation Reduction Act’s production tax credit and related incentives lower the cost of capital for landfill gas-to-power, while the clean fuel provisions increase the value of pipeline-quality RNG, creating strong project pipelines across large networks. The number of operational RNG facilities in North America continued to rise in 2025, and industry groups project further growth through the decade as feedstock from landfills and organics facilities is connected to markets under stable offtake arrangements. Leading waste operators disclosed multiple new RNG projects entering service in 2024 and 2025, building toward network targets that position RNG as a core earnings driver alongside traditional landfill operations. In Canada, proposed federal regulations target significant cuts in landfill methane emissions by 2030 relative to 2019, which further supports capture investments and strengthens the compliance case for gas-to-energy upgrades[3]Government of Canada, “Regulations Respecting the Reduction in the Release of Methane (Waste Sector),” Canada Gazette, gazette.gc.ca. State and provincial actions, combined with federal incentives, are therefore aligning technical requirements with financial support, which is expanding the scope of projects that pencil under long-dated contracts.
Expansion of EPR mandates into electronics and textiles across U.S. states and Canadian provinces
Electronics stewardship is advancing as states implement or expand EPR programs, with battery-embedded devices added to compliance regimes that fund free drop-off and collection systems for consumers. California’s fee on battery-embedded products took effect in 2026, which increases recovery of smartphones, laptops, and wearable devices while reducing fire and contamination risks in traditional curbside systems. National guidance on battery collection best practices is in development to support safer and more standardized handling across chemistries and sizes, and that guidance is expected to shape program design in the states over the near term. Across Canada, packaging EPR rollouts provide a template for broader producer responsibility frameworks that can be extended to additional material streams as provincial systems mature. Municipal agencies have also begun to plan for textile recovery within broader diversion strategies, which signals an expansion in EPR program scope that would bring new categories under producer-funded systems over time. As these programs grow, producers will rely more on PROs to finance collection and sorting, which channels stable fees to operators and supports specialized processing capacity for electronics and other hard-to-handle streams.
Escalating landfill tipping fees, surpassing USD 100 per ton in major metros
Tipping fees have risen in large U.S. metros where landfill capacity is tight, and select Northeast markets report fees that surpass USD 100 per ton, which narrows the cost gap with composting, anaerobic digestion, and MRF-based diversion. Rising disposal costs are also reinforced by evolving methane rules, which increase compliance expenses but strengthen the case for gas capture and beneficial use investments that monetize the waste stream. Municipalities are using fee adjustments to fund asset upgrades, such as gas-to-energy conversions that extend landfill life and reduce net greenhouse gas emissions while improving the revenue profile of the disposal site. In Canada, proposed landfill methane regulations would add compliance costs that are expected to be passed through in tipping fees, which creates a similar incentive alignment for diversion and capture projects. The combined pricing and policy movement is setting a clearer economic preference for organics diversion and advanced recycling, especially in regions with congestion and limited disposal alternatives. Over time, these conditions support network densification in transfer, MRF, and organics facilities near capacity-constrained metro areas.
Restraints Impact Analysis*
| Restraints | (~) % Impact on CAGR Forecast | Geographic Relevance | Impact Timeline |
|---|---|---|---|
| High borrowing costs and municipal debt ceilings are delaying new MRF and WtE investments | -0.4% | U.S. and Canada, with regional variation by bond-market access | Medium term (2-4 years) |
| Volatile recyclate commodity prices are undermining revenue predictability | -0.3% | North America-wide, with exposure concentrated in non-EPR states | Short term (≤ 2 years) |
| Supply-chain bottlenecks for optical sorters, collection trucks, and replacement parts | -0.3% | U.S. manufacturing centers, Prairie Provinces, and Mexico border zones | Short term (≤ 2 years) |
| PFAS contamination concerns restricting land application of compost and digestate | -0.2% | U.S. primary with state-level patchwork, early spillover to Canada | Long term (≥ 4 years) |
| Source: Mordor Intelligence | |||
High borrowing costs and municipal debt ceilings are delaying new MRF and WtE investments
Higher interest expenses have constrained municipal and provincial borrowing capacity, which lengthens approval timelines for greenfield MRFs and waste-to-energy facilities and shifts attention to incremental retrofits. Ontario’s 2025–26 budget documents show a significant debt service burden, which illustrates how rate sensitivity can pull resources away from new solid waste projects in favor of essential water and sewer needs. Green bond programs in major cities have experienced higher coupon levels relative to earlier years, raising the cost of financing upgrades at waste facilities and landfill gas capture systems. Federal grants and revolving funds partially offset the gap, but limited headroom and tight credit conditions increase the bar for project economics, especially when markets require contracted revenues to support debt service. In this context, sustainability-linked bonds that tie interest rates to diversion performance are gaining traction among large issuers and operators, while smaller regional firms face higher premiums that can hinder facility builds without public-private structures. The financing environment, therefore, acts as a pacing item for capacity additions and accelerates consolidation among players that can fund projects at lower rates.
Volatile recyclate commodity prices are undermining revenue predictability
Recovered fiber and plastics prices have been volatile since 2024, which complicates cash flow planning for MRFs that rely heavily on commodity sales rather than contracted processing fees. Average bale values reported by regional recycling networks moved lower in early 2024, putting pressure on facilities with higher operating costs and weaker contamination control. In response, large operators are emphasizing processing fees and long-term contracts to dampen earnings volatility tied to market prices for OCC, mixed paper, and recycled polymers. This volatility can deter investment in advanced sorting equipment if payback models depend on sustained high bale prices, leading developers to seek fee-backed offtake arrangements before committing capital. North American and global resin capacity expansions also weigh on recycled polymer prices at times, which further supports the shift to fee-based models under EPR systems. The net effect is a more cautious capacity buildout unless revenue certainty is available through producer-funded programs or municipal contracts.
*Our forecasts treat driver/restraint impacts as directional, not additive. The impact forecasts reflect baseline growth, mix effects, and variable interactions.
Segment Analysis
By Waste Type: E-Waste Mandates Accelerate Electronics Recovery Amid Organic-Waste Dominance
Organic waste held the largest share at 40.5% in 2025, reflecting the central role of food and yard waste in municipal diversion systems and the focus of state and city policies on mandatory organics separation. The North America Municipal Solid Waste Management market share for organics highlights the importance of composting and anaerobic digestion in meeting landfill diversion targets across large jurisdictions. State packaging EPR programs and local rules are pushing producers and municipalities to fund pre-processing and cleaner collection streams, which improves feedstock quality for organics processing and reduces contamination in recyclables. Electronics recovery is gaining momentum as battery-embedded products come under fee-based systems that fund free consumer drop-off and safer handling, which reduces fire risks at MRFs and transfer stations. National best-practices guidance from the U.S. EPA supports harmonized battery collection and sorting, which can improve safety and throughput as states expand covered product lists. For operators, fee-backed e-waste programs offer stable revenue compared with commodity-dependent streams, accelerating capital plans for electronics aggregation and specialized processing within integrated networks.
E-waste is the fastest-growing waste type at a 6.7% CAGR through 2031, driven by device turnover, embedded batteries, and producer-funded systems that scale consumer access and convenience. As municipal programs expand, operators increasingly reference ISO 14001 and data-destruction certifications in bids for electronics stream handling, which aligns with corporate and public sector procurement standards tied to data protection and environmental management. Glass and mixed cullet face weaker demand in several regions, which narrows processing margins and encourages design-for-recycling initiatives under packaging EPR. Plastics and metals remain core materials with well-established markets, but volatility in recycled polymer pricing reinforces the shift toward processing fees in EPR jurisdictions. The North America Municipal Solid Waste Management industry will continue to prioritize organics and electronics as anchor streams for investment because those categories offer the clearest alignment of policy, safety, and economics across the forecast period.


By Source: Commercial Generators Outpace Residential Growth
Residential sources held a 48.6% share in 2025, reflecting the breadth of curbside programs and the central role of household collection in municipal service contracts. Technology-enabled routing and PAYT programs are being adopted within residential service areas to reduce contamination, improve route density, and connect per-household metrics to education and enforcement where organics separation is mandatory. Commercial generators are expected to grow fastest at a 5.8% CAGR, reflecting corporate diversion commitments and the impact of organics rules that require businesses to separate food waste for composting or digestion. Municipal pricing structures that set lower rates for recycling and organics relative to trash are also accelerating commercial source separation, which increases demand for multi-stream collection and recovery services. As labor markets remain tight, fleet telematics and RFID data support scheduling that maintains service quality while reducing route miles per stop in both residential and commercial zones.
Institutional generators and municipal services expand more slowly due to budget cycles and staffing constraints, but they benefit from federal programs and grants directed at recycling and organics infrastructure. The National Strategy for Reducing Food Loss and Waste and Recycling Organics includes funding that supports local initiatives and education, which helps agencies refresh equipment and boost participation in public buildings and schools. Event-driven spikes from storms or special collection campaigns continue to shape quarterly volumes, but long-run trends point to steadier capture under contracting structures that reward performance and data transparency. The North America Municipal Solid Waste Management industry is therefore leaning on data, pricing, and education to manage residential plateaus while capturing faster growth from commercial accounts with clear zero-waste goals and defined material profiles. As these dynamics mature, opportunities grow for specialized service bundles that integrate collection, recycling, organics, and reporting under multi-year commercial agreements.
By Service: Fee-Based Recycling Outpaces Traditional Disposal
Disposal and treatment processes held a 49.4% share in 2025, reflecting the ongoing centrality of landfills and energy recovery facilities in regional networks. Recycling and material recovery are the fastest growing service at an 8.4% CAGR, supported by EPR funding that converts a commodity-dependent activity into contracted processing that stabilizes cash flows regardless of bale prices. Producers are paying fees that finance sorting and quality improvements, which reduce contamination and lift recovery rates for high-demand resins and fiber grades. Operators also report a rising mix of processing fees in recycling revenues, which reduces earnings volatility and supports multi-year automation investments in sorting lines. RNG development ties disposal and recycling economics together by monetizing methane through credits and offtakes, which creates another path to value for integrated companies that build and operate gas collection systems.
Collection, transport, segregation, and pre-processing continue to grow at the baseline pace of the North America Municipal Solid Waste Management market, with analytics used to improve route density and service reliability while lowering fuel and overtime costs. Organics services benefit from state and city mandates that require separation at the source, which is expanding composting and anaerobic digestion capacity with funding from grants and municipal programs. Energy recovery remains a core outlet in regions where landfills are constrained, and transportation costs are high, and landfill gas upgrades to RNG continue to add capacity at large operator networks. Ancillary services such as waste audits and ESG reporting integrate with collection and processing, as commercial customers seek verified data for climate and circularity disclosures. The North America Municipal Solid Waste Management market size for recycling-linked services is therefore poised to expand alongside EPR fee inflows and RNG offtakes that diversify revenue beyond landfill gate rates.
Geography Analysis
The United States accounted for 75.5% of the North America Municipal Solid Waste Management market in 2025, supported by integrated networks of landfills, transfer stations, MRFs, and organics facilities that serve most major metro areas. The North America Municipal Solid Waste Management market share held by the U.S. reflects higher per capita generation, denser service footprints, and earlier adoption of EPR and organics programs in large coastal states relative to other geographies in the region. The Northeast reports the highest disposal fees in the country, with select metros surpassing USD 100 per ton, which pushes materials toward advanced recycling and organics processing as the economics of diversion improve at the margin. State EPR laws on packaging and organics mandates, particularly in California and the Pacific Northwest, further raise capture rates and support investment in MRF modernization and composting capacity. Municipal programs are increasingly using price signals and data-sharing requirements in contracts to lower contamination and improve landfill diversion over the contract term. Landfill gas capture and RNG deployments are scaling in multiple states under federal incentives and state programs, which contribute a growing share of energy revenues to large operators.
Canada represents a mid-teens share of the North America Municipal Solid Waste Management market and stands out for EPR coverage of residential packaging across nearly the entire population as provincial systems roll to producer control. Provinces are implementing or enhancing EPR frameworks that shift financial responsibility for packaging from municipalities to producers under common program standards, with British Columbia operating a mature model that continues to inform national harmonization efforts. Federal action continues to build the data backbone for national circularity planning, with the Plastics Registry launching first-cycle reporting that requires disclosure of key metrics, including post-consumer recycled content and product flows. Proposed national landfill methane regulations target significant reductions in emissions by 2030 relative to 2019, which supports landfill gas capture upgrades and RNG projects that align with provincial decarbonization pathways. Municipal green bonds earmark funds for landfill gas capture and diversion infrastructure, which ties financing to performance targets and increases transparency to investors. These elements reinforce diversion capacity growth and stabilize processor revenues under producer-funded systems.
Mexico is the fastest-growing geography at an expected 7.7% CAGR from 2026 to 2031, reflecting urbanization and infrastructure buildout that expand organized collection and processing. The market is characterized by a mix of formal and informal recovery channels, and growth is tied to municipal investment in transfer, landfill, and MRF capacity as service coverage expands in large cities and industrial corridors. Tipping fees are lower than in the U.S. and Canada, which influences the pace and mix of advanced recycling and energy recovery investments as developers assess project returns under current pricing. Over the forecast, the expansion of formal systems creates new entry points for integrated operators and local partners to build capacity in collection, logistics, and processing. These dynamics underpin Mexico’s role as the region’s growth outlier within the North American Municipal Solid Waste Management market.
Mordor Intelligence provides coverage of the global municipal solid waste management market across other key regional markets, including Europe and Asia, each with their regulatory frameworks and demand patterns. Detailed country-level analysis extends to India incorporating local coverage and market participation, as required.
Competitive Landscape
Consolidation remains a defining feature of the North America Municipal Solid Waste Management market, with national leaders using scale to secure disposal capacity, advance automation, and integrate diversion assets into long-term contracts. Waste Management completed the acquisition of Stericycle in November 2024, adding regulated medical waste and secure information destruction capabilities that deepen customer relationships across healthcare and other regulated segments. Veolia announced an agreement to acquire Clean Earth in November 2025, with closing targeted for mid-2026, which will make the firm a top hazardous waste player in the United States and increase its North American footprint. GFL Environmental announced the sale of its Environmental Services business in March 2025 and repositioned as a solid waste pure-play, using proceeds to reduce leverage and repurchase shares while prioritizing capital for landfill densification and recycling. These moves align with a multi-year transition toward contracted, fee-based recycling and RNG projects that lower commodity exposure and create new growth avenues.
Technology deployment is central to cost control and service quality as operators pursue route optimization, MRF automation, and customer-facing digital tools. Major haulers have rolled out dashboards that connect material volumes to emissions metrics and performance targets for commercial customers, which strengthens ESG reporting and contract retention. Republic Services’ focus on integrated circularity includes polymer processing capacity in Indianapolis and planned facilities that supply high-purity recycled PET for packaging, which supports packaging EPR objectives for recycled content. RNG development is a shared priority across large operators, with facilities commissioned in 2024 and 2025 and dozens in development as pipeline projects move toward commercial operation. EPR fee structures and municipal pricing models are reinforcing these investments by anchoring offtake and processing economics.
New entrants and specialists continue to find opportunities in specific niches even as national players expand. Reworld, formerly Covanta, reported expansion and rebranding that emphasize conversion of waste to value across its portfolio, which aligns with tightening landfill capacity and local sustainability goals. Municipal issuers are also shaping the field through green bond programs that dedicate proceeds to RNG and diversion infrastructure, which creates demand for project developers and technology providers that can meet performance-linked financing conditions. At the same time, extended lead times for key MRF equipment and truck platforms are pushing buyers to pre-order and deepen supplier relationships, which favors larger operators with centralized procurement and access to multiple vendors. These conditions suggest competition will remain most intense where disposal capacity, organics mandates, and EPR fee flows overlap, since those geographies reward integrated service offerings under multi-year contracts.
North America Municipal Solid Waste Management Industry Leaders
Waste Management Inc.
Republic Services Inc.
Waste Connections Inc.
GFL Environmental Inc.
Veolia North America
- *Disclaimer: Major Players sorted in no particular order

Recent Industry Developments
- January 2026: California’s battery-embedded product fee took effect, funding free recycling and improving safety in collection and processing systems.
- January 2026: Ontario completed the Blue Box transition to full producer responsibility, shifting operational and financial control for residential packaging recovery to Producer Responsibility Organizations.
- November 2025: Veolia announced an agreement to acquire Clean Earth, with closing targeted for mid-2026, expanding hazardous waste capabilities in the United States.
- July 2025: Republic Services began commercial production at its Indianapolis Polymer Center, supplying high-purity recycled PET for food-grade packaging.


Research Methodology Framework and Report Scope
Market Definitions and Key Coverage
Mordor Intelligence defines the North American municipal solid waste management (MSW) market as the organized collection, transfer, processing, material recovery, energy recovery, and final disposal of household-like wastes generated by residential, commercial, and institutional sources across the United States, Canada, and Mexico. Values are expressed in USD and capture service revenues as well as gate-fee income.
Scope exclusion: Construction and demolition debris, hazardous industrial residues, and liquid sludges fall outside this study's boundary.
Segmentation Overview
- By Waste Type
- Organic (Food & Yard) Waste
- Paper & Cardboard
- Plastic Waste
- Metal Waste
- Glass Waste
- E-Waste
- Textiles & Leather
- Others (Rubber, wood, etc.)
- By Source
- Residential
- Commercial (Office, Retail, etc.)
- Institutional
- Municipal Services (Street Cleaning, Parks, etc.)
- Construction & Demolition
- By Service
- Collection, Transportation, Segregation & Pre-Processing
- Disposal / Treatment Method
- Recycling & Material Recovery
- Composting
- Anaerobic Digestion
- Energy Recovery (WtE / RDF / Biogas)
- Landfilling
- Others (Incineration without Energy Recovery, MBT)
- Ancillary and Support Services (Auditing, Consulting, Smart Waste Solutions, Etc.)
- By Geography
- United States
- Northeast US
- Midwest US
- South US
- West US
- Canada
- Atlantic Canada
- Central Canada (Ontario, Quebec)
- Prairie Provinces
- West Coast (British Columbia)
- Northern Territories
- Mexico
- North Mexico
- Central Mexico
- South & Yucatán Peninsula
- United States
Detailed Research Methodology and Data Validation
Primary Research
Structured interviews with public-works officers, private haulers, landfill operators, recycler associations, and WtE engineers across various states and Canadian provinces provided live price points, diversion targets, and capex plans that grounded key assumptions and clarified regulatory timelines.
Desk Research
Our analysts reviewed statutory data sets from the US EPA, Environment & Climate Change Canada, and Mexico's INEGI alongside trade releases from the Solid Waste Association of North America. We parsed company 10-Ks, landfill tariff filings, municipal bid documents, and news feeds in Dow Jones Factiva. D&B Hoovers supplied operator financials, while Questel patent alerts helped track technology uptake in optical sorting and anaerobic digestion. These examples illustrate, but do not exhaust, the secondary sources consulted.
Market-Sizing & Forecasting
The top-down model begins with per-capita MSW generation, population, and waste composition ratios, then adjusts for recycling and WtE diversion to derive fee-eligible tons. Average collection and disposal fees, validated through contract disclosures, translate tons to revenue. Bottom-up revenue roll-ups from listed haulers and sampled transfer-station gate receipts serve as a reasonableness check before reconciliation. Drivers such as landfill tipping fees, EPR coverage, RNG plant capacity, urbanization rate, GDP per capita, and WtE utilization feed a multivariate regression that projects value through 2030. Gaps in sub-regional figures are bridged with population-weighted interpolation tested against operator disclosures.
Data Validation & Update Cycle
Outputs pass three tiers of review: automated variance flags, peer analyst cross-checks, and senior sign-off. We revisit models quarterly when regulatory or M&A events move fundamentals; otherwise, a full refresh is issued each year, and an analyst re-verifies figures just before delivery.
Why Our North America Municipal Solid Waste Management Baseline Commands Reliability
Published numbers differ because firms pick unequal scopes, disposal stages, or forecast horizons. Mordor Intelligence reports the entire MSW service chain and updates models annually, whereas others may freeze datasets for several years or omit recycling income.
Key gap drivers include narrower geographic cuts, exclusion of material-recovery fees, varying assumed average service prices, and slower refresh cadence.
Benchmark comparison
| Market Size | Anonymized source | Primary gap driver |
|---|---|---|
| USD 113.72 B (2025) | Mordor Intelligence | |
| USD 52.07 B (2025) | Global Consultancy A | Omits transportation revenues and uses 2019 pricing constants |
| USD 49.96 B (2025) | Trade Journal B | Covers only publicly funded collection, excludes private contracts |
| USD 20.00 B (2024) | Regional Consultancy C | Focuses on disposal equipment sales, not service revenues |
These comparisons show that when consistent scope, current tariffs, and verified diversion rates are applied, Mordor's baseline offers decision-makers a balanced view that can be traced to clear variables and repeated with confidence.


Key Questions Answered in the Report
What is the current size and growth outlook for the North America Municipal Solid Waste Management market?
The market stands at USD 118.81 billion in 2026 and is projected to reach USD 147.92 billion by 2031 at a 4.48% CAGR, supported by EPR programs, landfill methane controls, and RNG investments.
Which service areas are growing fastest within the North America Municipal Solid Waste Management market?
Recycling and material recovery are the fastest-growing services, advancing at an 8.4% CAGR as EPR shifts revenue from commodity dependence to fee-based processing.
How are policies influencing investment in the North American Municipal Solid Waste Management market?
State packaging EPR, organics mandates, and federal methane regulations are steering capital to MRF automation, composting, anaerobic digestion, and RNG, all underpinned by tax credits and producer-funded fees.
Which geographies lead and grow fastest within North America?
The United States held a 75.5% share in 2025, while Mexico is the fastest growing with a 7.7% CAGR through 2031.
What operational challenges are most material for waste operators in 2026?
Key challenges include elevated borrowing costs, recyclate price volatility, supply-chain lead times for equipment, and PFAS-related constraints on biosolids and compost outlets.
What strategic moves define the competitive landscape in North America?
Major actions include Waste Management’s Stericycle acquisition, Veolia’s Clean Earth deal, GFL’s Environmental Services divestiture, and Republic Services’ polymer and RNG projects, signaling focus on regulated waste, circular feedstocks, and energy monetization.
Page last updated on:


