Underwriting Software Market Size and Share
Market Overview
| Study Period | 2019 - 2030 |
|---|---|
| Market Size (2025) | USD 7.15 Billion |
| Market Size (2030) | USD 12.88 Billion |
| Growth Rate (2025 - 2030) | 12.48% CAGR |
| Fastest Growing Market | Asia Pacific |
| Largest Market | North America |
| Market Concentration | Medium |
Major Players *Disclaimer: Major Players sorted in no particular order Image © Mordor Intelligence. Reuse requires attribution under CC BY 4.0. | |

Underwriting Software Market Analysis by Mordor Intelligence
The underwriting software market size stands at USD 7.15 billion in 2025 and is projected to reach USD 12.88 billion by 2030, advancing at a 12.48% CAGR. Heightening competitive pressure from insurtechs, stricter regulatory mandates, and measurable productivity gains are pushing insurers toward platforms that combine artificial intelligence, machine learning, and cloud-native architectures. Automated risk assessment reduces cycle times from weeks to minutes, while predictive analytics elevate pricing accuracy and control loss ratios. Carriers are also prioritizing solutions that deliver real-time compliance monitoring, seamless data integration, and low-code configurability-capabilities that legacy mainframes cannot provide. Vendors able to bundle these features are capturing premium pricing power in software negotiations.
Key Report Takeaways
- By functionality, Automated Underwriting Systems captured 48.96% of the underwriting software market share in 2024, whereas Decision Support Systems are forecast to expand at a 15.50% CAGR through 2030.
- By deployment mode, on-premises platforms held 56.69% share of the underwriting software market size in 2024; cloud deployments are projected to grow at an 18.32% CAGR to 2030.
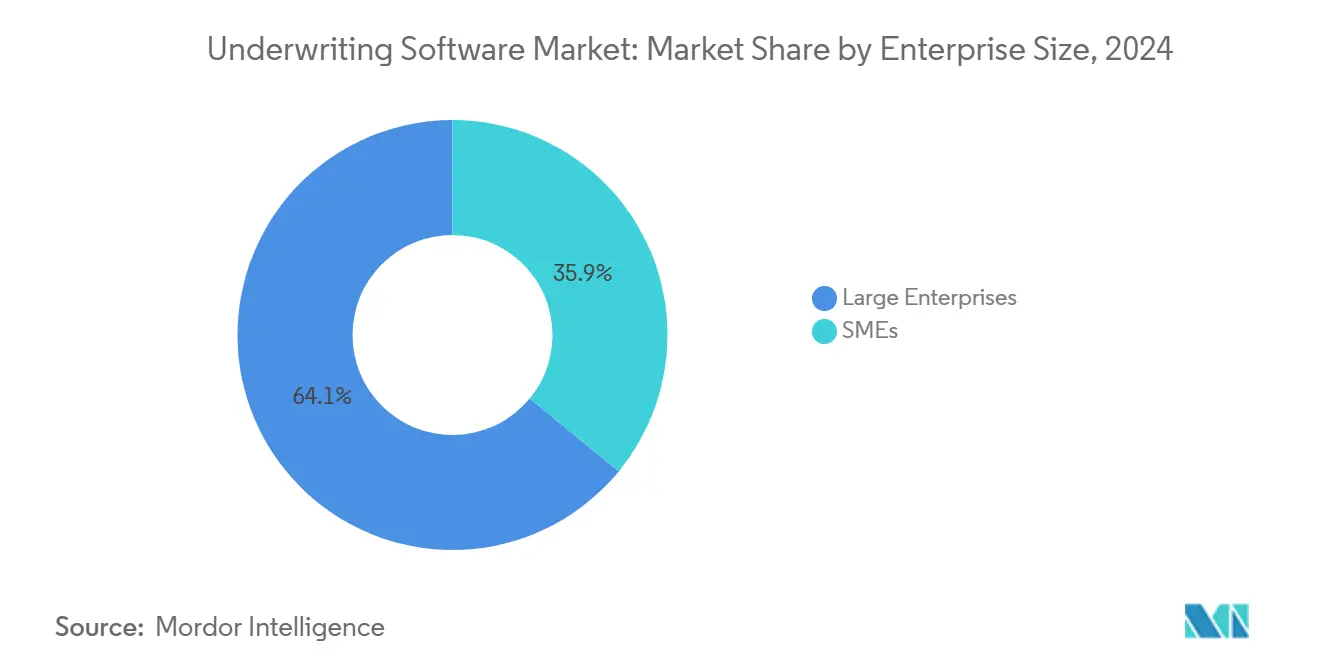
- By enterprise size, large enterprises led with 64.06% revenue in 2024, while SMEs are advancing at a 15.35% CAGR through 2030.
- By end user, insurance companies accounted for 63.97% of the underwriting software market size in 2024, and MGAs are growing fastest at a 17.20% CAGR through 2030.
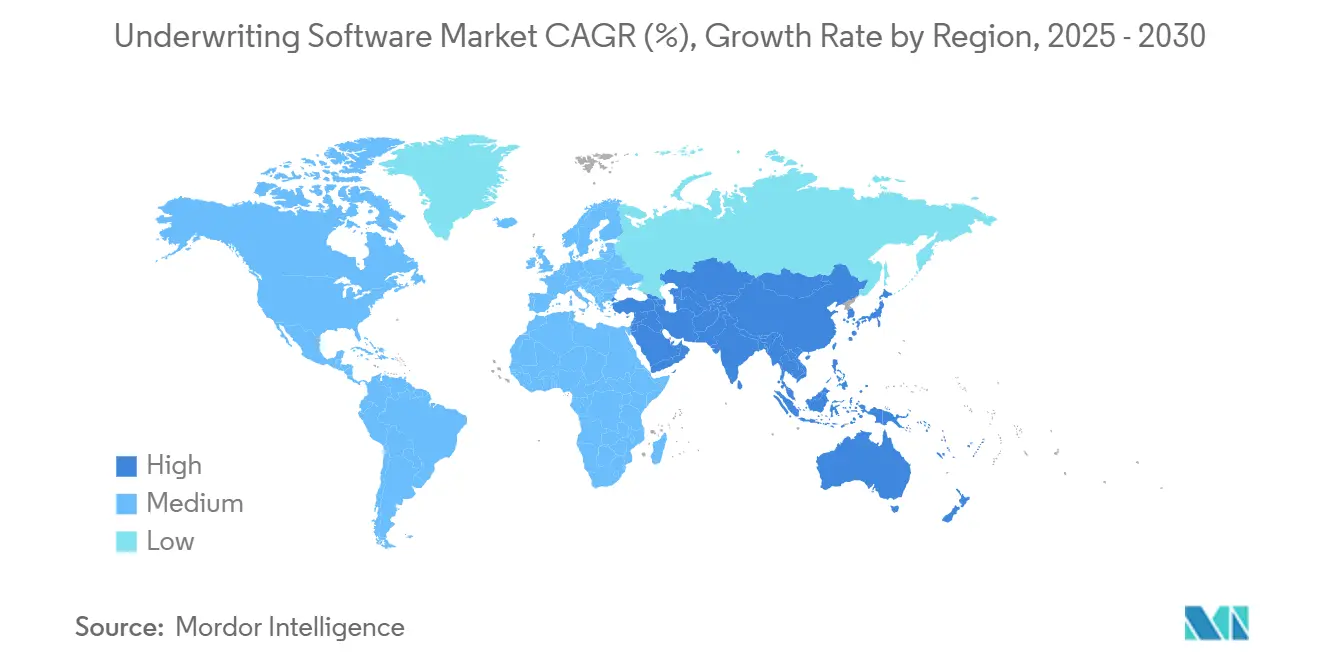
- By geography, North America commanded 39.13% of the underwriting software market share in 2024; Asia-Pacific is set to grow at a 16.97% CAGR to 2030.
Global Underwriting Software Market Trends and Insights
Drivers Impact Analysis*
| Driver | (~) % Impact on CAGR Forecast | Geographic Relevance | Impact Timeline |
|---|---|---|---|
| Automation demand in insurance processes | +3.2% | Global: North America and Europe strongest | Medium term (2-4 years) |
| Digital transformation of insurers | +2.8% | Global: rapid uptake in Asia-Pacific | Long term (≥ 4 years) |
| Data analytics for risk assessment | +2.5% | North America and Europe core; adoption widening in Asia-Pacific | Medium term (2-4 years) |
| AI and machine learning adoption | +2.1% | Global with regulatory variation | Long term (≥ 4 years) |
| Regulatory compliance focus | +1.4% | Europe and North America initially; spreading worldwide | Short term (≤ 2 years) |
| Insurtech innovations and partnerships | +1.0% | Global: hubs in major financial centers | Medium term (2-4 years) |
| Source: Mordor Intelligence | |||
Increasing Demand for Automation in Insurance Processes
Insurers are automating underwriting to overcome capacity constraints and standardize risk selection. Straight-through processing platforms now complete routine policy decisions in under two minutes, freeing human underwriters to focus on complex submissions. Halifax Mutual doubled premium volume without adding staff after implementing automated workflows. National Association of Insurance Commissioners (NAIC) model laws reward carriers that maintain consistent automated audit trails, further accelerating adoption. As a result, platforms that blend low-code configuration with AI-powered decision rules are becoming table stakes across personal and small commercial lines.
Digital Transformation in the Insurance Sector
Core-system modernization is at the heart of broader digital agendas. Cloud-native, API-first underwriting suites replace batch-oriented mainframes, enabling ingestion of IoT telemetry, third-party credit scores, and geospatial imagery in real time. Century Underwriting reduced underwriting cycle times by 60% after moving to a fully digital platform. [1]“Century Underwriting Digital Transformation with Evo Platform Results,” Insurance Technology, insurancetech.com Typical projects run 18-24 months, and bundled professional-services revenue now rivals license fees. While early adopters concentrate in North America, Asia-Pacific carriers are moving fastest, often leap-frogging to entirely cloud-based stacks.
Growing Use of Data Analytics for Risk Assessment
Predictive models powered by structured and unstructured data are redefining actuarial boundaries. Modern suites extract more than 95% of key data fields from documents and images in under 15 seconds. [2]“Insurance Document Processing Automation Case Study,” Multimodal.dev, multimodal.dev Satellite imagery and behavioral analytics sharpen peril scoring, reducing loss ratios and tightening pricing corridors. Regulators increasingly approve algorithmic underwriting if carriers can evidence model governance, version control, and explainability capabilities built into leading underwriting software market platforms.
Adoption of AI and Machine Learning Technologies
Machine-learning models improve with every exposure and claim event, enabling continuous repricing and real-time appetite steering. MassMutual’s patent filings on fluidless underwriting point to an industry striving for lab-free life insurance decisions. Vendors are pivoting toward embedded ethical-AI toolkits that flag bias and document decision trail transparency. The underwriting software market thereby gains a compliance-ready differentiator that slows copy-cat competition.
Restraints Impact Analysis*
| Restraint | (~) % Impact on CAGR Forecast | Geographic Relevance | Impact Timeline |
|---|---|---|---|
| High upfront costs and complex implementation | -2.3% | Global: acute for smaller insurers | Short term (≤ 2 years) |
| Data security and privacy concerns | -1.8% | Europe and North America under GDPR/CCPA | Medium term (2-4 years) |
| Organizational resistance to change | -1.2% | Global: entrenched incumbents | Long term (≥ 4 years) |
| Legacy-system integration complexity | -0.9% | North America and Europe with deep mainframe footprints | Medium term (2-4 years) |
| Source: Mordor Intelligence | |||
High Initial Costs and Implementation Challenges
Enterprise deployments can top USD 5 million, excluding services. Dual-running of old and new systems for 24-36 months strains budgets and resources, and services invoices often run 200-300% of license fees. Smaller carriers defer upgrades unless subscription-priced, cloud alternatives close the affordability gap—an opportunity cloud-native vendors quickly exploit.
Concerns Over Data Security and Privacy
GDPR and California Consumer Privacy Act (CCPA) impose strict data-handling rules that add 15-25% to project budgets. Multi-tenant clouds must localize data residency, while API links to third-party databases widen attack surfaces. The European Insurance and Occupational Pensions Authority’s sector guidelines amplify the compliance burden. Vendors respond with zero-trust architectures, encryption in transit and at rest, and continuous security posture monitoring baked into platform roadmaps.
*Our forecasts treat driver/restraint impacts as directional, not additive. The impact forecasts reflect baseline growth, mix effects, and variable interactions.
Segment Analysis
By Functionality: Automation Leads, Decision Support Accelerates
Automated Underwriting Systems contributed 48.96% of the underwriting software market share in 2024, confirming that straight-through processing is now mainstream. The segment’s depth lies in pre-built rule libraries, workflow orchestration, and no-code configurators that let product teams launch endorsements in minutes. Decision Support Systems, while smaller, will deliver a 15.50% CAGR to 2030 as complex commercial and specialty lines still require human judgment augmented by analytics. Integrated rating engines unify these streams, ensuring pricing consistency across distribution channels. Novum Underwriting Partners’ adoption of a unified platform underscores carrier preference for end-to-end suites that collapse silos. [3]“Novum Underwriting Partners Selects Insurity Platform,” Insurity, insurity.com
In practice, carriers toggle between full automation and guided intelligence depending on line of business, risk amount, and regulatory constraints. This functional convergence favors vendors able to package all three capabilities under one data model, a dynamic that is reshaping product roadmaps across the underwriting software market.


By Deployment Mode: Cloud Momentum Recasts Total Cost of Ownership
On-premises configurations retained 56.69% of the underwriting software market size in 2024, but cloud deployments are growing at 18.32% CAGR. The cost delta is striking: cloud-based models slash hardware and maintenance spend by 30-40% compared with legacy stacks. Insly’s MGA platform demonstrates two-week go-lives, versus six-month windows for on-premises rollouts. Regulatory data-sovereignty rules in Europe temper full public-cloud adoption, yet hybrid clouds are bridging the gap by keeping sensitive data on-premises while housing analytics in elastic cloud environments.
Subscription pricing also lowers capital hurdles, aligning IT spend with premium growth and smoothing expense recognition—an accounting nuance that resonates with CFOs.
By Enterprise Size: SMEs Narrow the Capability Gap
Large insurers held 64.06% revenue in 2024, reflecting deep pockets and sizable policy volumes. Nonetheless, SMEs will post a 15.35% CAGR, migrating to turnkey, cloud-native platforms that once seemed out of reach. Rising Tide Specialty launched MGA operations in under 90 days using a SaaS suite, proving small players can now match enterprise-grade underwriting rigor. The accessibility of pre-configured products, embedded regulatory templates, and pay-as-you-grow pricing opens the underwriting software market to a new cohort of digital challengers.
Incumbents respond by spinning up greenfield units on the same cloud stacks, keeping pace with agile rivals while quarantining legacy debt.
By End User: MGAs Become Technology Catalysts
Insurance companies commanded 63.97% of segment revenue in 2024, but MGAs are the growth engine, rising 17.20% CAGR as they absorb greater risk and seek carrier-grade toolsets. Federato’s aggregator model delivered a 3.7× increase in bound policies via automated triage and appetite steering. Reinsurers, brokers, and agents likewise onboard platforms that unify submission intake, triage, and pricing, extending the underwriting software market beyond traditional primary carriers.
MGAs’ niche focus and speed to market expose unmet functional gaps—such as delegated authority compliance tracking—that vendors now embed natively, further differentiating their stacks.
Geography Analysis
North America led with 39.13% share in 2024, underpinned by mature lines of business, dense agent distribution, and a well-funded insurtech ecosystem. State-based regulation drives demand for highly configurable rule engines capable of tracking 50-plus jurisdictions. Vertafore’s 2024 acquisition of Surefyre signals continued consolidation as platform vendors round out commercial-lines capabilities. Ample venture capital, experienced talent pools, and favorable cloud policies keep the region’s innovation cycle brisk.
Asia-Pacific is the fastest-growing territory at a 16.97% CAGR, reflecting expanding middle-class insurance uptake and government-backed digital agendas. Carriers leapfrog straight to cloud stacks, unencumbered by decades-old mainframes. Japanese innovators such as Sasuke Financial Lab now serve more than 45 carriers on multi-tenant systems tailored to local regulatory frameworks. Australia’s prudential standards and India’s IRDAI sandbox regulations further catalyze platform demand, making the underwriting software market a strategic priority for global vendors seeking new revenue lanes.
Europe clocks steady growth despite stringent GDPR and Solvency II rules that complicate architectural decisions. Carriers often opt for regional data centers and encrypted-edge deployments to reconcile efficiency with data-sovereignty mandates. A cloud adoption study found that 62% of European insurers introduced hybrid architectures in 2025. Brexit-driven data-flow uncertainties add complexity, yet also accelerate modernization as pan-European groups rationalize systems to cut costs and meet divergent reporting standards.
Latin America and the Middle East, and Africa remain nascent but promising. Local insurers face capital constraints and fragmented regulations, making pay-as-you-go SaaS suites appealing. Currency volatility pushes vendors to price in U.S. dollars and bundle localization to mitigate collection risk. As solvency frameworks mature, these regions are expected to feed the underwriting software market’s long-term expansion horizon.

Competitive Landscape
The field is moderately fragmented. Guidewire, Duck Creek, Applied Systems, and Vertafore anchor the legacy tier with broad product suites and deep integration networks. New-age players-Insurity, BriteCore, Socotra, and Federato—chip at their bases by offering microservice architectures, faster implementation, and embedded AI features. Strategic differentiation centers on four levers: breadth of pre-configured lines of business, openness of API ecosystem, built-in model governance, and total cost of ownership.
Funding flows illustrate market convictions. Ledgebrook attracted USD 115 million in Series C funding to scale its specialty-lines platform. Federato amassed USD 80 million to refine MGA-centric risk-selection tools. Acquisitions are equally brisk-Origami Risk bought DAIS to enhance analytics, while Xceedance acquired Millennium Information Services to bolster transformation services.
Traditional enterprise software firms such as Microsoft and Salesforce provide enabling cloud and CRM layers but lack underwriting depth; carriers instead gravitate toward sector specialists. Vendors that harmonize underwriting, policy administration, and claims on a single data model are best positioned to win multiproduct displacement deals.
Underwriting Software Industry Leaders
Guidewire Software, Inc.
Duck Creek Technologies
Applied Systems, Inc.
Oracle Corporation
Vertafore, Inc.
- *Disclaimer: Major Players sorted in no particular order


Recent Industry Developments
- March 2025: Fusion Specialty partnered with Insly to launch a digital MGA platform focused on specialty risks, introducing straight-through underwriting for niche segments.
- February 2025: Paperclip teamed with White Swan to embed AI-driven document processing into underwriting workflows, cutting manual data entry by 80%.
- November 2024: Vertafore acquired Surefyre to expand its commercial-lines footprint and accelerate mid-market growth.
- October 2024: Ledgebrook completed a USD 115 million Series C round led by Insight Partners to fund platform expansion across North America and Europe.


Global Underwriting Software Market Report Scope
| Automated Underwriting Systems (AUS) |
| Rating Engines |
| Decision Support Systems |
| On-premises |
| Cloud |
| Large Enterprises |
| SMEs |
| Insurance Companies |
| Insurance Brokers and Agencies |
| Reinsurers |
| MGA (Managing General Agent) |
| North America | United States | |
| Canada | ||
| Mexico | ||
| South America | Brazil | |
| Argentina | ||
| Rest of South America | ||
| Europe | Germany | |
| United Kingdom | ||
| France | ||
| Italy | ||
| Spain | ||
| Benelux | ||
| Nordics | ||
| Rest of Europe | ||
| Asia-Pacific | China | |
| India | ||
| Japan | ||
| South Korea | ||
| Australia and New Zealand | ||
| Rest of Asia-Pacific | ||
| Middle East and Africa | Middle East | Kingdom of Saudi Arabia (KSA) |
| United Arab Emirates (UAE) | ||
| Turkey | ||
| Rest of the Middle East | ||
| Africa | South Africa | |
| Nigeria | ||
| Egypt | ||
| Rest of Africa | ||
| By Functionality | Automated Underwriting Systems (AUS) | ||
| Rating Engines | |||
| Decision Support Systems | |||
| By Deployment Mode | On-premises | ||
| Cloud | |||
| By Enterprise Size | Large Enterprises | ||
| SMEs | |||
| By End User | Insurance Companies | ||
| Insurance Brokers and Agencies | |||
| Reinsurers | |||
| MGA (Managing General Agent) | |||
| By Geography | North America | United States | |
| Canada | |||
| Mexico | |||
| South America | Brazil | ||
| Argentina | |||
| Rest of South America | |||
| Europe | Germany | ||
| United Kingdom | |||
| France | |||
| Italy | |||
| Spain | |||
| Benelux | |||
| Nordics | |||
| Rest of Europe | |||
| Asia-Pacific | China | ||
| India | |||
| Japan | |||
| South Korea | |||
| Australia and New Zealand | |||
| Rest of Asia-Pacific | |||
| Middle East and Africa | Middle East | Kingdom of Saudi Arabia (KSA) | |
| United Arab Emirates (UAE) | |||
| Turkey | |||
| Rest of the Middle East | |||
| Africa | South Africa | ||
| Nigeria | |||
| Egypt | |||
| Rest of Africa | |||


Key Questions Answered in the Report
How large is the underwriting software market in 2025 and how fast will it grow?
The underwriting software market size is USD 7.15 billion in 2025 and is forecast to grow at a 12.48% CAGR to reach USD 12.88 billion by 2030.
Which functionality segment leads spending?
Automated Underwriting Systems lead with 48.96% share in 2024, reflecting carrier emphasis on straight-through processing efficiency.
Why are cloud deployments gaining traction among insurers?
Cloud platforms reduce total ownership costs by up to 40%, enable faster launches, and simplify compliance updates, driving an 18.32% CAGR for cloud deployments to 2030.
What drives MGA demand for underwriting technology?
MGAs need carrier-grade analytics and delegated-authority controls to price risk effectively and defend margins, resulting in a 17.20% CAGR through 2030.
Which region will expand fastest through 2030?
Asia-Pacific will register the highest regional growth at a 16.97% CAGR, supported by rising insurance penetration and government digitalization initiatives.
What key factor restrains adoption among small insurers?
High upfront costs and complex implementation efforts remain the biggest barriers, particularly for carriers lacking large capital budgets.
Page last updated on:


