Trading Card Game Market Size and Share
Market Overview
| Study Period | 2020 - 2031 |
|---|---|
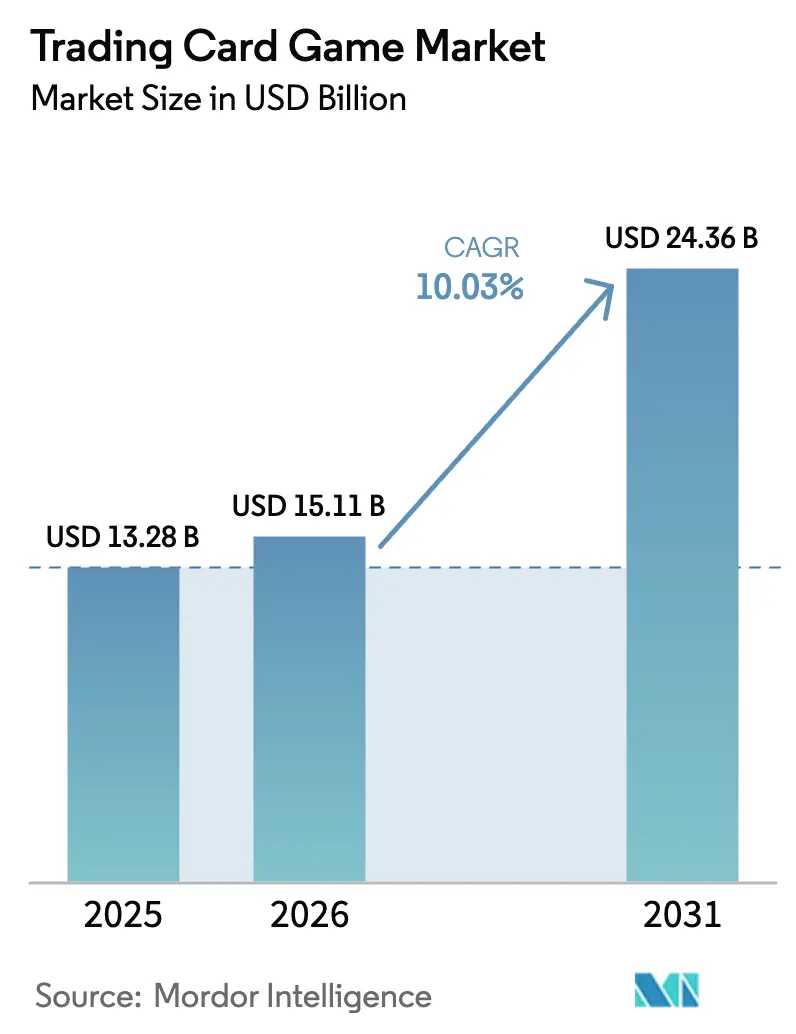
| Market Size (2026) | USD 15.11 Billion |
| Market Size (2031) | USD 24.36 Billion |
| Growth Rate (2026 - 2031) | 10.03% CAGR |
| Fastest Growing Market | Asia Pacific |
| Largest Market | Asia Pacific |
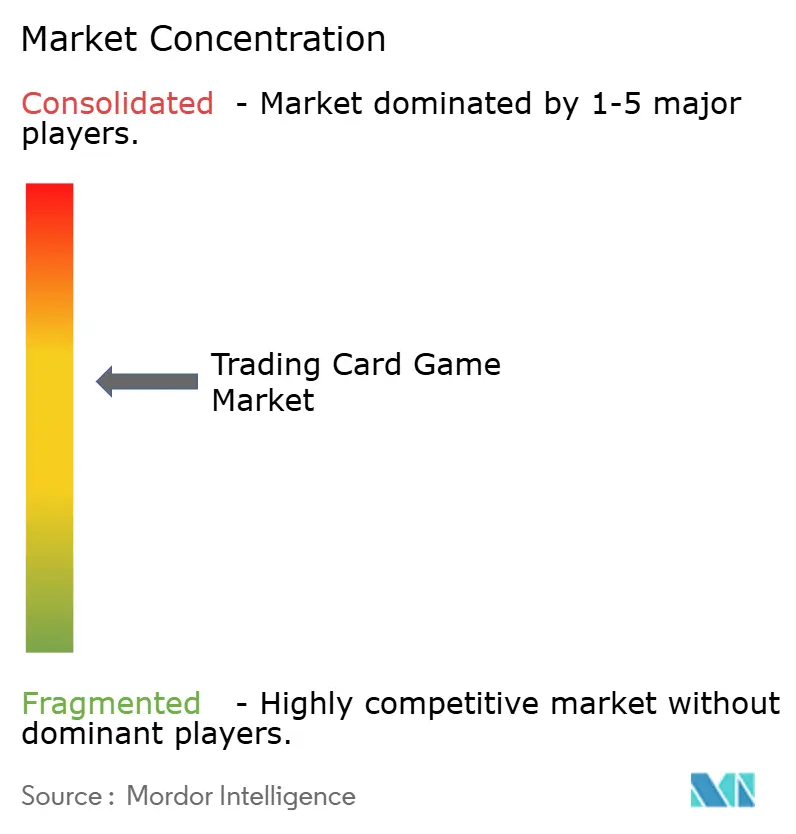
| Market Concentration | Medium |
Major Players *Disclaimer: Major Players sorted in no particular order Image © Mordor Intelligence. Reuse requires attribution under CC BY 4.0. | |
Trading Card Game Market Analysis by Mordor Intelligence
The Trading Card Game Market size is expected to increase from USD 13.28 billion in 2025 to USD 15.11 billion in 2026 and reach USD 24.36 billion by 2031, growing at a CAGR of 10.03% over 2026-2031.
Growth is fueled by digital distribution, rising adult investment demand, and expanding anime and sports licensing partnerships. Character cards secure enduring relevance through cross-media story lines, while sports-themed sets translate live-event excitement into card demand. Mobile-first platforms unlock high average revenue per user and broaden geographic reach, especially across Asia-Pacific. In North America, organized esports circuits and professional grading services deepen secondary-market liquidity and keep the trading card game market resilient despite raw-material cost pressure.
Key Report Takeaways
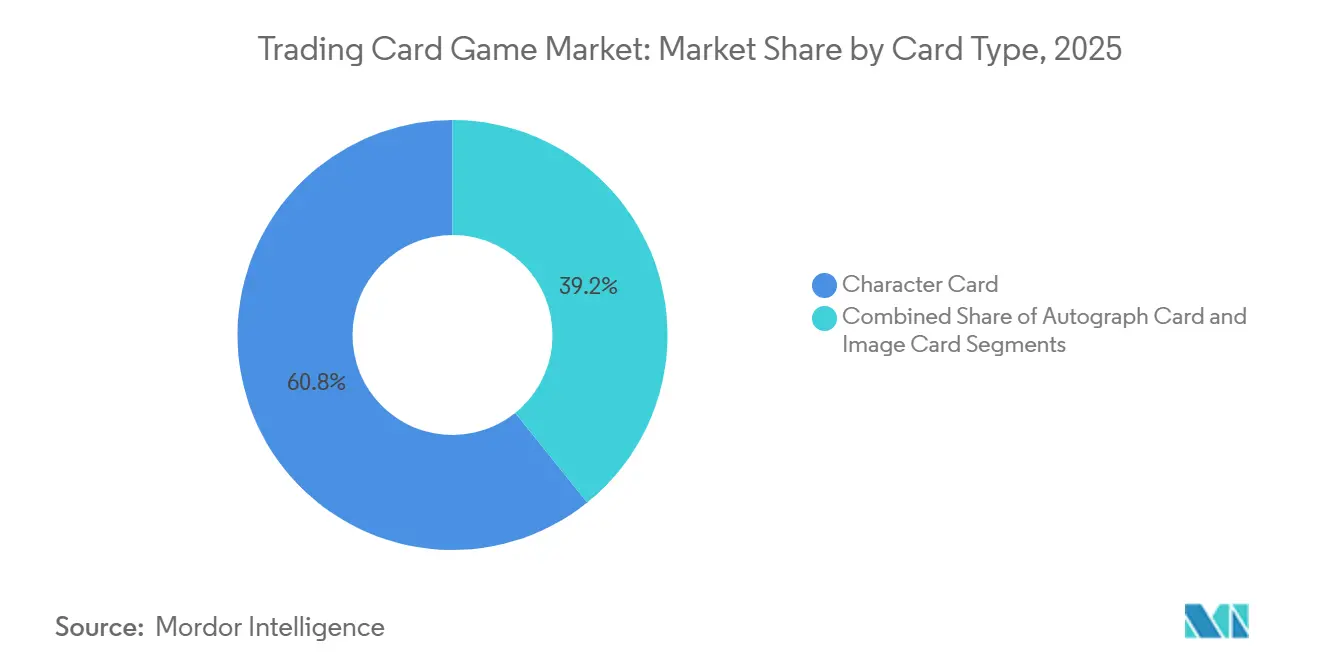
- By card type, character cards led with 60.78% of the trading card game market share in 2025; autograph cards are projected to expand at a 11.65% CAGR through 2031.
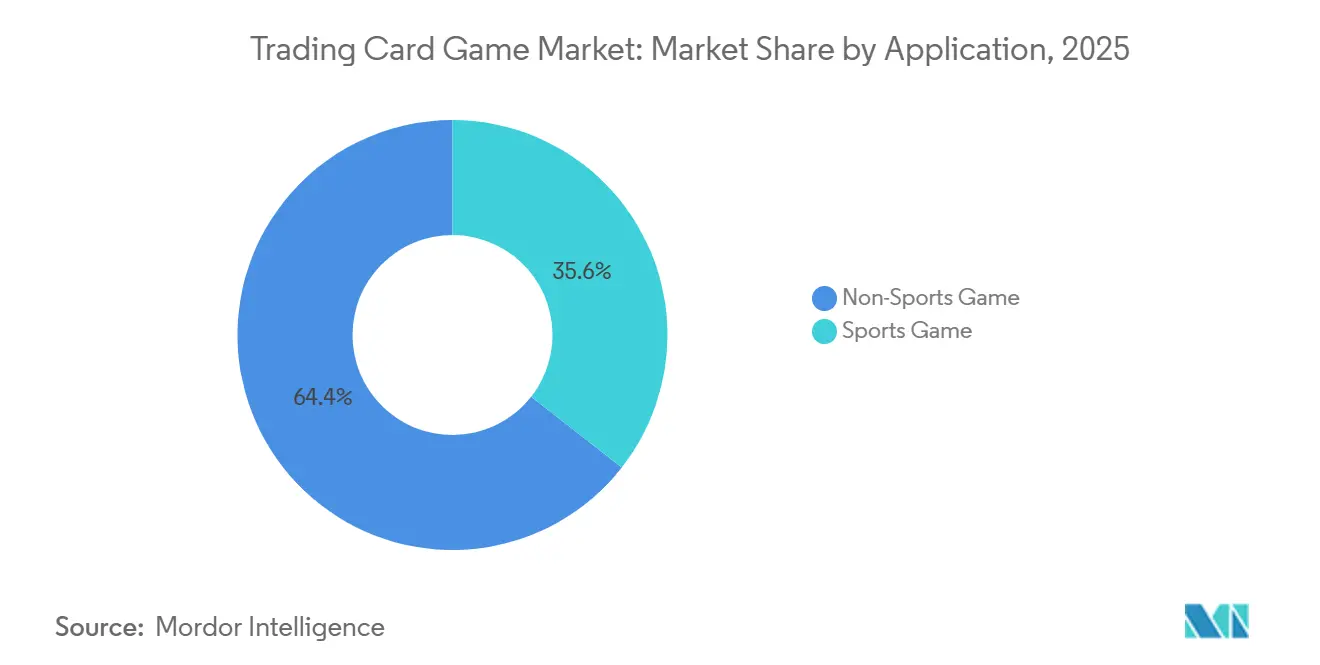
- By application, non-sports games held 64.43% of the trading card game market share in 2025, while sports titles recorded the fastest 11.23% CAGR to 2031.
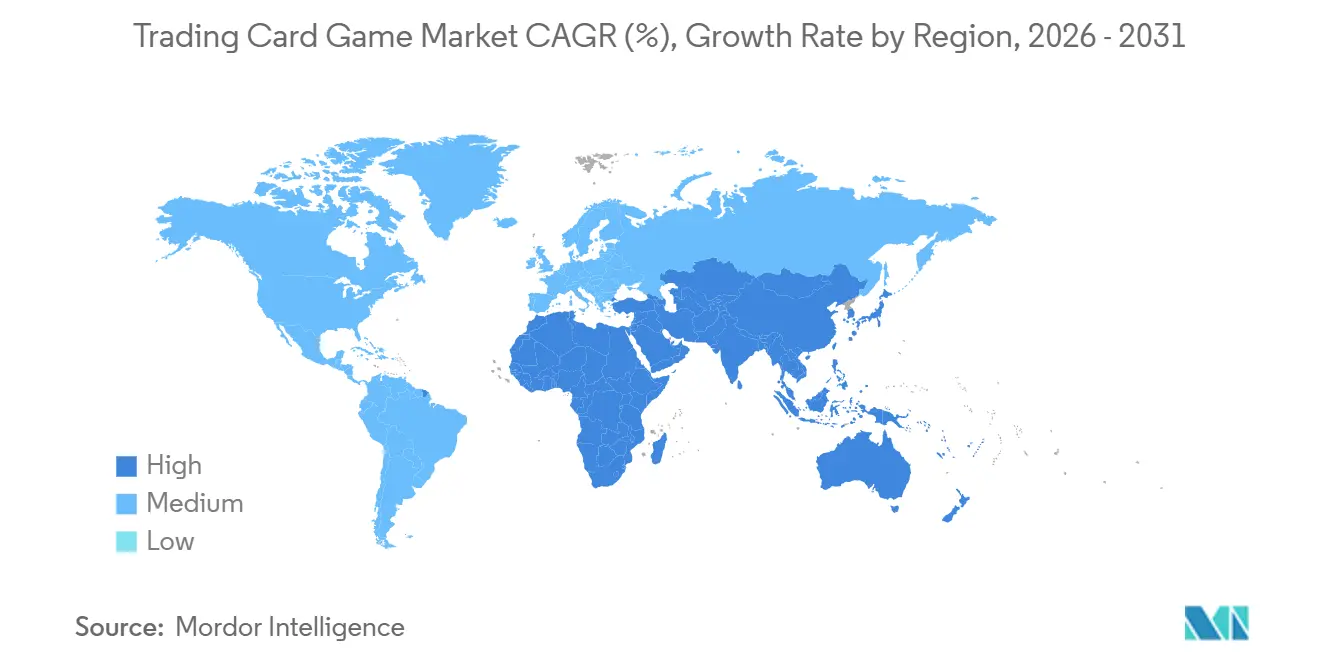
- By geography, Asia-Pacific accounted for 46.56% of the trading card game market size in 2025 and is advancing at a 11.04% CAGR over the forecast period.
Note: Market size and forecast figures in this report are generated using Mordor Intelligence’s proprietary estimation framework, updated with the latest available data and insights as of 2026.
Global Trading Card Game Market Trends and Insights
Drivers Impact Analysis*
| Driver | (~) % Impact on CAGR Forecast | Geographic Relevance | Impact Timeline |
|---|---|---|---|
| E-sports integration | +1.50% | North America, East Asia, Western Europe | Medium term (2-4 years) |
| Post-pandemic hobby stores revival | +1.20% | Western Europe, North America | Short term (≤2 years) |
| Adult collectors treating cards as investments | +1.80% | North America, East Asia | Long term (≥4 years) |
| Mobile-based digital TCGs | +2.00% | Asia-Pacific, Global | Medium term (2-4 years) |
| Source: Mordor Intelligence | |||
Esports integration driving organized play and media-rights monetization
Professional circuits now award sizable cash purses, while university leagues create talent pipelines. In the United States, streaming platforms such as Twitch attracted 127,500 average concurrent viewers for digital TCG broadcasts in 2024, up 32% year on year [1]Cards Realm, “Rise of Esports Card Games,” cardsrealm.com. Rights deals raise visibility, draw sponsors, and incentivize publishers to standardize rule sets, adding predictable seasonal content that sustains engagement. Retailers benefit from demand for tournament-legal reprints, and grading firms record higher submission volumes for prize cards sought by investors.
Post-pandemic resurgence of hobby stores boosting booster-pack sales
Specialty outlets have evolved into experiential hubs, offering demo stations, in-store tournaments, and trade nights. TCGplayer’s 2024 hobby shop awards highlighted retailers such as Aegis Games and BAM Goleta for converting casual visitors into repeat buyers through community programs [2]TCGplayer, “Voting for Hobby Shop of the Year 2024,” seller.tcgplayer.com. Foot traffic translates into sales of accessories, graded-card sleeves, and limited-edition sets that are rarely discounted online. These stores also host pre-release events that create localized hype and early secondary-market liquidity.
Rising adult collectors treating sports cards as alternative investments
More than 20 million cards were professionally graded in 2024, a 16% increase from 2023, with PSA processing 15.34 million submissions. PSA 10 rookie cards delivered an 18.3% one-year return, comfortably beating major equity benchmarks. Dedicated platforms now offer collateralized loans against graded portfolios, enabling liquidity without forced sales and positioning high-grade cards alongside other alternative asset classes.
Mobile-based digital TCGs delivering micro-transaction uplift
Web3 card titles earned an average revenue per user of USD 56.60 during 2024, far exceeding the USD 6.56 average for traditional digital releases. Pokémon TCG Pocket alone generated USD 90.4 million in February 2025. Impulse-driven pack openings, algorithmic rarity balancing, and seasonal battle passes combine to extend customer lifetime value. Publishers also experiment with on-chain ownership proofs, linking virtual pulls to redeemable physical counterparts.
Restraints Impact Analysis*
| Restraint | (~) % Impact on CAGR Forecast | Geographic Relevance | Impact Timeline |
|---|---|---|---|
| Counterfeit-card proliferation | -1.40% | Emerging Asia, Global | Medium term (2-4 years) |
| Supply-chain paper shortages | -1.10% | North America, Global | Short term (≤2 years) |
| Source: Mordor Intelligence | |||
Counterfeit-card proliferation undermining trust
Advanced forgeries now replicate holographic foils and micro-text, eroding buyer confidence, particularly in Southeast Asia, where authentication services remain scarce. Guides on identifying fake Pokémon cards receive sustained traffic. Blockchain provenance tags and embedded NFC chips offer technical countermeasures, yet add cost that can limit mass-market deployment. Lower transaction volumes and wider bid-ask spreads persist in marketplaces reporting repeated fraud incidents.
Supply-chain paper shortages raising production costs
Tariff disputes and mill closures restrict premium card-stock availability. Toy-and-game manufacturers flagged higher input bills and potential workforce reductions at the Chicago Toy and Game Fair. Publishers ration print runs, choosing between reprints of legacy sets and new expansion launches. Resulting scarcity lifts sealed-product prices for existing collectors but raises entry barriers for newcomers who need playable decks.
*Our forecasts treat driver/restraint impacts as directional, not additive. The impact forecasts reflect baseline growth, mix effects, and variable interactions.
Segment Analysis
By Card Type: Character cards extend cultural resonance
Character cards held a 60.78% trading card game market share in 2025, equivalent to roughly USD 3.35 billion in trading card game market size. Their appeal rests on cross-media storytelling that encourages collectors to chase complete narrative arcs, aligning with anime release calendars. Bandai Namco shipped 13.1 billion units cumulatively since 1988 and recorded an 18.1% year-on-year rise in card revenues to JPY 286.3 billion (USD 1.99 billion) in FY-2024. Advances in print technology introduce layered foils and security threads, lifting average selling prices and differentiating authentic products from counterfeits. Autograph cards, supported by athlete sign-and-send events, post a forecast 11.65% CAGR, while image cards retain niche relevance through limited promotional drops that foster completionist behavior.
Parallel rarity tiers create a laddered product hierarchy. Ultra-premium formats with serialized numbering and textured foils command immediate aftermarket demand and push the trading card game market toward luxury positioning. Publishers use scarcity structures to stagger launches, smoothing revenue between main set releases. Graders adjust authentication protocols to accommodate new materials, ensuring liquidity for high-end variants.


By Application: Sports titles dominate but non-sports sets accelerate
The sports games segment is expected to register the fastest growth in the trading card game market, with a 11.23% CAGR over the forecast period, buoyed by live statistical narratives that renew interest each season. Exclusive licensing deals, like Fanatics’ arrangements with major leagues, consolidate rights and may restrict smaller publishers’ market entry. Yet league partnerships guarantee supply of rookie storylines and championship memorabilia that anchor collector engagement. Non-sports properties, primarily fantasy, sci-fi, and anime, has captured 64.43% of the market share in 2025, thanks to flexible intellectual-property expansion and evergreen story arcs.
Non-sports franchises leverage streaming releases to spotlight new characters, with those characters immediately reflected in booster set drops. Asmodee notes that two non-sports flagships, Magic: The Gathering and Pokémon, contribute heavily to group revenue. Cross-platform animation, merchandise, and mobile games reinforce brand ecosystems and sustain higher per-player spend. Conversely, sports products face variable athlete performance and injury risk that can depress card values, prompting collectors to diversify into narrative-driven non-sports portfolios.
Geography Analysis
Asia-Pacific delivers the swiftest expansion at a 11.04% CAGR. Japan’s card segment alone reached JPY 286.3 billion (USD 1.99 billion) in FY-2024, underlining robust domestic fandom. Web3 mobile titles produced the highest per-user returns globally, validating the micro-transaction model. Anime exports accelerate demand in Southeast Asia and South America, where localized dubbing broadens reach. Regional publishers capitalize on smartphone penetration to bypass physical distribution challenges and test dynamic pricing events.
North America has captured 26.94% of the trading card game market share in 2025. High penetration of grading services, evidenced by PSA’s 15.34 million submissions in 2024, bolsters confidence in secondary trading. Supply-chain headwinds, notably elevated pulp prices, squeeze publisher margins, while exclusive sports licensing heightens antitrust scrutiny. Retail ecosystems still enjoy dense networks of hobby shops that anchor community tournaments and in-person buying.
Western Europe records mature but steady momentum, supported by a revitalized brick-and-mortar channel. Hobby shops invest in league nights that boost booster-pack velocity. Demographic drag from low birth rates necessitates marketing toward older cohorts possessing higher disposable income. Regulatory debate on loot-box mechanics pressures digital monetization strategies, prompting transparency mandates on pack odds .
South America rises as an adjacent opportunity, strengthened by anime licensing growth. Toei Animation logged record FY-2025 sales on the back of Dragon Ball and One Piece merchandise. Currency volatility and import fees present pricing challenges, but digital storefronts and region-specific promos soften barriers. Collectors gravitate to lower-cost starter sets before upgrading to graded imports, broadening market funnel depth.

Competitive Landscape
The trading card game market combines concentrated sports licensing with moderate innovation niches. Fanatics’ exclusive league pacts and acquisition of Topps consolidate sports segments, pressuring rivals to secure alternative distribution or pivot to digital-only releases. Asmodee demonstrates portfolio leverage, with five flagship lines supplying over half of net sales.
Technological adoption distinguishes leaders. Hasbro reports ongoing AI use across Magic: The Gathering design workflows, expediting card-set balancing and narrative integration. PSA’s purchase of Gentlemen Inc. embeds machine vision into grading, cutting turnaround times, and enabling throughput scalability [4]Professional Sports Authenticator, “AI-Driven Card Grading,” toolify.ai. Blockchain start-ups offer hybrid physical-digital drops, allowing collectors to authenticate ownership on-chain while redeeming physical versions, a model gaining traction for limited charters.
Smaller publishers carve niches through differentiated IP and community-driven kick-starter campaigns, achieving self-sustaining print runs. Autograph integration and crossover collaborations with entertainment franchises broaden appeal and mitigate dependence on long-term licensing. Rising costs of premium card stock encourage experimentation with recycled substrates and digital-only expansions that cut logistics overhead.
Trading Card Game Industry Leaders
Hasbro Inc.
The Pokémon Company International
Konami Holdings Corporation
Bandai Co. Ltd.
Bushiroad Inc.
- *Disclaimer: Major Players sorted in no particular order

Recent Industry Developments
- April 2025: Toei Animation posted record FY-2025 net sales and profit, underscoring anime IP momentum in the trading card game market.
- March 2025: Pokémon TCG Pocket revenue climbed to USD 90.4 million in February from USD 66.2 million in January.
- February 2025: Asmodee Group filed for a Nasdaq Stockholm listing as Class B shares, highlighting tabletop portfolio strength.
- February 2025: PSA acquired Gentlemen Inc. to integrate AI-driven grading technology.


Research Methodology Framework and Report Scope
Market Definitions and Key Coverage
Our study defines the trading card game (TCG) market as revenue generated from physical or digital, rules-based card titles in which players assemble decks, trade cards, and compete in organized play or casual matches. Values cover original pack and single-card sales, official digital downloads, and sanctioned tournament entry fees.
Scope Exclusion: pure memorabilia cards that carry no gameplay rules or organized-play format are outside the estimate.
Segmentation Overview
- By Card Type
- Character Card
- Autograph Card
- Image Card
- By Application
- Sports Game
- Non-Sports Game
- By Geography
- North America
- United States
- Canada
- Mexico
- South America
- Brazil
- Argentina
- Rest of South America
- Europe
- Germany
- United Kingdom
- France
- Italy
- Spain
- Rest of Europe
- Asia-Pacific
- China
- Japan
- South Korea
- India
- Rest of Asia-Pacific
- Middle East and Africa
- United Arab Emirates
- Saudi Arabia
- South Africa
- Rest of Middle East and Africa
- North America
Detailed Research Methodology and Data Validation
Primary Research
Mordor analysts spoke with card publishers, grading services, tournament organizers, and specialty-store chains across North America, Europe, and Asia-Pacific. These discussions validated active-player counts, average selling prices, and typical print-run depletion rates, filling gaps left by patchy disclosure and confirming model assumptions.
Desk Research
Publicly available datasets from bodies such as the US Census Bureau, Japan Toy Association, Eurostat, and the World Trade Organization offered shipment, retail, and trade clues, while player-base indicators were gauged through PSA population reports and Esports Earnings logs. Company filings, hobby-store footfall trackers, and reputable press helped us refine pack pricing and launch calendars. Proprietary subscription tools, including D&B Hoovers for issuer revenue splits, Dow Jones Factiva for launch news flow, and Volza for booster-box export manifests, supplied further granularity. The sources named illustrate the breadth consulted; many additional references supported data checks and clarifications.
Market-Sizing & Forecasting
A top-down construct begins with retail sales and export data, which are then aligned with active player pools and average spend per player. Results are stress-tested through selective bottom-up roll-ups of sampled publisher revenue and hobby store sell-out surveys. Key variables shaping the model include booster box average price, registered tournament entries, graded card submissions, digital download volumes, and IP licensing frequency. An ARIMA-based forecast projects these drivers forward, with scenario ranges reviewed against expert expectations. Any bottom-up shortfall is bridged by calibrated penetration rate adjustments before final sign off.
Data Validation & Update Cycle
Outputs pass three-step variance checks, peer review, and senior analyst approval. Annual refreshes align with fiscal disclosures, while material developments, major IP launches, regulatory shifts, or supply shocks trigger interim updates so users always access the latest view.
Why Mordor's Trading Card Game Baseline Commands Reliability
Published figures often diverge because firms pick different inclusions, exchange-rate bases, or refresh cadences. Our disciplined scope, multi-variable model, and annual update rhythm temper these pitfalls, giving decision-makers a balanced starting point.
Benchmark comparison
| Market Size | Anonymized source | Primary gap driver |
|---|---|---|
| USD 7.51 B (2025) | Mordor Intelligence | - |
| USD 13.01 B (2024) | Global Consultancy A | Adds apparel, sleeves, and accessories; limited primary validation |
| USD 7.43 B (2024) | Industry Association B | Excludes official digital TCG apps, understating growth regions |
| USD 7.80 B (2024) | Regional Consultancy C | Uses static currency conversion and biennial updates |
These contrasts show that, by selecting only gameplay-linked revenues and by refreshing each year, Mordor offers a transparent, repeatable baseline that investors and strategists can trust.


Key Questions Answered in the Report
What is the current value of the trading card game market?
The trading card game market generates USD 15.11 billion in 2026, with a 10.03% forecast CAGR toward 2031.
Which card type holds the largest market share?
Character cards account for 60.78% of trading card game market share, attracting collectors through narrative-driven artwork and premium finishes.
Why are mobile-based digital TCGs important for growth?
Mobile platforms deliver higher average revenue per user, USD 56.60 for Web3 titles, by combining micro-transactions, battle passes, and live events.
Which region is expanding fastest in trading card games?
Asia-Pacific leads with a projected 11.04% CAGR, supported by strong anime IP ecosystems and smartphone penetration.
How are publishers combating counterfeit cards?
Solutions include embedded NFC chips and AI-enhanced grading that authenticate cards and improve secondary-market trust.
What effect do exclusive sports-licensing deals have on the industry?
They intensify concentration among a few rights-holders, raising barriers for newcomers and steering smaller studios toward niche or digital-only strategies.
Page last updated on:


